Association of self-reported different aspects
of workplace environment and general
well-being with maximum workload – A cross-
sectional study
Word count: 11,029 words
Rumana Ahsan
____________________________________________
Master Degree Project in International Heath, 30 credits. Spring 2018
International Maternal and Child Health
Department of Women’s and Children’s Health
Abstract
IntroductionCardiovascular disease (CVD) is the leading cause of death globally and similarly in United Kingdom (UK), accounting for 31% and 45% annual deaths respectively. Workplace environment consists of different elements (e.g.- physical and psychosocial environment, intra and extra organizational settings) and interrelationship of employer and employee, playing an important role on workers’ health. Current study aims to identify the association of different aspects of workplace environment and general well-being with maximum workload (MW) in a working population in UK.
Method
A cross-sectional study has been done including a total of 77,781 working people aged 39 to 72 years old who participated voluntarily in the UK Biobank baseline assessment cohort study. Exposures were self-reported that included information about both physical and psychosocial aspects of workplace environment and general well-being. The outcome variable was maximum workload calculated during electrocardiogram (ECG) stress test. Three different statistical models were tested through ordinal logistic regressions using the SPSS software.
Results
No/low health satisfaction was associated with reduction in maximum workload and this association was constant in all analytical model, both in crude (B -0.786, 95% CI -0.825, -0.748) and adjusted models (B -0.866, 95% CI -0.910, -0.823). Other variables regarding different aspects of workplace environment and well-being showed no statistically significant result on the adjusted models.
Conclusion
Health satisfaction may be considered as an important determinant of CVD among middle and old-aged working population. Future research required to establish the result and to formulate preventive measures in workplace for better health outcome of workers.
Used abbreviations
ANS – Autonomic nervous system BMI – Body mass index
CASE – Cardiac Assessment System for Exercise Testing CVD – cardiovascular diseases
ECG – Electrocardiogram
ERI model – Effort-reward imbalance model MW – Maximum workload
NCD – Non-communicable diseases PSF – Psychosocial factors
SD – Standard deviation
TDI – Townsend deprivation index UK – United Kingdom
Table of Content
1. Introduction Page 6-15
1.1 Global context of cardiovascular diseases ... Page 6 1.2 CVD in Europe and in UK ... Page 6 1.3 Cardiovascular diseases ... Page 6 1.4 Workplace environment ... Page 7 1.5 Workplace environment and CVD ... Page 7 1.5.1 Psychosocial aspects of workplace environment and CVD ... Page 7 1.5.2 Physical aspects of workplace environment and CVD ………. Page 9 1.5.3 General well-being and CVD ... Page 10 1.6 Further cardiovascular research opportunities from large sample ... Page 11 1.7 Maximum workload as a predictor of CVD ... Page 12 1.8 Aim ... Page 14 1.9 Research question ... Page 15
2. Method Page 15-28
2.1. Study design and setting ... Page 15
- Figure 2: Different study locations in UK
2.2. Study populaion and sampling ... Page 16
- Figure 3: Inclusion and exclusion criteria
2.3. Data collection and procedure ... Page 17 - Figure 4: Different steps of assessments
2.3.1 The UK Biobank questionnaire ... Page 18 2.3.2 Physical and functional measurement ... Page 18 2.3.3 Biological sample collection ... Page 19 2.4. Variables ... Page 19 2.4.1 Independent variables ... Page 19 - Table 1: Questions used to know about different exposures of workplace environment Page 20 2.4.2 Dependent variable ... Page 21 2.4.3 Covariates ... Page 22 - Table 2: Questions used to know about different covariates ……….. Page 24 2.5. Statistical analysis ... Page 25 - Table 3: Models used for the analysis ………... Page 26 2.6 Missing data ... Page 27
- Table 4: Amount of missing data in different variables ………. Page 27 2.7 Ethical consideration ... Page 28
3. Results Page 29-37
3.1 Study population characteristics ... Page 29
- Table 5: Baseline characteristics of the participants ……… Page 29
- Table 6: Occupational characteristics of the participants ……… Page 31 - Table 7: Frequencies for different aspects of workplace environment and
general well-being ……….. Page 32 3.2 Crude analysis ... Page 33
- Table 8: Crude analysis of all predictor variables and all co-variates with maximum workload (Model I) ……… Page 34 3.3 Adjusted analysis ... Page 35
- Table 9: Adjusted analysis of all predictor variables, all co-variates and Maximum workload (Model II and III) ……….. Page 36
4. Discussion Page 37-42
4.1 Results summary ... Page 37 4.2 Comparison to other studies ... Page 38 4.3 Strengths ... Page 39 4.4 Limitations ... Page 40 4.5 Generalizability and public health impact of the results ... Page 41
5. Conclusion Page 42 6. Acknowledgement Page 43 7. References Page 44
1 Introduction
1.1 Global context of cardiovascular diseases
Non-communicable diseases (NCDs) have been identified as 21st century’s dominant and slow motioned emergency public health challenge. Cardiovascular disease (CVD) is a major contributor to the burden of non-communicable diseases (NCDs) (1). CVD is the leading cause of death globally, and thus responsible for the highest number annual deaths worldwide compared to any other causes. CVD is responsible for accounting one in every three deaths worldwide (2). According to WHO, in 2015, the number of deaths due to CVDs were around 17.7 million, representing the leading cause (31%) of deaths globally (3). It is assumed that 23.6 million people will die due to CVDs, mainly because of heart disease and stroke by the year of 2030 (4).
1.2 CVDs in Europe and in UK
The leading cause of death in Europe is CVD (5) and causes more than half of all deaths across the European Region. Moreover, among them 80% of premature heart disease and stroke is preventable (6). In Europe, over 85 million people were existing with CVD and the number of new cases are less than 11.3 million (7). CVD has been mentioned as the principle cause of death in UK and causing 245,000 deaths annually, accounting for premature deaths respectively 36% in men and 27% in women (8). More than a quarter of total number of all deaths and 15% of all DALYs lost in England and Wales occurred due to cardiovascular disease. (9) A self-reported study among employees in UK, around 80,000 people reported to have CVD that is either caused or became worse by the work (8).
1.3 Cardiovascular diseases
Disorders of heart and blood vessels that include cerebrovascular disease, coronary heart disease, rheumatic heart disease and other conditions (peripheral vascular disease, congenital heart disease and hypertension) of cardiovascular system are known as cardiovascular diseases (CVDs) (10). According to WHO, a group of disorders of blood vessels and heart consisting of different conditions are termed as cardiovascular disease (4). The exact causes of developing CVD is still not clear and a number of risk factors can increase the chance of developing CVD in an individual (11). Many risk factors are associated with development of cardiovascular disease and they can be divided in – modifiable risk factors and non-modifiable risk factors (12). High blood pressure, high serum-cholesterol level, diabetes mellitus, alcohol intake, smoking habit, unhealthy dietary habit, obesity and lack of physical activity have already been established as well-known risk factors for CVD (13).
1.4 Workplace environment
The environment, in which people work is simply known as workplace environment. But, in reality, it is a very wide category consisting of different elements. It includes not only the physical setting of a job place, but also encompasses various job characteristics, comprehensive organizational features and other aspects of setting that is extra organizational. All these different properties of the workplace environment can affect physical well-being or psychosocial well-being or both. On the other hand, it can also affect beneficially both health aspects in an individual - the physical aspect and psychosocial aspect (14). Workplace environment is the total sum of the interrelationship between the employers and workers and also the entire environment where people work, consisting of technical, organizational and human environment (15).
1.5 Workplace environment and CVD
There is an old relationship between work environment and increased risk of cardiovascular diseases (16). The possible mechanism behind the association between the work environment and the risk of developing CVD is still not clear. Directly activated neuroendocrine system by the work stressors could be the underlying mechanism behind CVD. On the other hand, unhealthy lifestyle behaviors like – unhealthy dietary habits, sedentary lifestyle, excessive consumption of alcohol or smoking can also be responsible for such a relation. (17). In cross-sectional studies among men, reduced variability of heart rate has been found to be associated with work stress due to repeated activation of the ANS, one of the main axis of neuroendocrine stress responses. (18,19). Moreover, hypothalamic–pituitary–adrenal axis may be dysregulated by the work condition and that is also related to the disturbance of the circadian rhythm of cortisol and the development of the metabolic syndrome (20–22). Most research have been conducted on finding relationship between work environment and cancer, reproductive issues and diseases of musculoskeletal system. So far, less attention has been paid to the research in finding association between different aspects of the work environment and diseases of cardiovascular system (23).
1.5.1 Psychosocial aspects of workplace environment and CVD
The possible mechanism behind this relation could be of two types such as – direct mechanism (through physiological variable) and indirect mechanisms (through behavioral risk factors). Changes in physiological variable may include rise in blood pressure and serum cholesterol level, increase in left
ventricular mass, higher concentrations of different hormones (e.g. - catecholamines), plasma fibrinogen and glycated hemoglobin. Different behavioral risk factors like smoking and drinking habit may also influence the relation indirectly. But, social support may help to reduce the job strain effect on the above mentioned effects (24). Two models are commonly used to assess the work condition and they are - the ‘job effort-reward imbalance model’(ERI) and the ‘job demand-control model’ (25,26)..In a prospective study among blue collar male workers, association between low reward or low status control and high extrinsic (e.g. – work pressure) or intrinsic (e.g. – high need for control) efforts has been established that can predict newly developed cardiovascular events independently (27). Another two independent studies described the role of these variables in explaining cardiovascular risk factor prevalence (25). An average of 50% more risk for CVD has been observed related to work stress among the employees (28). Another study have also been conducted to explore the association between work stressors and CVD which experienced the more risk for CVD (29). Few studies have demonstrated that psychological pressure and CVD incidence can be affected by high levels of job strain (30–34).
In the ‘INTERHEART’ study involving 52 countries, 32.5% population attributable risk has been found for myocardial infarction that derived from modifiable psychological factors (stress at home, stress at work, stress due to financial condition, life events) and placed PSF in third position as a risk factor for myocardial infarction (35). Also, consistent results have been found about the relationship between job strain and higher risk for cardiovascular disease on the exposed people (24). Another study found strong association between decreased job satisfaction with low or moderate level of perceived stress, but the association was different for men and women. Still, there is a research gap between job satisfaction and CVD risk factors (e.g. – Blood pressure, BMI, level of blood cholesterol, smoking and alcohol habit) adjusted to age (36).
1.5.2 Physical aspects of workplace environment and CVD
Employees spend about 8 to 12 hours in their workplace, surrounded by different physical environments (e.g. – temperature, quality of air, noise and lighting conditions) that can affect well-being, work performance and productivity of the employee (37). A strong and positive association between exposure to tobacco smoke from other people smoking and higher risk of CVD morbidity and mortality has been detected. Also, different chemical exposures found responsible for elevating the CVD risk (38). Noise is an unpleasant sound which commonly causes hearing loss that is the most common among occupational diseases and also responsible for creating stress among employees. Excessive noise elevates the level of plasma hormones such as – cortisol and adrenaline and increase the heart rate that may trigger the CVD risk factors (39–41). A cohort study among male workers suggested that chronic exposure to noise in
workplace can independently rises systolic blood pressure (42). Hazardous chemical exposure was also reported to increase the physiological levels of brain-derived neurotrophic factor (BDNF), leptin and other neurotransmitters (e.g. – serotonin, catecholamines and dopamine), which all together increase the desire of food intake and as a result increase the CVD occurrence among the workers (43–45). Previous studies have shown that occupational exposure to high level of hazardous chemicals among workers of a petrochemical factory result in high prevalence of hypertension (46) and that high level styrene exposure increased the prevalence of CVD in exposed workers, compared to those with a low level of styrene exposure (45,47). Different occupations like – agricultural workers, construction workers, miners, armed forces personals, fire fighters, manufacturing workers etc. are exposed to different levels of heat exposure in their workplaces. Combination of external heat (from environment) and internal body heat (from metabolism) causes total heat gain. In the workplace, there are two types of sources for external heat exposure such as – weather related heat exposure and man-made heat exposure (48). Chronic exposure for heat in the workplace has been reported to have adverse and long-term effects on health (e.g. – cardiovascular diseases) (49). Another study, both noise and heat exposure in the workplace found to be associated with cardiovascular problems (50). Both heat and cold exposure in the workplace are linked to higher risk of acute onset cardiovascular events and significant rise in silent ST depression reported to have correlation with cold exposure (less than 200) among women workers (8). Slightly increased CVD mortality risk has been detected due to occupational exposure of fiber dusts among women textile workers of China (51).
1.5.3 General well-being and CVD
Well-being is a wider concept that consists of a range of theoretical approaches such as – eudaimonic well-being, social well-being and hedonic well-being. Positive components of psychological health can be reflected by positive psychological well-being and characterize individuals who feel good about their life as well as they can function well (52). There is enough evidence for an established association between positive psychosocial well-being and cardiovascular health. Decreased risk of CHD incidents and mortality has been found to be associated with optimism in few studies (53,54). A study among middle aged cohort investigated the association of emotional vitality and optimism with CHD incident, reporting a consistent association between higher levels of well-being and lower risk of CHD (52). Moreover, associations of Coronary heart disease with three specific stress-related negative emotions namely anger, depression and anxiety - were established by another study (55). Individuals with high level of psychological stress are at higher risk of incident CVD compared to less stressed individual (54). The exact mechanism behind this association is still obscure. However, a possible mechanism could be an excessive hypothalamic–pituitary–adrenal (HPA) axis and sympathetic-adrenomedullary system activation. Simultaneously, alteration of autonomic cardiac control, acceleration of atherosclerosis and health-related behaviors are also involved. Proposed potential mediators for psychological stress and
CVD relationship are multiple stress-related hormones such as – catecholamines and cortisol (54). In elderly people, cardiovascular disease is a psychosomatic disease. Nonetheless, most previous researches investigated different health status changes that caused as a result of negative emotion and only few researches that focused on relationship between positive emotion and CVD. Positive emotion is considered as one of the protective factor in elderly people against health problems and somehow remain ignored by the researchers. Also, a significant relationship of blood pressure with positive emotion has been found in elderly people (56). Moreover, life satisfaction has been counted as a predictor of morbidity and mortality, independent of objective measures of health status. A strong linear relationship has been observed between low satisfaction of life with risk of CVD while assessed by using Framingham Risk Score (FRS) among the Polish adults (57).
1.6 Further cardiovascular research opportunities from large sample
Different modifiable and non-modifiable risk factors, cause and consequences of CVD have been stated by many researchers in different epidemiological studies at different time point conducted either within individual countries or globally (58). Studies have also established how the traditional and novel risk factors of CVD can play a vital role in development of the disease. The measures to predict the subclinical condition of CVD or related to CVD as well as assessment of short or long-term risk of CVD are also available. Such measures can help identifying individuals who would get maximum benefit from risk-factor interventions, and helped developing and implementing multiple intervention strategies (59). For instance, the INTERHEART study, a case-control study conducted to detect the association between myocardial infarction and effect of modifiable risk factors in 52 countries (60). Same study was used successfully as an evidence-based study for implementing feasible and low-cost strategies for prevention of chronic diseases in India (61). The study also highlighted how the potential and modifiable risk factors playing their role in the causation path of acute myocardial infarction. Similarly, another project conducted by the WHO, called the MONICA (Multinational monitoring of trends and determinants in cardiovascular disease) project, played a significant role in giving training to the cardiovascular epidemiologist and also by creating standards for measurement which can be applied internationally (62). The Framingham Heart study was successful to detect a range of risk factors that were important and associated with cardiovascular disease (63). Moreover, the Seven Countries Study influenced the treatment for the primary and secondary prevention of different events of cardiovascular health (58). Similarly, the UK Biobank is a very large and population-based prospective cohort study and was established for detailed investigations of disease determinants (both genetic and non-genetic) among middle and old aged population (64). This study recruited 500,000 participants in their baseline assessment study to collect health and health related information and includes ongoing comprehensive
follow-up studies to characterize many different health-related outcomes. Overall, the UK Biobank study aimed to combine wide-ranging and more precise assessment of different exposures and maximize the access to available resources for promotion of innovative science. Such a large and prospective cohort can be used to study recognized and novel risk factors of several diseases in a much wider range, as well as to assess exposures before the onset of the disease (64). Many cohort studies, however, consist of collection of less comprehensive data in spite of having large sample sizes and biological samples, resulting in production of few outcomes. To address all these issues, UK Biobank was created combining a large sample size and a broad range of data regarding exposures and outcomes that could be useful in diagnosis, treatment and prevention of diseases among middle and old age people. This is a well-designed and reliable cohort for detecting and generalizing associations between health outcomes and most characteristics of the baseline study. Three-fold increased interest for UK Biobank data has been found in last 4 years, more notably from international researchers and predominantly from researchers of United states and mainland Europe (58). For example, more recently a study using UK Biobank data established an association between higher likelihood of adiposity and a subset of favorable adiposity alleles which in turn associated with decreased risk of hypertension and heart disease (65). Another genome-wide analysis study identified the link between novel genetic variants and phenotypes of blood pressure (66). Exploration of strong association between exposure and outcome along with development of risk prediction model is possible from such a dataset with or without validation (67). Tremendous opportunities for different researches are present within the UK Biobank data which can be used in numerous ways by the researchers to diagnose, treat or prevent cardiovascular diseases.
On the other hand, studies with small sample size can be concluded with statistically less powerful results which could hide the real effect or other associated minor effects and may cause difficulty in generalizing the result.
1.7 Maximum workload as a predictor of CVD
Maximum workload (MW) or maximum exercise capacity has been defined as the maximum amount of physical exertion that can be sustained by a person. Adequate testing of several body systems functions, particularly the functions of circulatory system and respiratory system, can be assessed during exercise (68). Exercise workload is an important prognostic variable that can be derived from exercise stress test. Exercise test is a non-invasive and relatively inexpensive clinical tool and exercise capacity is a strong and independent outcome predictor (69). A very strong and independent predictor of premature mortality is maximal exercise capacity and the achieved maximal workload can be measured in Watts or MET (metabolic equivalent or O2 consumption at rest) (70,71). An association has been found between good
exercise capacity and reduced number of myocardial infarction, ischemia with ST-segment depression, revascularization and mortality (72). For all-cause mortality, exercise capacity was found as better
predictor compared to maximum heart rate achieved during exercise test and the angiographic severity of coronary artery diseases (72). In another study, a correlation was found among right ventricular systolic function indices with maximum exercise capacity in healthy individuals (73). In men with or without existing cardiovascular disease, weak exercise capacity has been proven as an important and strong marker of having increased risk of CVD (69).
On the other hand, systolic blood pressure and age-predicted maximal heart rate achieved during the exercise stress test seem to be less effective in measuring the exertion level of a patient with myocardial ischemia (74). Also, 85% maximal predicted heart rate achievement significantly misjudged the capacity of exercise and inducible ischemia and thus cannot be counted as a valid diagnostic or functional endpoint of exercise (75). Irrespective of age and gender, higher workload that is achieved during exercise stress test eligible for prediction of improved survival rates (69,76,77).
1.8 Aim
This thesis aims to identify the association of different working environment related factors and general well-being with maximum workload in a working population in the United Kingdom. Maximum workload was measured by a screening method (ECG stress test) in Watts (W). If a positive association is found, better working environment can be created or maintained and better policies can be structured or implemented in the workplace to prevent cardiovascular diseases among working people’s and thereby the rate of non-communicable disease related morbidity and mortality can be reduced.
1.9Research question
Are different aspects of workplace environment and general well-being associated with maximum workload recorded during ECG stress test among current or previous working population?
This study hypothesized that exposure to different aspects of workplace environment and general well-being could be associated to the risk of cardiovascular disease when measured by the stress test derived maximum workload.
Null hypothesis (Ho): There is no association of different aspects of workplace environment and general well-being with the risk of cardiovascular disease among current or previous exposed workers compared to non-exposed population.
Alternative hypothesis (H1): There is an association of different aspects of workplace environment and
general well-being with the risk of cardiovascular disease among current or previous exposed workers compared to non-exposed population.
2 Methods
2.1 Study design and setting
A cross-sectional study was done to examine the association between working environment and maximum workload which was measured by values recorded during the electrocardiogram test (ECG). This study uses data from the UK biobank which is a large, population-based and comprehensive prospective cohort study (64), and was first conducted among 500,000 voluntary participants having different socio-economic and ethnic backgrounds and the large cohort size was chosen based on the statistical power calculations. The baseline data were collected between the year of 2006 to 2010 in 22 assessment centers situated in different locations of United Kingdom (UK) and in both urban and rural settings. At baseline, the aim was to assess different exposures and familiar risk-factors of diseases. Longitudinal follow-up is ongoing for characterizing different and large number of health-related outcomes.
Figure 2: Different study locations in UK
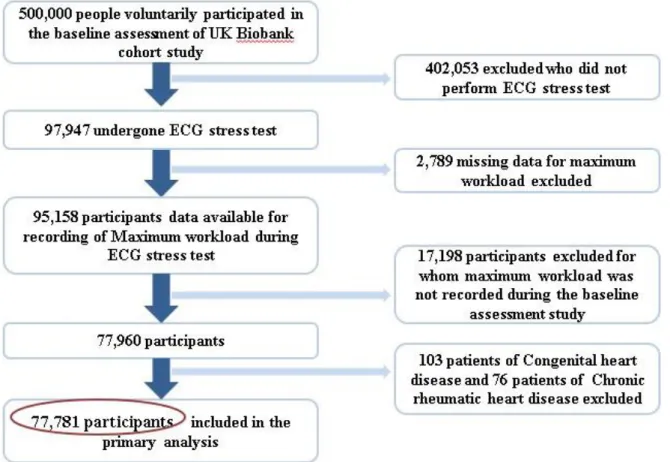
2.2 Study population and sampling
In this study, analysis was restricted to factors related to working environment and general well-being and only included those who participated in the stress ECG recording test (n = 77,960) at the baseline assessment study. Participants with congenital heart problems (n = 103) or with chronic rheumatic heart
diseases (n = 76) at the baseline assessment were excluded from the current study. This study finally included 77,781 participants of both sexes (male & female) from the UK Biobank cohort study within an age range of 39 to 72 years.
Figure 3: Inclusion and exclusion criteria
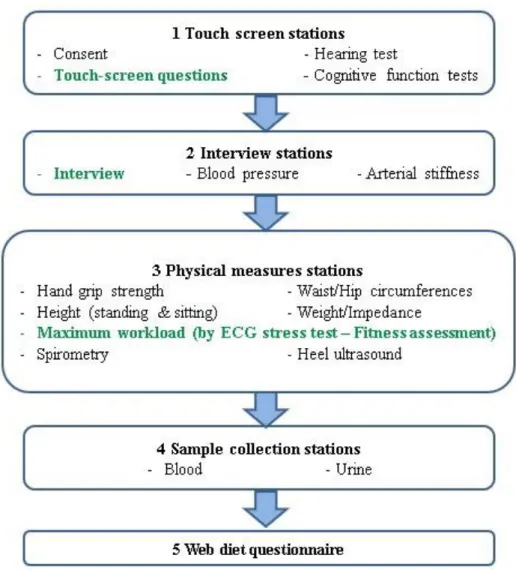
2.3 Data collection and procedure
For the collection of data participants were invited by mail and only voluntary participants joined the UK Biobank baseline assessment study. Selected participants from the baseline study reported about different medical and health conditions, socio-demographic and lifestyle information, employment and working environment conditions, family and medical history and about intake of medication during baseline assessment and assistance of trained health professionals were used when required. Data was collected by using different measures – self-completed touch-screen questionnaire, computer assisted brief interview (CAI), different physical and functional measurements and biological sample collections (blood and urine) (64). All these processes take only few minutes to complete and most of them were automatically stored to the central system. Some processes require a single trained staff either to monitor or assist the procedure. Short descriptions of all processes are given below (78) –
Figure 4: Different steps of assessments
2.3.1 The UK Biobank Questionnaire –
2.3.1.1 Self-completed touch-screen questionnaire:
Questions were prioritized depending on some standard criteria and in relation to potential exposures and confounders. It was a touch-screen questionnaire which was easy to fill, allowed more privacy for the participants and was automatically stored safely. Cognitive function test was done as a part of this assessment. Questionnaire was formulated based on previously used platforms by other large-scale studies and was built specifically for the UK Biobank study. This section was used to collect majority of the information.
2.3.1.2 Computer assisted personal interview (CAPI):
Information provided during the touch-screen procedure that required more detail or in-depth questioning, was collected by using this procedure. This consisted in a 5 to 10 minutes personal interview and was controlled by trained staff. Participants completed a ‘pre-visit aide memoire’ to provide difficult to recall or time-consuming information.
Baseline measurements were selected from a piloted study that was conducted before the baseline assessment study. Only selected measurements from the pilot study were included in the baseline study and several physical and functional measurements were taken from all participants. Blood pressure and pulse rate, weight, height, waist and hip circumference, bio-impedance, handgrip strength, spirometry, bone densitometry were measured by trained health staff and 4-lead electrocardiogram (ECG) were conducted at this stage. Maximum workload was calculated during the ECG stress test for each individual.
2.3.3 Biological sample collection -
Blood and urine samples were collected as a part of baseline assessment study.
2.4 Variables
Multiple variables were investigated to address the main purpose of this study. Detailed explanation of the main variables with collecting procedure are given as below -
2.4.1 Independent variables
Different aspects of workplace environment (physical aspects and psychosocial aspects) and general well-being
Employment status and job -related details were taken from the participants using both processes and all information given by the participants were self-reported. Firstly, participants information were gathered with respect to their current and/ or previous occupation which later used to classify them in different job groups following ‘Standard Occupational Classification 2000’ (79). Considered physical aspects of workplace environment are – exposure to noise, heat, cold, dust, chemicals or fume, passive smoking in the workplace. As psychosocial aspects of workplace environment one variable was considered such as – work or job satisfaction. For both physical and psychosocial working environment same patterned questions were asked to all participants (Table 1) and these questions were formulated for the UK Biobank Study. Four responses were used for each variable related to physical aspect of workplace environment depending on the answers of the participants. Nine different type of responses were used for psychosocial aspects related to workplace environment that was also based on participants answers. Four different types of answer options that were used for each variable related to physical aspect of workplace environment were recoded as two responses, where 1 stands for Yes and 0 stands for No (Table 1). The answers that is chosen by the participants as ‘do not know’ were recoded as missing data (999). General well-being factors included happiness, family relationship and health satisfaction. Different type of responses (Eight responses for each of the three well-being variables) were used for general well-being factors that was also based on participants answers. All variables were recoded similarly as the physical aspect and all recoded with binary scales where 1 represented as Yes and 0 represented as No. Similarly,
who preferred not to answer and who chose do not know answer were recoded as missing data. Only the variable ‘Work/job satisfaction’ had one extra response option than well-being factor responses named – I am not employed, was also recoded as missing data = 999.
Table 1: Questions used to know about different exposures of workplace environment and general well-being
Different aspects of workplace environment
Used questions Used scales
Original options Recoded options
A. Physical aspects of workplace environment
4 options 2 options
1)Workplace very noisy "Thinking about the place where you worked: Was it very noisy?"
a. Often b. Sometimes
Yes (1)
c. Rarely or never No (0)
d. Do not know Missing data (999) 2) Workplace very hot "Thinking about the place where you
worked: Was it very hot?"
Same as above Same as above
3) Workplace very cold "Thinking about the place where you worked: Was it very cold?"
Same as above Same as above
4) Workplace very dusty "Thinking about the place where you worked: Was it very dusty?"
Same as above Same as above
5) Workplace full of chemical or other fumes
"Thinking about the place where you worked: Was it full of chemical or other fumes?"
Same as above Same as above
6) Workplace had a lot of cigarette smoke from other people smoking
"Thinking about the place where you worked: Was there a lot of cigarette smoke from other people smoking?"
Same as above Same as above
B. Psychosocial aspects of workplace environment
8 options 2 options
Happiness In general, how happy are you? a. Extremely happy
b. Very happy c. Moderately happy Yes (1) d. Moderately unhappy e. Very unhappy f. Extremely unhappy No (0)
h. Prefer not to answer Health satisfaction In general, how satisfied are you with
your health?
Same as above Same as above
Family relationship satisfaction In general, how satisfied are you with your family relationships?
Same as above Same as above
Work/job satisfaction In general, how satisfied are you with the work that you do?
9 options 2 options a. Extremely happy b. Very happy c. Moderately happy Yes (1) d. Moderately unhappy e. Very unhappy f. Extremely unhappy No (0) g. I am not employed h. Do not know i. Prefer not to answer
Missing data (999)
2.4.2 Dependent variable
Maximum workload during fitness test
ECG bike test was conducted to calculate the maximum workload of an individual by attaining maximum workload during the test. The used ECG device is a CAM-USB 6.5 that had been operated by using the Cardiosoft v6.51 software and the used stationary bike was an eBike that was operated by using the Firmware v1.7 software. This test consisted of three phases – Pre-test phase (resting ECG for 15 seconds), Activity phase (bike pedaling for 6 minutes) and Recovery phase (rest on bike for 1 minute) and was tested by using a stationary e-bike in conjunction with a 4-lead electrocardiograph (ECG) device. Few screening questions were asked by the operator following a questionnaire about existing medical problems declared by doctor, and also about chest pain and physical activities to the participants. Cycling level and rate was determined by considering different risk categories and an absolute maximum workload was assumed for each participant prior to the actual test using the following formula: (80–82): Absolute maximum workload = 105.2749 + (-0.0935 x AGE) + (-0.0280973 x AGE x AGE) + (2.809493 x SEX) + (119.0087 x HEIGHT) + (0.309456 x WEIGHT) + (-2.698067 x RHR) + (0.0090985 x RHR x RHR) + (-0.3783405 x AGE x SEX) + (60.72548 x HEIGHT x SEX) + (-0.15016 x WEIGHT x SEX) + (-0.3730664 x RHR x SEX) + (0.0180811 x RHR x AGE)
Here, AGE was counted from date of birth in years, HEIGHT was measured in meters in the biometric stage of the assessment, WEIGHT was also taken in the biometric stage which was measured in Kilogram (Kg) and RHR = Resting heart rate that was counted as beats per minute (bpm). Finally, maximum workload was calculated in Watts which was actually attained by each participant during the ECG stress test and automatically measured by the operating software called Cardiac Assessment System for Exercise Testing (CASE), Cardiosoft v6 (6.51). Cardiac Assessment System for Exercise Testing (CASE) software system is an innovative algorithm that help to assess cardiac function more conveniently during exercise and has a greater diagnostic confidence with proven clinical excellence (80). Moreover, the final recorded value of maximum workload was not calculated using any formula or algorithm and did not include participants age or sex anywhere in the value recording process.
2.4.3 Covariates Age:
Age was calculated in years at the day of visiting assessment center during the baseline assessment study and was counted from self-reported individual’s date of birth in years.
Sex:
Participants of both sexes - male and female were included in the baseline study. Participants sex were acquired from the central registry which was updated by the participants.
Minor ethnic group:
Participants did self-reporting about their ethnicity in the touch-screen questionnaire procedure. Ethnicity was then recoded as dividing them into major and minor ethnic groups depending on their total percentages. Major ethnic group only includes White, while minor ethnic groups consisted of other ethnic backgrounds – Black, Asian, Mixed and Others (Table 2).
Socio-economic status:
Socio-economic condition was detected by the ‘Townsend deprivation index score’ which is a census-based index and calculated by four census-census-based variables which are – households without a car, households not owner occupied, overcrowded households and persons unemployed. Each variable divided by the appropriate count of households or persons to get a percentage score and then standardized using a Z-score. The single value obtained from the sum of the standardized scores are known as Townsend deprivation index (83). High material deprivation indicated by a positive value and negative value indicates affluence. In the baseline study, TIA was calculated immediately prior to joining of the participants and that was based on preceding national census output areas. A score corresponding to the output area in which their postcode is located were assigned to each participant.
Participants were divided into two main categories based on their college or university level degrees. One group had qualification equal to or more than college level degrees (college/university degree) and also included people having different professional degrees. The other group of people has education below college level to not educated at all (Table 2).
BMI
Body mass index is a continuous variable that was constructed by calculating from the measured individual’s height and weight during the baseline assessment. Measurements of the height and weight were done by the trained staffs.
Moderate physical activities
Number of days of physical activities per week that was done by each participant was self-reported by the participants during the stage of touch-screen questionnaire. Participant who did physical activities at least more than or equal to ten minutes (except walking) in one day were counted as moderate physical activity done per day and were recorded with the number of days of moderate physical activity in a week with eight responses ranging from zero to seven days (Table 2).
Alcohol intake frequency
Frequency were recorded depended on consumption of alcohol by an individual participant in general that was asked by a simple question and were reported by the participants. Responses were six in numbers such as – never, special occasions only, 1-3 times per month, once or twice a week, 3-4 times a week and daily or almost daily. These responses were used similarly in the analysis as the meaning of different responses vary from each other (Table 2).
Smoking status
Participants completed questionnaires about their smoking status whether they smoke currently or previously was a smoker. The state of never smoking was also present in the responses and were chosen by those participants who never smoked at all (Table 2).
Occupation (Job code):
Professions of the participants expressed as ‘job code’ that were classified into nine major occupational groups following ‘Standard Occupational Classification 2000’ (79) and participants were allotted to a specific occupational group according to their current or previous profession.
Job involves shift work and Job involved shift work
These are two different co-variates and both conditions that job recently involve shift work or not and also previously involved shift work or not were mentioned by the participant. ‘Jobs involved shift work’ was expressed with binary response of either yes or no. The other variable ‘Job involves shift work’ was recoded with three responses – never, sometimes and usually or always. Shift work means day shift work or night shift work or both (Table 2).
Working duration of the participants were self-reported and were recorded in hours for one week (Table 2).
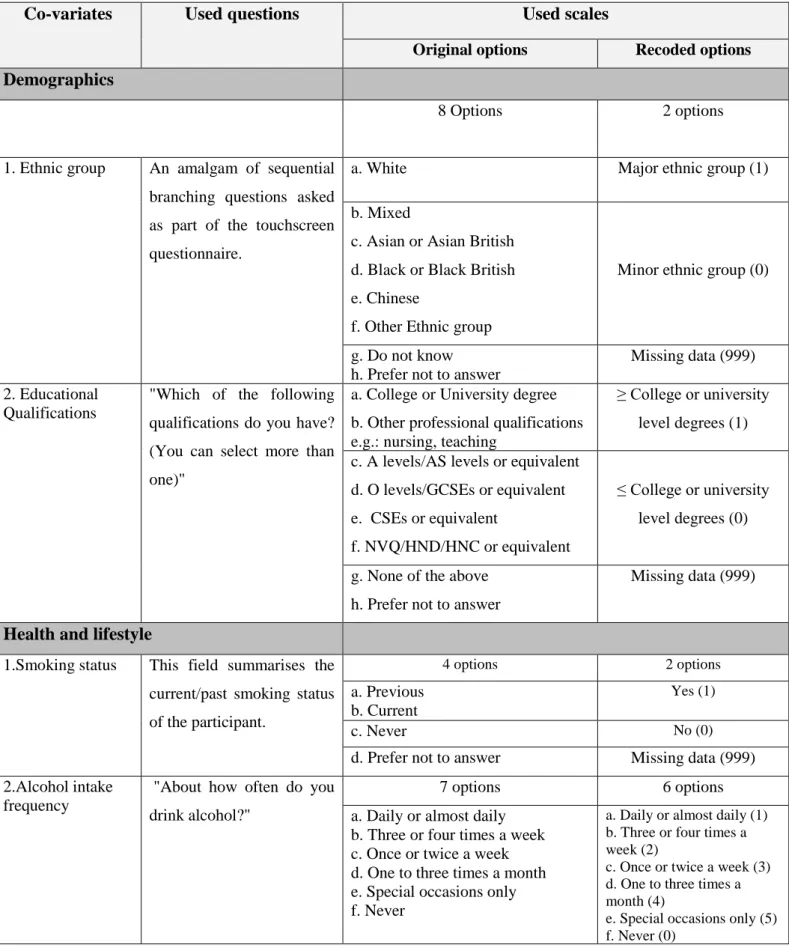
Table 2: Questions used to know about different co-variates
Co-variates Used questions Used scales
Original options Recoded options
Demographics
8 Options 2 options
1. Ethnic group An amalgam of sequential
branching questions asked as part of the touchscreen questionnaire.
a. White Major ethnic group (1)
b. Mixed
c. Asian or Asian British d. Black or Black British e. Chinese
f. Other Ethnic group
Minor ethnic group (0)
g. Do not know h. Prefer not to answer
Missing data (999) 2. Educational
Qualifications
"Which of the following qualifications do you have? (You can select more than one)"
a. College or University degree b. Other professional qualifications e.g.: nursing, teaching
≥ College or university level degrees (1) c. A levels/AS levels or equivalent
d. O levels/GCSEs or equivalent e. CSEs or equivalent
f. NVQ/HND/HNC or equivalent
≤ College or university level degrees (0)
g. None of the above h. Prefer not to answer
Missing data (999)
Health and lifestyle
1.Smoking status This field summarises the current/past smoking status of the participant. 4 options 2 options a. Previous b. Current Yes (1) c. Never No (0)
d. Prefer not to answer Missing data (999)
2.Alcohol intake frequency
"About how often do you drink alcohol?"
7 options 6 options
a. Daily or almost daily b. Three or four times a week c. Once or twice a week d. One to three times a month e. Special occasions only f. Never
a. Daily or almost daily (1) b. Three or four times a week (2)
c. Once or twice a week (3) d. One to three times a month (4)
e. Special occasions only (5) f. Never (0)
g. Prefer not to answer Missing data (999) 3. Number of days
per week of
moderate physical activity
"In a typical WEEK, on how many days did you do 10 minutes or more of moderate physical activities like carrying light loads, cycling at normal pace? (Do not include walking)"
Options include –
a. 0 to 7 days 0 day to 7days
b. Do not know c. Prefer not to answer
Missing data (999)
Occupational characteristics
Job involves shift work
"Does your work involve shift work?" 6 options 2 options a. Sometimes b. Usually c. Always Yes (1) d. Never/Rarely No (0) e. Do not know f. Prefer not to answer
Missing data (999) Job involved shift
work
"Did you ever work shifts (day and/or night shifts**) for this job?"
2 options 2 options
a. Yes Yes (1)
b. No No (0)
Work hours (per week)
"On average, how many hours a week did you work?"
Entered a precise number of hours Same as original
**Day-shifts were defined as work in normal daytime hours or morning, afternoon or evening work. Night-shifts were defined as work for at least 3 hours between midnight and 5am.
2.5 Statistical analysis
SPSS software was chosen to perform all statistical analysis. IBM SPSS Statistics 22 version has been used for the purpose of recoding and analysis of the data. At first, all required variables were placed to create the dataset in a sav format file and then was imported to the SPSS software. Then, desired variables were recoded and reordered according to the need of the analysis. All the independent variables used in this study were recoded as binomial outcome (Yes = 1 and No = 0) and the outcome variable used was ordered to set as 10th percentile groups. The outcome variable was recorded during the ECG stress test as a continuous variable for which the measurement unit was Watts (W). But, this variable failed to meet the assumption of normality when tested. So, logit conversion was applied which also did not meet the normality assumption. Finally, the outcome variable was converted to a categorical variable (ordinal) of 10th percentile (10th, 20th, 30th, 40th, 50th, 60th, 70th, 80th, 90th and 100th). SPSS software was also used for getting frequency distributions and numerical summaries of the used variables.
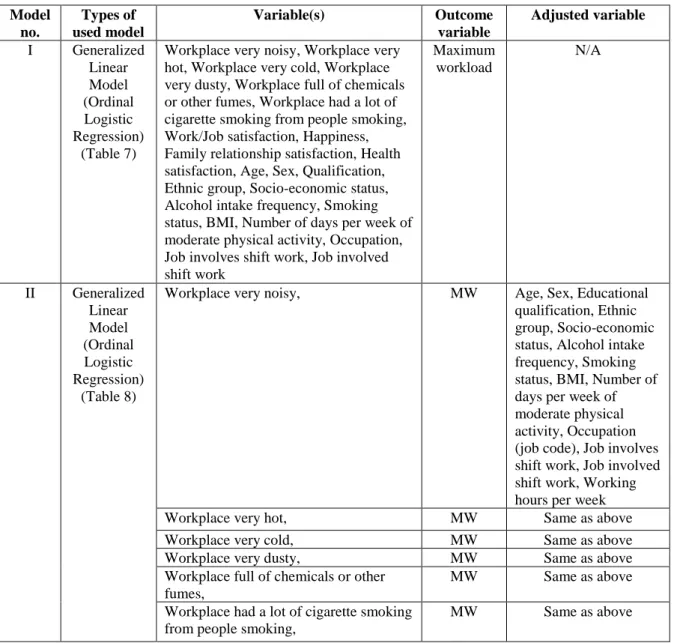
Chosen variables and data overview were summarized initially and Ordinal logistic regression models were performed for the analysis of data. The values for significant result in all analysis were set as < 0.005 for the p-value (p = < 0.005) and 95% for the confidence interval (95% CI), adjusted for multiple comparisons according to Bonferroni’s approach. In total, three models were tested to assess the crude and adjusted association between predictor variables, dependent variable and covariates and ordinal logistic regression models were tested as the dependent variable was converted to an ordinal variable. (Table 3) In model I, crude analysis was done for each predictor variable and each co-variate where the outcome variable was maximum workload. In every model, the outcome variable was fixed to maximum workload. Another two models (model II and III) were done as adjusted analysis to compare with the crude results. Each predictor variable was adjusted for all co-variates in model II and all predictor variables adjusted for all co-variates together in model III. The used models are described in detail on a table below (Table 3).
Table 3: Models used for the analysis
Model no. Types of used model Variable(s) Outcome variable Adjusted variable I Generalized Linear Model (Ordinal Logistic Regression) (Table 7)
Workplace very noisy, Workplace very hot, Workplace very cold, Workplace very dusty, Workplace full of chemicals or other fumes, Workplace had a lot of cigarette smoking from people smoking, Work/Job satisfaction, Happiness, Family relationship satisfaction, Health satisfaction, Age, Sex, Qualification, Ethnic group, Socio-economic status, Alcohol intake frequency, Smoking status, BMI, Number of days per week of moderate physical activity, Occupation, Job involves shift work, Job involved shift work Maximum workload N/A II Generalized Linear Model (Ordinal Logistic Regression) (Table 8)
Workplace very noisy, MW Age, Sex, Educational
qualification, Ethnic group, Socio-economic status, Alcohol intake frequency, Smoking status, BMI, Number of days per week of moderate physical activity, Occupation (job code), Job involves shift work, Job involved shift work, Working hours per week
Workplace very hot, MW Same as above
Workplace very cold, MW Same as above
Workplace very dusty, MW Same as above
Workplace full of chemicals or other fumes,
MW Same as above
Workplace had a lot of cigarette smoking from people smoking,
Work/Job satisfaction, MW Same as above
Happiness, MW Same as above
Family relationship satisfaction, MW Same as above
Health satisfaction MW Same as above
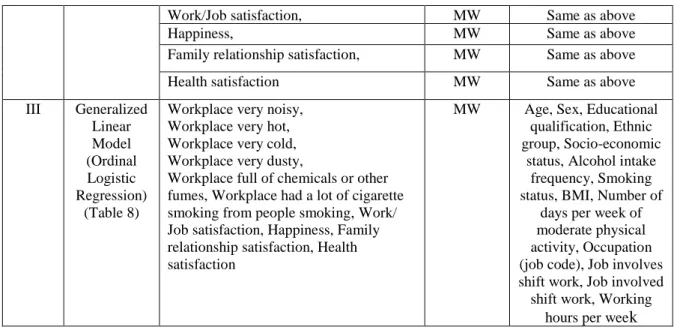
III Generalized Linear Model (Ordinal Logistic Regression) (Table 8)
Workplace very noisy, Workplace very hot, Workplace very cold, Workplace very dusty,
Workplace full of chemicals or other fumes, Workplace had a lot of cigarette smoking from people smoking, Work/ Job satisfaction, Happiness, Family relationship satisfaction, Health satisfaction
MW Age, Sex, Educational qualification, Ethnic group, Socio-economic
status, Alcohol intake frequency, Smoking status, BMI, Number of
days per week of moderate physical activity, Occupation (job code), Job involves shift work, Job involved shift work, Working
hours per week
MW = Maximum workload
2.6 Missing data
For documenting missing data, a specific code number ‘999’ were used in the dataset initially. All the cases in any variable that specified as ‘999’ were recoded as missing data. The number of missing data in most of the predictor variables was very high and the numbers of missing data in each variable has been reported below in a table (Table 4). Specially, all the variables regarding physical aspects of workplace environment had huge numbers of missing data. Highest number of missing data was noticed for a co-variate – current employment status. The other two co-co-variates named job involves shift work and job involved shift work also had large number of missing values. Considering the high number of missing data of all used variables, the method of multiple imputation was chosen and used to correct all the missing data. For this purpose, SPSS software version 22 was used and the multiple imputation was run from the analyze option of the software. The number for imputation was set at five. After completion of the imputation process the number of data multiplies five times and a new dataset has been automatically created. Later, the newly created dataset was used for all kind of analysis.
Table 4: Amount of missing data in different variables
Name of the variable Number of Missing data Predictor variables
1. Workplace very noisy 56,895
2. Workplace very cold 57,128
3. Workplace very hot 57,086
4. Workplace very dusty 57,239
5. Work place full of chemicals or other fumes 57,348
6. Workplace had a lot of cigarette smoking from other people smoking
7. Work/Job satisfaction 23,457
8. Happiness 736
9. Family relationship satisfaction 1162
10. Health satisfaction 732
Covariates
1. Ethnic background 578
2. Townsend deprivation index (TDI) 95
3. BMI 278
4. Alcohol intake frequency 298
5. Smoking status 540
6. Number of days per week of moderate physical activity 210
7. Job involved shift work 56,738
8. Job involves shift work 34,600
9. Current employment status 77,008
12. Job code
13. Work hours per week
9,137 72,398 BMI = Body mass index
The main condition for using multiple imputation is that data should be missing at random (MAR). In UK Biobank Cohort study, participants had many options for each question to choose the desired and appropriate answer from the available options. According to that, every variable should have any of the either answer including options - do not know and prefer not to answer. But, in the used dataset large number of values were missing as stated in table 5 and they were random for which no specific cause was found. It was also not possible to extract or split the desired data that had only valid cases as they vary from each other in different variables. Considering all these, to minimize the biases, multiple imputation technique was used to correct the missing data.
2.7 Ethical consideration
Ethical permission was taken from the ‘North West - Haydock Research Ethics Committee’ for using UK Biobank data and this committee is a part of health research authority, NHS, UK. This study is a part of an ongoing project under Neuroscience department of Uppsala University and also having the ethical permission from the local research authority (Dnr 2017/98).
3 Results
This study investigated the association between different aspects of workplace environments and general well-being with maximum workload among middle and old aged working people. From the baseline assessment study of UK biobank, a total of 77,781 people of 39 to 72 years aged participants were drawn
for all types of statistical analyses where different lifestyle and health related information about them were also used as different variables.
3.1 Study population characteristics
All the percentages with frequencies and mean values with standard deviation for all the variables mentioned in this part has been derived from the original data. In total, the study included 77,960 participants consisting of more number of female (54.5%) compared to male (45.5%) and their mean age was 56.8 years old with a standard deviation of +8.11. Including age of the study group, other continuous variables of the study were used unchanged from the initial data and those were – BMI and Townsend deprivation index (TDI). Afterwards, to give a more detailed descriptive characteristic of the participants demography and health and lifestyle, the mean value of above mentioned variables with the standard deviation has been presented (Table 5). The mean BMI of the participants was 27.39 kg/m2 which indicate the condition ‘overweight’ according to the BMI classification (84) and +4.79 was the observed standard error (SD). The average of Townsend deprivation index of the study population was -1.05 with the standard deviation of +2.99. Such a negative score of TDI represents affluence of the study population. Majority of them belongs to the major ethnic group (White) that consisted of 90.9% of the study population and 9.1% of participants belongs to the minor ethnic group (others – Black, Asian, Mixed, Others). About 65.3% of this population do not have college or university level education and 34.7% of the population completed their college education or have gained qualification more than this level (professional qualifications). Around 0.1% of the study people have history of chronic rheumatic heart disease. Similarly, 0.1% participant have genetic disease. Almost 34.5% of the study population found as previous smoker and 9.5% were current smokers and around 20.3% of them are daily alcohol drinkers. The pooled mean values and frequencies with percentages of participants characteristic variables from imputed dataset are also presented below in the same table at a different column (Table 5). After multiple imputation, all variables found to be have similar or almost near to similar percentages and mean values from the original data.
Table 5: Baseline characteristics of the participants
Characteristics
Original data Pooled data Mean ± Standard deviation (SD) Frequencies (Percentages) n (%) Mean Frequencies (Percentage) n (%) Demographics 1.Age (years) 56.8 ± 8.11 - 56.8 - 2.Sex
5 Female 6 Male - 42,494 (54.5%) 35,466 (45.5%) - 42,494 (54.5%) 35,466 (45.5%) 3.Ethnic group
a. Major ethnic group (White) b. Minor ethnic group (Others)
- 70,303 (90.9%)
7,079 (9.1%)
- 70,816.6 (90.8%)
7,143.4 (9.2%)
4.Townsend deprivation index -1.05 ± 2.99 - -1.05 -
5.Qualifications (at least have college/ university level education or more)
a. No b. Yes - 50,887 (65.3%) 27,073 (34.7%) - 50,887 (65.3%) 27,073 (34.7%)
Health and lifestyle
1.Smoking status a. Never b. Previous c. Current - 43,064 (55.6%) 26,932 (34.8%) 7,424 (9.6%) - 43,283.6 (55.6%) 27,202.2 (34.8%) 7,474.2 (9.6%) 2.Alcohol intake frequency
a. Never
b. Daily/almost daily c. 3/4 times a week d. 1/2 times a week e. 1-3 times/month f. Special occasions only
- 6,584 (8.5%) 15,858 (20.4%) 17,411 (22.3%) 19,296 (24.8%) 8,774 (11.3%) 9,739 (12.5%) - 6,605.8 (8.5%) 15,880.4 (12.6%) 17,463.6 (11.4%) 19,367.8 (24.9%) 8851.4 (22.3%) 9,791 (20.3%) 3.BMI 27.39 ± 4.79 - 27.4 -
4. Number of days per week of moderate physical activity a. 0 day b. 1 day c. 2 days d. 3 days e. 4 days f. 5 days g. 6 days h. 7 days - 8,791 (11.5%) 5,837 (7.9%) 10,796 (14.6%) 11,173 (15.3%) 7,554 (10.7%) 11,441 (15.5%) 4,151 (6%) 14,085 (18.5%) - 9,004.2 (11.5%) 6,223.2 (7.9%) 11,385 (14.6%) 11,918.8 (15.3%) 8,318.4 (10.7%) 12,099 (15.5%) 4,638.6 (6%) 14,372.8 (18.5%)
5.Chronic rheumatic heart disease a. No b. Yes - 77,884 (99.9%) 76 (0.1%) - 77,884 (99.9%) 76 (0.1%) 6.Genetic disease a. No b. Yes - 77,857 (99.9%) 103 (0.1%) - 77,857 (99.9%) 103 (0.1%)
BMI – Body mass index
Similarly, mean value with standard deviation for the continuous variable working hours per week and frequencies with percentages for rest of the occupational characteristics has been shown below in a table for both values from original dataset and pooled values from imputed dataset (Table 6). At first, values from original dataset has been described in this part. Around 9.5% people were involved in jobs that included shift works. (Table 6). The mean of their working hours were 40.67 hours per week with an observed SD of +9.29. The pooled mean and frequencies from imputed dataset are also presented below in the same table (Table 6) which is, overall, almost similar to the original frequencies and mean.. But,
few variables found to be have slightly different percentages from the original data. For instance, in the variable job code, different occupation percentages are slightly different from the original values. After the application of imputation method, the variable named job involves shift work included three categories where 77.2% population never did shift work. On the other hand, 15.9% study participants did shift works usually or always and 6.8% found to did shift work sometimes in their workplace. Also, on the other variable named job involved shift work around 84.6% of study population reported about never doing shift works while about 15.3% people from the study group reported to had shift works. (Table 6)
Table 6: Occupational characteristics of the participants
Occupational characteristics
Original data Pooled data
Mean ± Standard deviation (SD) Frequencies (percentages) n (%) Mean Frequencies (percentages) n (%) 1.Job code
a. Managers & senior officials b. Professional occupations c. Associate professional &
technical professions d. Administrative and
secretarial occupations e. Skilled trade occupations f. Personal service
occupations
g. Sales and customer service occupations
h. Process, plant and machine operatives i. Elementary occupations - 12,207 (17.7%) 16,084 (23.4%) 11,444 (16.6%) 11,432 (16.6%) 4,896 (7.1%) 4,078 (5.9%) 2331 (3.4%) 3,004 (4.4%) 3,347 (4.9%) - 13,017.6 (16.7%) 17,318.2 (22.2%) 13,051.2 (16.7%) 13,168.6 (16.9%) 6,413.2 (8.2%) 5,172.4 (6.6%) 2,996 (3.8%) 3,331.2 (4.2%) 3,491.6 (4.4%) a.
3.Working hours (per week)
40.67 ± 9.29 - 40.4 -
4.Job involves shift work a. Never b. Sometimes c. Usually/Always - 35,929 (82.9%) 3,256 (7.5%) 4,175 (9.6%) - 60,205.4 (77.2%) 5,344 (6.8%) 12,410.6 (15.9%) 5.Job involved shift work
a. No b. Yes - 18,284 (86.2%) 2,938 (13.8%) - 65,990 (84.6%) 11,970 (15.3%)
Frequencies with valid percentages of different predictor variables have been presented in the following table (Table 7). Both original and imputed percentages for all predictors have been mentioned in the same table. 45.2% people reported them as exposed to noise in their workplace while 54.8% were reported as non-exposed to noise. On the other hand, 70.9% participants were not exposed to cold in their
workplace and 29.1% people were exposed to cold temperature in workplace. Among the participants, 57% were found to have no exposure of hot temperature in their work places, but 43% were counted to have hot exposures in the work environment. The percentage of population of workplace dust exposure were 25% and 75% were not exposed to dust. 15.7% were exposed to chemicals and other fumes and 84.3% were not exposed to similar things in the workplace. The percentage of passive smoking exposure was 47.1% while 52.9% had no exposure to passive smoking. 89.9% participants were satisfied with their jobs and 10.1% were not satisfied with their jobs. Around 95.1% participants reported themselves as happy, while 4.9% people reported who were not happy. 93.2% people were satisfied with their family relationship and on the other hand, 6.8% participants mentioned no satisfaction to family relationship. Also, 86.3% people were satisfied with their health and 13.7% found to have no health satisfaction (Table 7).
Table 7: Frequencies for different aspects of workplace environment and general well-being
Predictor variables
Original data Pooled data Frequencies (Percentages) n (%) Frequencies (Percentage) n (%) Physical workplace environment
1.Workplace very noisy No Yes 11,546 (54.8%) 9,519 (45.2%) 40,424 (51.9%) 37,536 (48.1%) 2.Workplace very cold
No Yes 14,764 (70.9%) 6,068 (29.1%) 51,910 (66.6%) 26,050 (33.4%) 3.Workplace very hot
No Yes 11,896 (57%) 8,978 (43%) 42,013.8 (53.9%) 35,946.2 (46.1%) 4.Workplace very dusty
No Yes 15,533 (75%) 5,188 (25%) 55,755.2 (71.5%) 22,204.8 (28.5%) 5.Workplace full of chemicals or other fumes
No Yes 17,369 (84.3%) 3,243 (15.7%) 64,080.4 (82.2%) 13,879.6 (17.8%) 6.Workplace had a lot of cigarette smoking from
people smoking No Yes 11,007 (52.9%) 9,803 (47.1%) 39,527.4 (50.7%) 38,432.6 (49.3%)
Psychosocial workplace environment and General well-being 1.Work/Job satisfaction No Yes 5,489 (10.1%) 49,014 (89.9%) 7,358 (9.4%) 70,602 (90.6%) 2. Happiness No Yes 3,805 (4.9%) 73,419 (95.1%) 3,876.4 (4.98%%) 74,083.6 (95.02%) 3. Family relationship satisfaction
Yes 71,586 (93.2%) 72,610.4 (93.1%) 4. Health satisfaction No Yes 10,551 (13.7%) 66,677 (86.3%) 10,717.8 (13.7%) 67242.2 (86.3%) 3.2 Crude analysis
At first, in model I, ordinal logistic regression has been done among all the predictor variables individually with the outcome variable (maximum workload). The variables related to the physical aspects of workplace environment and results have been shown below from pooled analysis. Overall significance was found for four variables except for the two variables that are - Workplace very noisy and Workplace had a lot of cigarette smoking from other people smoking. The estimate (B) for the first variable was 0.013 with a 95% confidence interval (95% CI) of -0.100, 0.127. On the other hand, the other variable had an estimate of -0.005 where 95% CI was -0.094, -0.085. The effect sizes varied, and only the variable ‘workplace very noisy’ showed a positive effect (Estimates = 0.013) while rest of the variables regarding physical aspects of work environment showed negative effect. However, physical environmental aspects – very hot, very dusty and full of chemicals or fumes, very noisy, very cold, smoking from other people were found to have very small effect sizes. The variable named ‘Workplace had a lot of cigarette smoking from people smoking’ had an estimate of 0.005, which is extremely low. For the variables related to psychosocial aspect of work environment and general well-being, three variables – Work/job satisfaction, Happiness and Health satisfaction showed statistically significant result. But, except work/job satisfaction variable (B = 0.346), all other variables of psychosocial aspect of workplace environment and general well-being were found to have negative estimate values. In the univariate analysis, Work/job satisfaction had estimate value 0.346 and 95% CI is 0.287, 0.405. For happiness, estimate value of -0.079 yielded with 95% CI -0.140, -0.018. Similarly, health satisfaction also showed a negative estimate value of -0.786 where 95% CI is -0.825, -0.748. Effect sizes were different for each of them and ranges from very small to small size (Table 8).
In model I, analysis of all co-variates and maximum workload were also recorded which has been presented below on a different table (Table 8). On the crude analysis of all co-variates with maximum workload, co-variate named – job involves shift work did not show any statistically significant result and all other co-variates were found to have statistically significant results. On the other hand, people who never do shift works showed 0.137 estimate value and the noted 95% CI is -1.111, 1.386. The B-value for participants who sometimes do shift works is 0.262 where the 95% CI is -0.878, 1.403. That means current employment status or job that involves shift work is not related to low maximum workload. However, people who never drink alcohol showed very little effect of having low maximum workload compared to people who drink at different ranges. Negative estimate levels have been recorded for three different occupational groups, namely - administrative and secretarial occupations, personal service
occupations and sales and customer service occupations. Participants involved in these professions having negative estimate value means they have more chance to have lower maximum workload. Other co-variates that were also found to have negative estimate values and same possible outcome of cardiovascular diseases are – Sex, age, TDI, ethnic group, educational qualification, BMI, smoking status and job involved shift work. (Table 8)
Table 8: Crude analysis of all predictor variables and all co-variates with maximum workload (Model I)
Predictor variables
95% CI
Estimate (B) Lower Upper Significance
Physical aspects of workplace environment
Workplace very noisy (Yes → Ref.) 0.013 -0.100 0.127 0.774
Workplace very cold (Yes → Ref.) -0.080 -0.147 -0.013 0.025
Workplace very hot (Yes → Ref.) -0.122 -0.175 -0.069 0.001
Workplace very dusty (Yes → Ref.) -0.137 -0.197 -0.076 0.001
Workplace full of chemicals or other fumes (Yes → Ref.)
-0.285 -0.379 -0.191 <0.001 Workplace had a lot of cigarette smoke from other
people smoking (Yes → Ref.)
-0.005 -0.094 -0.085 0.901
Psychosocial aspect of workplace environment and General well-being
Work/Job satisfaction (Yes → Ref.) 0.346 0.287 0.405 <0.001
Happiness (Yes → Ref.) -0.079 -0.140 -0.018 0.012
Family relationship satisfaction (Yes → Ref.) -0.005 -0.056 0.046 0.838
Health satisfaction (Yes → Ref.) -0.786 -0.825 -0.748 <0.001
Covariates 1. Demographics
Sex (Male → Ref.) -2.364 -2.395 -2.333 <0.001
Age -0.087 -0.089 -0.085 <0.001
Townsend deprivation index (TDI) -0.026 -0.030 -0.021 <0.001
Ethnic group (Major ethnic group → Ref.) -0.219 -0.262 -0.175 <0.001 Educational qualification (Have ≥ college or university
level education → Ref.)
-0.491 -0.517 -0.465 <0.001
2. Health & Lifestyle
BMI -0.018 -0.021 -0.015 <0.001
Alcohol intake frequency (Special occasions only → Ref.) Never Daily/Almost daily 3-4 times/week Once/twice a week 1-3 times/month -0.091 0.716 0.770 0.616 0.407 -0.146 0.672 0.727 0.573 0.356 -0.036 0.760 0.813 0.658 0.457 0.001 <0.001 <0.001 <0.001 <0.001 Smoking status (Current smoker → Ref.)
Never Previous -0.139 -0.116 -0.183 -0.163 -0.094 -0.070 <0.001 <0.001