Global, regional, and national comparative risk assessment
of 84 behavioural, environmental and occupational, and
metabolic risks or clusters of risks, 1990–2016: a systematic
analysis for the Global Burden of Disease Study 2016
GBD 2016 Risk Factors Collaborators*
Summary
Background
The Global Burden of Diseases, Injuries, and Risk Factors Study 2016 (GBD 2016) provides a
comprehensive assessment of risk factor exposure and attributable burden of disease. By providing estimates over a
long time series, this study can monitor risk exposure trends critical to health surveillance and inform policy debates
on the importance of addressing risks in context.
Methods
We used the comparative risk assessment framework developed for previous iterations of GBD to estimate
levels and trends in exposure, attributable deaths, and attributable disability-adjusted life-years (DALYs), by age group,
sex, year, and location for 84 behavioural, environmental and occupational, and metabolic risks or clusters of risks
from 1990 to 2016. This study included 481 risk-outcome pairs that met the GBD study criteria for convincing or
probable evidence of causation. We extracted relative risk (RR) and exposure estimates from 22 717 randomised
controlled trials, cohorts, pooled cohorts, household surveys, census data, satellite data, and other sources, according
to the GBD 2016 source counting methods. Using the counterfactual scenario of theoretical minimum risk exposure
level (TMREL), we estimated the portion of deaths and DALYs that could be attributed to a given risk. Finally, we
explored four drivers of trends in attributable burden: population growth, population ageing, trends in risk exposure,
and all other factors combined.
Findings
Since 1990, exposure increased significantly for 30 risks, did not change significantly for four risks, and
decreased significantly for 31 risks. Among risks that are leading causes of burden of disease, child growth failure and
household air pollution showed the most significant declines, while metabolic risks, such as body-mass index and high
fasting plasma glucose, showed significant increases. In 2016, at Level 3 of the hierarchy, the three leading risk factors
in terms of attributable DALYs at the global level for men were smoking (124·1 million DALYs [95% UI 111·2 million to
137·0 million]), high systolic blood pressure (122·2 million DALYs [110·3 million to 133·3 million], and low birthweight
and short gestation (83·0 million DALYs [78·3 million to 87·7 million]), and for women, were high systolic blood
pressure (89·9 million DALYs [80·9 million to 98·2 million]), high body-mass index (64·8 million DALYs [44·4 million
to 87·6 million]), and high fasting plasma glucose (63·8 million DALYs [53·2 million to 76·3 million]). In 2016 in
113 countries, the leading risk factor in terms of attributable DALYs was a metabolic risk factor. Smoking remained
among the leading five risk factors for DALYs for 109 countries, while low birthweight and short gestation was the
leading risk factor for DALYs in 38 countries, particularly in sub-Saharan Africa and South Asia. In terms of important
drivers of change in trends of burden attributable to risk factors, between 2006 and 2016 exposure to risks explains an
9·3% (6·9–11·6) decline in deaths and a 10·8% (8·3–13·1) decrease in DALYs at the global level, while population
ageing accounts for 14·9% (12·7–17·5) of deaths and 6·2% (3·9–8·7) of DALYs, and population growth for 12·4%
(10·1–14·9) of deaths and 12·4% (10·1–14·9) of DALYs. The largest contribution of trends in risk exposure to disease
burden is seen between ages 1 year and 4 years, where a decline of 27·3% (24·9–29·7) of the change in DALYs between
2006 and 2016 can be attributed to declines in exposure to risks.
Interpretation
Increasingly detailed understanding of the trends in risk exposure and the RRs for each risk-outcome
pair provide insights into both the magnitude of health loss attributable to risks and how modification of risk exposure
has contributed to health trends. Metabolic risks warrant particular policy attention, due to their large contribution to
global disease burden, increasing trends, and variable patterns across countries at the same level of development.
GBD 2016 findings show that, while it has huge potential to improve health, risk modification has played a relatively
small part in the past decade.
Funding
The Bill & Melinda Gates Foundation, Bloomberg Philanthropies.
Copyright
© The Author(s). Published by Elsevier Ltd. This is an Open Access article under the
CC BY 4.0 license.
Lancet 2017; 390: 1345–422
*Collaborators listed at the end of the Article
For more on Bloomberg Philanthropies see www.bloomberg.org This online publication has been corrected. The corrected version first appeared at thelancet.com on September 18, 2017 Correspondence to: Prof Emmanuela Gakidou, Institute for Health Metrics and Evaluation, Seattle, WA 98121, USA
Introduction
A core premise of public health is that prevention can
be a powerful instrument for improving human health,
one that is often cost-effective and minimises harm
to individuals from ill health. The core objectives
of prevention include the reduction or modification of
exposure to risks including metabolic, behavioural,
environmental, and occupational factors. Quantifying
risks to health and thus the targets of many public health
actions is an essential prerequisite for effective public
health. The evidence on the relation between risk
exposure and health is constantly evolving: new
information about the relative risks (RRs) associated with
different risks for different outcomes continues to
emerge from cohort studies, randomised trials, and
case-control studies. These studies can establish evidence for
new risks or risk-outcome pairs or reduce the strength of
evidence for existing risks. New data are also regularly
collected on the levels of exposure in different populations
and in different settings. Regularly updated monitoring
of the evidence base on risk factors is crucial for public
health and for individual risk modification through
primary care and self-management.
Several studies explore risk-attributable burden for
individual risks
1–3at the global, regional, or national level.
Other studies provide assessments of exposure for selected
risks. However, the Global Burden of Diseases, Injuries,
and Risk Factors Study (GBD) comparative risk assessment
(CRA) is the only comprehensive and comparable
approach to risk factor quantification. The most recent of
these assessments was GBD 2015.
4–6With each cycle of
GBD, scientific discussions have emerged on various
dimensions of risk quantification that have led to
improvements and modifications of GBD. Many of these
are focused on the strength of evidence supporting a causal
connection for specific risk-outcome pairs, while others
relate to measurement challenges.
7–9Further, new risk
factors have been added for important health conditions
included in GBD, such as neonatal outcomes and
Alzheimer’s dementia,
10which have previously not had
associated risk factors. The recent trials on blood pressure
control at lower levels of systolic blood pressure, including
Research in context
Evidence before this study
The Global Burden of Diseases, Injuries, and Risk Factors Study
2016 (GBD 2016) remains the most comprehensive effort to
conduct a population-level comparative risk assessment across
countries and risks. Other sources of population-level estimates
of risk include WHO and UNICEF reports as well as independent
scientific publications. Notable differences in methods and
definitions produce variation in results, although in several
cases there is general agreement in regional or global patterns.
The GBD study remains the only peer-reviewed, comprehensive,
and annual assessment of risk factor burden by age, sex, cause,
and location for a long time series that complies with the
Guidelines for Accurate and Transparent Health Estimates
Reporting (GATHER).
Added value of this study
This study builds upon GBD 2015 and provides several important
improvements as well as the quantification of five new risks.
The innovations and improvements from last year can be
summarised as follows. Across all risk factors, there were
7155 additional data sources, according to the GBD 2016 source
counting methods. For diet, we included data for dietary recall,
household budget, and food frequency questionnaires. We also
incorporated sales data from 170 countries as well as national
accounting of food available to populations in a given year. In
GBD 2016, we are producing estimates for the following
five new risks: smokeless tobacco, low birthweight and short
gestation, low birthweight for gestation, short gestation for
birthweight, and diet low in legumes. We also extended the high
body-mass index (BMI) analysis to include childhood obesity. We
have also added 93 new risk-outcome pairs. Major revisions to
the estimation of the following risk factors were undertaken for
GBD 2016. For second-hand smoke, we changed the estimation
method to ensure consistency with the estimates for smoking
prevalence. For alcohol, we estimated new relative risks (RRs) for
all outcomes, we incorporated more data for exposure and new
adjustments for tourism and unrecorded consumption, and we
redefined the theoretical minimum risk exposure level (TMREL).
For diet, we estimated the disease burden of dietary risks based
on the absolute level of intake rather than the intake
standardised to 2000 kcal per day. We developed an ensemble
model of different parametric distributions to generate better
fits to the distributions of continuous risk factors. Mediation
evidence was reviewed and updated based on an analysis of
ten pooled cohorts. We have expanded the analysis of
geographic and temporal trends in risk exposure and burden by
development, using the Socio-demographic Index (SDI), and
have also explored where countries are in the risk transition. We
also improved and modified our decomposition methods so that
the results shown are additive and can be aggregated to explain
trends in all-cause and cause-specific mortality, as well as trends
across age groups. The decomposition analysis has been
extended to examine how risk factors have contributed to trends
in all-cause mortality by age and sex as well as by cause.
Implications of all the available evidence
Increasingly detailed understanding of the trends in risk
exposure and the RRs for each risk-outcome pair provides
insights into both the magnitude of health loss attributable to
risks and how modification of risk exposure has contributed to
health trends. This analysis shows a mismatch between the
potential for risk modification to improve health and the
relatively modest role that risk modification has played in the
past generation in improving global health.
the Systolic Blood Pressure Intervention Trial (SPRINT)
11and Heart Outcomes Prevention Evaluation-3 (HOPE-3)
trial,
12have also brought attention to the difference between
a population health perspective on the quantification of
risks and the clinical question of risk reversibility. The
CRA framework provides an important insight into the
role of different risks in contributing to levels of population
health but does not necessarily provide all the information
necessary to guide individual clinical decision making.
The GBD 2016 CRA includes 84 risk factors and an
associated 481 risk-outcome pairs. In addition to new
data and updated methods, we have included five new
risks in the GBD 2016 CRA. The study was undertaken
for 195 countries and territories and provides estimates
of exposure and attributable deaths and
disability-adjusted life-years (DALYs) for 1990 through to 2016. We
explored how risks change with development, measured
by the Socio-demographic Index (SDI), and also
decomposed changes in deaths and DALYs into the
contributions of population ageing, population growth,
trends in risk exposure, and all other factors combined.
As with previous iterations of GBD, the GBD 2016 CRA
results presented here supersede all previously published
GBD CRA estimates.
Methods
Overview
The CRA conceptual framework was developed by Murray
and Lopez,
13who established a causal web of hierarchically
organised risks or causes that contribute to health
outcomes (method appendix; appendix 1
p 432), which
allows quantification of risks or causes at any level in the
framework. In GBD 2016, as in previous iterations of
GBD, we evaluated a set of behavioural, environmental,
and occupational, and metabolic risks, where
risk-outcome pairs were included based on evidence rules
(appendix 1 p 344). These risks were organised into five
hierarchical levels as described in appendix 1 (p 374). At
Level 0, the GBD 2016 provides estimates for all risk
factors combined, at Level 1 the GBD 2016
provides estimates for three groups: environmental and
occupational, metabolic, and behavioral risk factors. At
Level 2, there are 17 risks, at Level 3 there are 50 risks, and
at Level 4 there are 67 risks, for a total of 84 risks or
clusters of risks. To date, we have not quantified the
contribution of other classes of risk factors
(appendix 1 p 376); however, using an analysis of the
relation between risk exposures and socio-demographic
development, measured with the use of SDI, we provide
some insights into the potential magnitude of distal
social, cultural, and economic factors.
Two types of risk assessment are possible within the
CRA framework: attributable burden and avoidable
burden.
13Attributable burden is the reduction in current
disease burden that would have been possible if past
population exposure had shifted to an alternative or
counterfactual distribution of risk exposure. Avoidable
burden is the potential reduction in future disease burden
that could be achieved by changing the current distribution
of exposure to a counterfactual distribution of exposure.
Murray and Lopez
13identified four types of counterfactual
exposure distributions: theoretical, plausible, feasible, and
cost-effective minimum risk. In GBD studies, to date and
in this study, we focus on attributable burden using the
theoretical minimum risk exposure level, which is the
distribution of risk comprising the levels of exposure that
minimise risk for each individual in the population.
Overall, this analysis follows the CRA methods used in
GBD 2015.
4The methods described in this study provide
a high-level overview of the analytical logic, focusing on
areas of notable change from the methods used in GBD
2015, with details provided in appendix 1 (p 10). This
study complies with the Guidelines for Accurate and
Transparent Health Estimates Reporting (GATHER)
statement
14(appendix 1 p 377).
Geographical units of analysis and years for estimation
In GBD 2016, locations are arranged as a set of hierarchical
categories: seven super-regions, 21 regions nested within
the seven super-regions, and 195 countries and territories
nested in the 21 regions. Additionally, we present estimates
at the subnational level for five countries with a population
greater than 200 million in 2016: Brazil, China, India,
Indonesia, and the USA. We produced a complete set of
age-specific, sex-specific, cause-specific, and
location-specific estimates of risk factor exposure and attributable
burden for 1990–2016 for all included risk factors.
Attributable burden estimation
Four key components are included in estimation of the
burden attributable to a given risk factor: the metric of
burden being assessed (number of deaths, years of life lost
[YLLs], years lived with disability [YLDs], or DALYs [the
sum of YLLs and YLDs]), the exposure levels for a risk
factor, the relative risk of a given outcome due to exposure,
and the counterfactual level of risk factor exposure.
Estimates of attributable DALYs for a risk-outcome pair are
equal to DALYs for the outcome multiplied by the
population attributable fraction (PAF) for the risk-outcome
pair for a given age, sex, location, and year. A similar logic
applies for estimation of attributable deaths, YLLs, or
YLDs. Risks are categorised on the basis of how exposure
was measured: dichotomous, polytomous, or continuous.
The PAF represents the proportion of outcome that would
be reduced in a given year if the exposure to a risk factor in
the past were reduced to the counterfactual level of the
theoretical minimum risk exposure level (supplementary
results, appendix 2 p 1).
Causal evidence for risk-outcome pairs
In this study, as in GBD 2015, we have included
risk-outcome pairs that we have assessed as meeting the
World Cancer Research Fund grades of convincing or
probable evidence (see appendix 1 p 10 for definitions of
See Online for appendix 1
these grades).
15Table 1 provides a summary of the
evidence supporting a causal relation between a risk and
an outcome for each pair included in GBD 2016. For
each risk-outcome pair, we used recent systematic
reviews to identify independent prospective studies
(randomised controlled trials, non-randomised
interventions, and cohorts) that evaluated the putative
relationship. For risk-outcome pairs with fewer than five
prospective studies, we evaluated evidence from
case-control studies as well (appendix 1 p 344). Table 1
summarises the evidence using multiple dimensions,
which supports our assessment that each included
risk-outcome pair meets the criteria of convincing or
probable evidence (appendix 1 p 10 contains a
justification of the criteria presented to support
causality). In this summary of evidence, we have focused
on randomised controlled trials and prospective
observational studies, along with supporting evidence,
like dose–response relationships and biologically
plausible mechanisms.
Estimation process
Information about the data sources, estimation methods,
computational tools, and statistical analysis used in the
derivation of our estimates are provided in appendix 1
(p 10). The analytical steps for estimation of burden
attributable to single or clusters of risk-outcome pairs are
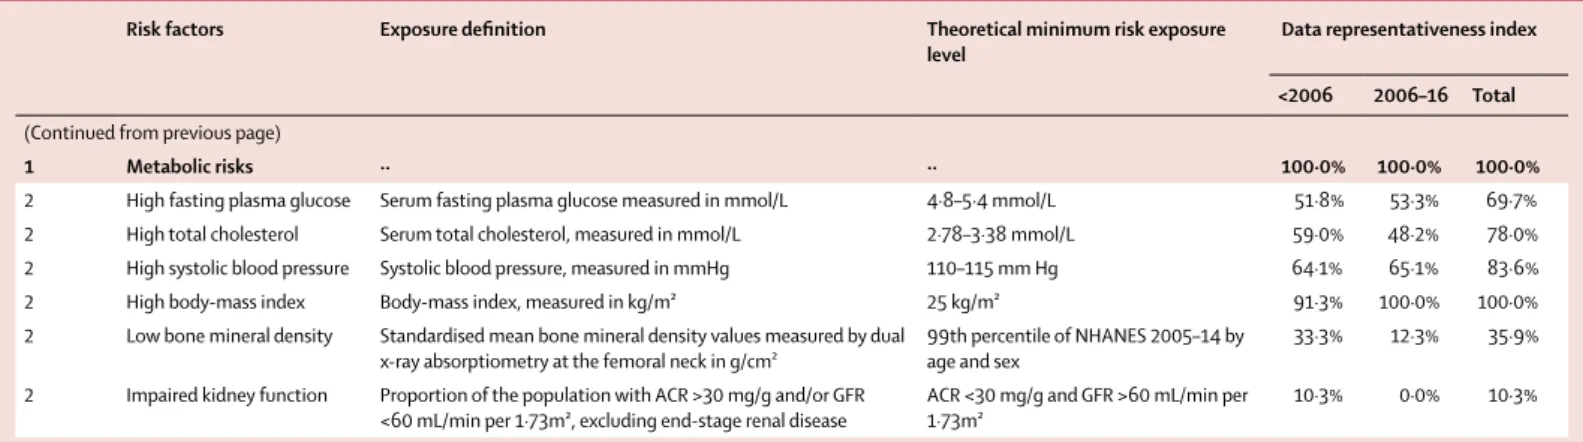
summarised in appendix 1 (p 10). Table 2 provides
definitions of exposure for each risk factor, the theoretical
minimum risk exposure level (TMREL) used, and metrics
of data availability. For each risk, we estimated effect size
as a function of age and sex and exposure level, mean
exposure, the distribution of exposure across individuals,
and the TMREL. The approach taken is largely similar to
GBD 2015 for each quantity for each risk. Some
methodological improv ements have been implemented
and new data sources incorporated. Appendix 1 (p 34)
provides details of each step by risk. Citation information
for the data sources used for relative risks are provided in
searchable form through an online source tool.
All point estimates are reported with 95% uncertainty
intervals (UIs). UIs include uncertainty from each
relevant component, consisting of exposure, relative
risks, TMREL, and burden rates. Where percentage
change is reported (with 95% UIs), we computed it on
the basis of the point estimates being compared.
In GBD 2015, we produced a summary measure of
exposure for each risk, called the summary exposure
value (SEV), which is a metric that captures risk-weighted
exposure for a population, or risk-weighted prevalence of
an exposure. The scale for SEV spans from 0% to 100%,
such that an SEV of 0% reflects no risk exposure in a
population and 100% indicates that an entire population
is exposure to the maximum possible level for that risk.
In GBD 2016, we show estimates of SEVs for each risk
factor and provide details on how SEVs are computed for
categorical and continuous risks in appendix 1 (p 10).
Fitting a distribution to exposure data
The most informative data describing the distribution of
risk factors within a population come from individual-level
data; additional sources of data include reported means
and variances. In cases when a risk factor also defines a
disease, such as haemoglobin level and anaemia, the
prevalence of disease is also frequently reported. To model
the distribution of any particular risk factor, we seek a
family of probability density functions (PDFs), a fitting
method, and a model selection criterion. To make use of
the most data describing most populations, we used the
method of moments (MoM); the first two empirical
moments from a population, the mean and variance, were
used to determine the PDF describing the distribution of
risk within any population, where exceptions to this rule
are justified by context. We used the Kolmogorov-Smirnov
test to measure the goodness of fit (GoF), but in some
cases, the GoF was based on the prediction error for the
prevalence of disease.
We used an ensemble technique in which a model
selection algorithm is used to choose the best model for
each risk factor.
16We drew the initial set of candidate
models from commonly used PDF families. We fitted each
PDF candidate family to each dataset using the MoM, and
used the Kolmogorov-Smirnov test
17as the measure of GoF.
Preliminary analysis showed that the GoF ranking of PDF
families varied across datasets for any particular risk factor
and that combining the predictions of differently fitted
PDF families could dramatically improve the GoF for each
dataset. Therefore, we developed a new model for prediction
using the ensemble of candidate models, which is a
weighted linear combination of all candidate models, {f},
where a set of weights {w} is chosen such that it is the sum
of the weights equals to one and the values of the weights
were determined by a second GoF criterion with its own
validation process. Because of basic differences among risk
factors, their distributions, and the risk attribution process,
the model selection process was often slightly different for
each risk factor. The details can be summarised by (1) the
summary statistics for each dataset; (2) a table showing the
Kolmogorov-Smirnov statistic for each candidate model
and URD; (3) the criterion used for determining the overall
GoF; (4) summary results of the validation process; and (5)
the weights defining the final ensemble model for each
dataset.
New risks and risks with significant changes in the
estimation methods compared with GBD 2015
We took several steps to improve the estimation of alcohol
use as a risk factor. First, on the exposure side, we added
26 survey series, which contributed 12 195 datapoints in
our models. Second, we developed and implemented a
method that adjusts total consumption for tourism and
unrecorded consumption for each location-year. Third,
we calculated the TMREL. We chose TMREL as being the
exposure that minimises an individual’s risk of suffering
burden from any given cause related to alcohol
For the tool see http://ghdx.healthdata.org/
Risk Outcome RCTs (n) RCTs with significant effect in the opposite direction (%) RCTs with null findings (%) Prospective observational studies (n)* Prospective observational studies with significant association in the opposite direction (%) Case-control studies assessing the risk- outcome pair relationship (n)† Case-control studies that show significant association in the opposite direction (%) Lower limit of RR >1·5 Dose– response relationship Biological plausibility ‡ Analogy§
2 Unsafe water, sanitation, and handwashing 3 Unsafe water
source– chlorination or solar (point of use treatment)
Diarrhoeal
diseases 24 0 42 6 0 ·· ·· Yes ·· Yes No
3 Unsafe water
source–piped Diarrhoeal diseases 1 0 0 9 11 ·· ·· Yes ·· Yes No
3 Unsafe water
source–filter Diarrhoeal diseases 11 0 45 2 0 ·· ·· Yes ·· Yes No
3 Unsafe water source– improved water
Diarrhoeal
diseases 0 ·· ·· 5 0 ·· ·· Yes ·· Yes No
3 Unsafe sanitation–
piped Diarrhoeal diseases 0 ·· ·· 7 0 ·· ·· Yes ·· Yes No
3 Unsafe sanitation–
improved sanitation Diarrhoeal diseases 0 ·· ·· 9 0 ·· ·· Yes ·· Yes No
3 No access to
handwashing facility Diarrhoeal diseases 19 0 42 0 ·· ·· ·· No ·· Yes No
3 No access to
handwashing facility Lower respiratory infections
8 0 50 11 0 ·· ·· No ·· Yes No
2 Air pollution 3 Ambient particulate
matter pollution Lower respiratory infections
0 ·· ·· 19 0 ·· ·· No Yes Yes No
3 Ambient particulate
matter pollution Tracheal, bronchus, and lung cancer
0 ·· ·· 27 0 ·· ·· No Yes Yes Yes
3 Ambient particulate
matter pollution Ischaemic heart disease 0 ·· ·· 16 0 ·· ·· No Yes Yes Yes
3 Ambient particulate
matter pollution Ischaemic stroke 0 ·· ·· 25 0 ·· ·· No Yes Yes Yes
3 Ambient particulate
matter pollution Haemorrhagic stroke 0 ·· ·· 25 0 ·· ·· No Yes Yes Yes
3 Ambient particulate
matter pollution Chronic obstructive pulmonary disease
0 ·· ·· 12 0 ·· ·· No Yes Yes Yes
3 Household air pollution from solid fuels Lower respiratory infections 0 ·· ·· 0 ·· 9 0 No Yes Yes No 3 Household air pollution from solid fuels
Tracheal, bronchus, and lung cancer
0 ·· ·· 0 ·· 20 0 No Yes Yes Yes
3 Household air pollution from solid fuels
Ischaemic heart
disease 0 ·· ·· 16 0 ·· ·· No Yes Yes Yes
3 Household air pollution from solid fuels
Ischaemic stroke 0 ·· ·· 25 0 ·· ·· No Yes Yes Yes
3 Household air pollution from solid fuels
Haemorrhagic
stroke 0 ·· ·· 25 0 ·· ·· No Yes Yes Yes
Risk Outcome RCTs (n) RCTs with significant effect in the opposite direction (%) RCTs with null findings (%) Prospective observational studies (n)* Prospective observational studies with significant association in the opposite direction (%) Case-control studies assessing the risk- outcome pair relationship (n)† Case-control studies that show significant association in the opposite direction (%) Lower limit of RR >1·5 Dose– response relationship Biological plausibility ‡ Analogy§
(Continued from previous page) 3 Household air
pollution from solid fuels
Chronic obstructive pulmonary disease
0 ·· ·· 0 ·· 2 0 No Yes Yes Yes
3 Household air pollution from solid fuels
Cataract 0 ·· ·· 0 ·· 11 0 No Yes Yes No
3 Ambient ozone
pollution Chronic obstructive pulmonary disease
0 ·· ·· 4 0 0 0 No Yes Yes No
2 Other environmental risks 3 Residential radon Tracheal,
bronchus, and lung cancer
0 ·· ·· 1 0 29 0 No Yes Yes No
3 Lead exposure Idiopathic developmental intellectual disability
0 ·· ·· 8 0 ·· ·· No Yes Yes No
3 Lead exposure Systolic blood
pressure 0 ·· ·· 3 0 1 0 No Yes Yes No
2 Occupational risks 4 Occupational
exposure to asbestos Larynx cancer 0 ·· ·· 27 0 ·· ·· No ·· Yes Yes
4 Occupational
exposure to asbestos Tracheal, bronchus, and lung cancer
0 ·· ·· 18 0 ·· ·· Yes ·· Yes Yes
4 Occupational
exposure to asbestos Ovarian cancer 0 ·· ·· 15 0 ·· ·· No ·· Yes Yes
4 Occupational
exposure to asbestos Mesothelioma 0 ·· ·· 5 0 ·· ·· Yes ·· Yes Yes
4 Occupational
exposure to arsenic Tracheal, bronchus, and lung cancer
0 ·· ·· 9 0 ·· ·· No ·· Yes No
4 Occupational
exposure to benzene Leukaemia 0 ·· ·· 12 0 ·· ·· Yes ·· Yes No
4 Occupational exposure to beryllium Tracheal, bronchus, and lung cancer 0 ·· ·· 3 0 2 0 No ·· Yes No 4 Occupational exposure to cadmium Tracheal, bronchus, and lung cancer 0 ·· ·· 7 0 ·· ·· No ·· Yes No 4 Occupational exposure to chromium Tracheal, bronchus, and lung cancer 0 ·· ·· 26 0 ·· ·· No ·· Yes No 4 Occupational exposure to diesel engine exhaust Tracheal, bronchus, and lung cancer 0 ·· ·· 17 0 ·· ·· No ·· Yes No 4 Occupational exposure to second-hand smoke Tracheal, bronchus, and lung cancer 0 ·· ·· 25 0 ·· ·· No ·· Yes No 4 Occupational exposure to formaldehyde Nasopharynx
cancer 0 ·· ·· 2 0 6 0 No ·· Yes Yes
Risk Outcome RCTs (n) RCTs with significant effect in the opposite direction (%) RCTs with null findings (%) Prospective observational studies (n)* Prospective observational studies with significant association in the opposite direction (%) Case-control studies assessing the risk- outcome pair relationship (n)† Case-control studies that show significant association in the opposite direction (%) Lower limit of RR >1·5 Dose– response relationship Biological plausibility ‡ Analogy§
(Continued from previous page) 4 Occupational
exposure to formaldehyde
Leukaemia 0 ·· ·· 13 0 ·· ·· No ·· Yes Yes
4 Occupational
exposure to nickel Tracheal, bronchus, and lung cancer 0 ·· ·· 6 0 ·· ·· No ·· Yes No 4 Occupational exposure to polycyclic aromatic hydrocarbons Tracheal, bronchus, and lung cancer 0 ·· ·· 39 0 ·· ·· No ·· Yes No 4 Occupational
exposure to silica Tracheal, bronchus, and lung cancer
0 ·· ·· 17 0 ·· ·· No ·· Yes No
4 Occupational exposure to sulfuric acid
Larynx cancer 0 ·· ·· 14 0 ·· ·· Yes ·· Yes No
4 Occupational exposure to trichloroethylene
Kidney cancer 0 ·· ·· 20 0 ·· ·· No ·· Yes No
3 Occupational
asthmagens Asthma 0 ·· ·· 16 0 ·· ·· No ·· Yes No
3 Occupational particulate matter, gases, and fumes
Chronic obstructive pulmonary disease
0 ·· ·· 9 0 ·· ·· No ·· Yes No
3 Occupational noise Age-related and other hearing loss
0 ·· ·· 5 0 ·· ·· Yes ·· Yes No
3 Occupational
ergonomic factors Low back pain 0 ·· ·· 10 0 ·· ·· No ·· Yes No
2 Child and maternal malnutrition 4 Non-exclusive
breastfeeding Diarrhoeal diseases 0 ·· ·· 5 0 ·· ·· Yes ·· Yes No
4 Non-exclusive
breastfeeding Lower respiratory infections
0 ·· ·· 6 0 ·· ·· Yes ·· Yes No
4 Discontinued
breastfeeding Diarrhoeal diseases 0 ·· ·· 2 0 ·· ·· No ·· Yes No
4 Child underweight Diarrhoeal
diseases 0 ·· ·· 7 0 ·· ·· Yes ·· Yes No
4 Child underweight Lower respiratory infections
0 ·· ·· 7 0 ·· ·· Yes ·· Yes No
4 Child underweight Measles 0 ·· ·· 7 0 ·· ·· Yes ·· Yes No
4 Child wasting Diarrhoeal
diseases 0 ·· ·· 7 0 ·· ·· Yes ·· Yes No
4 Child wasting Lower respiratory infections
0 ·· ·· 7 0 ·· ·· Yes ·· Yes No
4 Child wasting Measles 0 ·· ·· 7 0 ·· ·· Yes ·· Yes No
4 Child stunting Diarrhoeal
diseases 0 ·· ·· 7 0 ·· ·· No ·· Yes No
Risk Outcome RCTs (n) RCTs with significant effect in the opposite direction (%) RCTs with null findings (%) Prospective observational studies (n)* Prospective observational studies with significant association in the opposite direction (%) Case-control studies assessing the risk- outcome pair relationship (n)† Case-control studies that show significant association in the opposite direction (%) Lower limit of RR >1·5 Dose– response relationship Biological plausibility ‡ Analogy§
(Continued from previous page) 4 Child stunting Lower
respiratory infections
0 ·· ·· 7 0 ·· ·· No ·· Yes No
4 Child stunting Measles 0 ·· ·· 7 0 ·· ·· No ·· Yes No
4 Short gestation for
birthweight Diarrhoeal diseases 0 ·· ·· 20 0 ·· ·· Yes Yes Yes Yes
4 Short gestation for
birthweight Lower respiratory infections
0 ·· ·· 20 0 ·· ·· Yes Yes Yes Yes
4 Short gestation for
birthweight Upper respiratory infections
0 ·· ·· 20 0 ·· ·· Yes Yes Yes Yes
4 Short gestation for
birthweight Otitis media 0 ·· ·· 20 0 ·· ·· Yes Yes Yes Yes
4 Short gestation for
birthweight Pneumococcal meningitis 0 ·· ·· 20 0 ·· ·· Yes Yes Yes Yes
4 Short gestation for
birthweight Haemophilus influenzae type B
meningitis
0 ·· ·· 20 0 ·· ·· Yes Yes Yes Yes
4 Short gestation for
birthweight Meningococcal infection 0 ·· ·· 20 0 ·· ·· Yes Yes Yes Yes
4 Short gestation for
birthweight Other meningitis 0 ·· ·· 20 0 ·· ·· Yes Yes Yes Yes
4 Short gestation for
birthweight Encephalitis 0 ·· ·· 20 0 ·· ·· Yes Yes Yes Yes
4 Short gestation for
birthweight Neonatal preterm birth complications
0 ·· ·· 20 0 ·· ·· Yes Yes Yes Yes
4 Short gestation for
birthweight Neonatal encephalopathy due to birth asphyxia and trauma
0 ·· ·· 20 0 ·· ·· Yes Yes Yes Yes
4 Short gestation for
birthweight Neonatal sepsis and other neonatal infections
0 ·· ·· 20 0 ·· ·· Yes Yes Yes Yes
4 Short gestation for
birthweight Haemolytic disease and other neonatal jaundice
0 ·· ·· 20 0 ·· ·· Yes Yes Yes Yes
4 Short gestation for
birthweight Other neonatal disorders 0 ·· ·· 20 0 ·· ·· Yes Yes Yes Yes
4 Short gestation for
birthweight Sudden infant death syndrome 0 ·· ·· 20 0 ·· ·· Yes Yes Yes Yes
4 Low birthweight for
gestation Diarrhoeal diseases 0 ·· ·· 20 0 ·· ·· Yes Yes Yes Yes
4 Low birthweight for
gestation Lower respiratory infections
0 ·· ·· 20 0 ·· ·· Yes Yes Yes Yes
4 Low birthweight for
gestation Upper respiratory infections
0 ·· ·· 20 0 ·· ·· Yes Yes Yes Yes
Risk Outcome RCTs (n) RCTs with significant effect in the opposite direction (%) RCTs with null findings (%) Prospective observational studies (n)* Prospective observational studies with significant association in the opposite direction (%) Case-control studies assessing the risk- outcome pair relationship (n)† Case-control studies that show significant association in the opposite direction (%) Lower limit of RR >1·5 Dose– response relationship Biological plausibility ‡ Analogy§
(Continued from previous page) 4 Low birthweight for
gestation Otitis media 0 ·· ·· 20 0 ·· ·· Yes Yes Yes Yes
4 Low birthweight for
gestation Pneumococcal meningitis 0 ·· ·· 20 0 ·· ·· Yes Yes Yes Yes
4 Low birthweight for
gestation Haemophilus influenzae type B
meningitis
0 ·· ·· 20 0 ·· ·· Yes Yes Yes Yes
4 Low birthweight for
gestation Meningococcal infection 0 ·· ·· 20 0 ·· ·· Yes Yes Yes Yes
4 Low birthweight for
gestation Other meningitis 0 ·· ·· 20 0 ·· ·· Yes Yes Yes Yes
4 Low birthweight for
gestation Encephalitis 0 ·· ·· 20 0 ·· ·· Yes Yes Yes Yes
4 Low birthweight for
gestation Neonatal preterm birth complications
0 ·· ·· 20 0 ·· ·· Yes Yes Yes Yes
4 Low birthweight for
gestation Neonatal encephalopathy due to birth asphyxia and trauma
0 ·· ·· 20 0 ·· ·· Yes Yes Yes Yes
4 Low birthweight for
gestation Neonatal sepsis and other neonatal infections
0 ·· ·· 20 0 ·· ·· Yes Yes Yes Yes
4 Low birthweight for
gestation Haemolytic disease and other neonatal jaundice
0 ·· ·· 20 0 ·· ·· Yes Yes Yes Yes
4 Low birthweight for
gestation Other neonatal disorders 0 ·· ·· 20 0 ·· ·· Yes Yes Yes Yes
4 Low birthweight for
gestation Sudden infant death syndrome 0 ·· ·· 20 0 ·· ·· Yes Yes Yes Yes
3 Vitamin A deficiency Diarrhoeal
diseases 19 0 63 0 ·· ·· ·· No ·· Yes No
3 Vitamin A deficiency Measles 12 0 83 0 ·· ·· ·· Yes ·· Yes No
3 Zinc deficiency Diarrhoeal
diseases 14 0 29 0 ·· ·· ·· No ·· Yes No
3 Zinc deficiency Lower respiratory infections
6 0 17 0 ·· ·· ·· No ·· Yes No
2 Tobacco
3 Smoking Tuberculosis 0 ·· ·· 4 0 10 0 No ·· Yes Yes
3 Smoking Lip and oral
cavity cancer 0 ·· ·· 5 0 ·· ·· Yes ·· Yes Yes
3 Smoking Nasopharynx
cancer 0 ·· ·· 4 0 28 0 Yes ·· Yes Yes
3 Smoking Oesophageal
cancer 0 ·· ·· 5 0 ·· ·· Yes ·· Yes Yes
3 Smoking Colon and
rectum cancer 0 ·· ·· 19 0 ·· ·· No ·· Yes Yes
3 Smoking Liver cancer 0 ·· ·· 54 0 ·· ·· Yes ·· Yes Yes
3 Smoking Gastric cancer 0 ·· ·· 19 0 ·· ·· No ·· Yes Yes
Risk Outcome RCTs (n) RCTs with significant effect in the opposite direction (%) RCTs with null findings (%) Prospective observational studies (n)* Prospective observational studies with significant association in the opposite direction (%) Case-control studies assessing the risk- outcome pair relationship (n)† Case-control studies that show significant association in the opposite direction (%) Lower limit of RR >1·5 Dose– response relationship Biological plausibility ‡ Analogy§
(Continued from previous page)
3 Smoking Pancreatic
cancer 0 ·· ·· 19 0 ·· ·· Yes ·· Yes Yes
3 Smoking Larynx cancer 0 ·· ·· 5 0 ·· ·· Yes ·· Yes Yes
3 Smoking Tracheal,
bronchus, and lung cancer
0 ·· ·· 38 0 ·· ·· Yes ·· Yes Yes
3 Smoking Breast cancer 0 ·· ·· 19 0 ·· ·· No ·· Yes Yes
3 Smoking Cervical cancer 0 ·· ·· 15 0 ·· ·· No ·· Yes Yes
3 Smoking Prostate cancer 0 ·· ·· 19 0 ·· ·· No ·· Yes Yes
3 Smoking Kidney cancer 0 ·· ·· 8 0 ·· ·· Yes ·· Yes Yes
3 Smoking Bladder cancer 0 ·· ·· 37 0 ·· ·· Yes ·· Yes Yes
3 Smoking Leukaemia 0 ·· ·· 22 0 ·· ·· No ·· Yes Yes
3 Smoking Ischaemic heart
disease 0 ·· ·· 86 .. ·· ·· No ·· Yes Yes
3 Smoking Ischaemic stroke 0 ·· ·· 60 .. ·· ·· No ·· Yes Yes
3 Smoking Haemorrhagic
stroke 0 ·· ·· 60 .. ·· ·· No ·· Yes Yes
3 Smoking Atrial fibrillation
and flutter 0 ·· ·· 16 0 ·· ·· No ·· Yes Yes
3 Smoking Peripheral
vascular disease 0 ·· ·· 10 0 ·· ·· No ·· Yes Yes
3 Smoking Other cardiovascular and circulatory diseases 0 ·· ·· 5 0 ·· ·· No ·· Yes Yes 3 Smoking Chronic obstructive pulmonary disease
0 ·· ·· 42 0 ·· ·· Yes ·· Yes Yes
3 Smoking Asthma 0 ·· ·· 8 12 ·· ·· No ·· Yes Yes
3 Smoking Other chronic
respiratory diseases
0 ·· ·· 5 0 ·· ·· Yes ·· Yes Yes
3 Smoking Peptic ulcer
disease 0 ·· ·· 7 0 ·· ·· No ·· Yes No
3 Smoking Gallbladder and
biliary diseases 0 ·· ·· 10 0 ·· ·· No ·· Yes Yes
3 Smoking Alzheimer’s
disease and other dementias
0 ·· ·· 13 8 ·· ·· No ·· Yes Yes
3 Smoking Parkinson’s
disease 0 ·· ·· 8 0 ·· ·· Yes ·· Yes Yes
3 Smoking Multiple
sclerosis 0 ·· ·· 6 0 ·· ·· No ·· Yes Yes
3 Smoking Diabetes
mellitus 0 ·· ·· 88 0 ·· ·· No ·· Yes No
3 Smoking Rheumatoid
arthritis 0 ·· ·· 5 0 ·· ·· No ·· Yes No
3 Smoking Low back pain 0 ·· ·· 13 0 ·· ·· No ·· Yes Yes
3 Smoking Cataract 0 ·· ·· 13 0 ·· ·· No ·· Yes No
3 Smoking Macular
degeneration 0 ·· ·· 5 0 ·· ·· No ·· Yes No
Risk Outcome RCTs (n) RCTs with significant effect in the opposite direction (%) RCTs with null findings (%) Prospective observational studies (n)* Prospective observational studies with significant association in the opposite direction (%) Case-control studies assessing the risk- outcome pair relationship (n)† Case-control studies that show significant association in the opposite direction (%) Lower limit of RR >1·5 Dose– response relationship Biological plausibility ‡ Analogy§
(Continued from previous page)
3 Smoking Low bone mass-
related fractures 0 ·· ·· 14 14 ·· ·· No ·· Yes Yes
3 Smoking Hip fracture 0 ·· ·· 15 20 ·· ·· No ·· Yes Yes
3 Smoking Abdominal
aortic aneurism 0 ·· ·· 10 0 ·· ·· No ·· Yes Yes
3 Smokeless tobacco Oral cancer 0 ·· ·· 4 0 21 5 Yes ·· Yes Yes
3 Smokeless tobacco Oesophageal
cancer 0 ·· ·· 2 0 10 0 Yes ·· Yes Yes
3 Second-hand smoke Lower respiratory infections
0 ·· ·· 18 0 ·· ·· No Yes Yes Yes
3 Second-hand smoke Otitis media 0 ·· ·· 1 0 4 0 No ·· Yes Yes
3 Second-hand smoke Tracheal, bronchus, and lung cancer
0 ·· ·· 13 0 ·· ·· No Yes Yes Yes
3 Second-hand smoke Breast cancer 0 ·· ·· 21 0 ·· ·· No ·· Yes Yes
3 Second-hand smoke Ischaemic heart
disease 0 ·· ·· 5 0 ·· ·· No Yes Yes Yes
3 Second-hand smoke Ischaemic stroke 0 ·· ·· 4 0 3 ·· No Yes Yes Yes
3 Second-hand smoke Haemorrhagic
stroke 0 ·· ·· 4 0 3 ·· No Yes Yes Yes
3 Second-hand smoke Chronic obstructive pulmonary disease
0 ·· ·· 2 0 1 0 No Yes Yes Yes
3 Second-hand smoke Diabetes
mellitus 0 ·· ·· 5 0 ·· ·· No ·· Yes Yes
2 Alcohol and drug use
3 Alcohol use Tuberculosis 0 ·· ·· 3 0 18 11 Yes Yes Yes Yes
3 Alcohol use Lower
respiratory infections
0 ·· ·· 2 0 2 0 Yes Yes Yes Yes
3 Alcohol use Lip and oral
cavity cancer 0 ·· ·· 6 0 ·· ·· Yes Yes Yes Yes
3 Alcohol use Nasopharynx
cancer 0 ·· ·· 6 0 ·· ·· Yes Yes Yes Yes
3 Alcohol use Other pharynx
cancer 0 ·· ·· 6 0 ·· ·· Yes Yes Yes Yes
3 Alcohol use Oesophageal
cancer 0 ·· ·· 10 0 ·· ·· Yes Yes Yes Yes
3 Alcohol use Colon and
rectum cancer 0 ·· ·· 15 13 ·· ·· Yes Yes Yes Yes
3 Alcohol use Liver cancer 0 ·· ·· 9 0 ·· ·· Yes Yes Yes Yes
3 Alcohol use Larynx cancer 0 ·· ·· 7 0 ·· ·· Yes Yes Yes Yes
3 Alcohol use Breast cancer 0 ·· ·· 13 23 ·· ·· Yes Yes Yes Yes
3 Alcohol use Ischaemic heart
disease 0 ·· ·· 63 0 ·· ·· Yes Yes Yes Yes
3 Alcohol use Ischaemic stroke 0 ·· ·· 20 0 ·· ·· Yes Yes Yes Yes
3 Alcohol use Haemorrhagic
stroke 0 ·· ·· 16 0 ·· ·· Yes Yes Yes Yes
3 Alcohol use Hypertensive
heart disease 0 ·· ·· 12 0 ·· ·· Yes Yes Yes Yes
Risk Outcome RCTs (n) RCTs with significant effect in the opposite direction (%) RCTs with null findings (%) Prospective observational studies (n)* Prospective observational studies with significant association in the opposite direction (%) Case-control studies assessing the risk- outcome pair relationship (n)† Case-control studies that show significant association in the opposite direction (%) Lower limit of RR >1·5 Dose– response relationship Biological plausibility ‡ Analogy§
(Continued from previous page) 3 Alcohol use Atrial fibrillation
and flutter 0 ·· ·· 10 10 ·· ·· Yes Yes Yes Yes
3 Alcohol use Cirrhosis 0 ·· ·· 14 0 ·· ·· Yes Yes Yes Yes
3 Alcohol use Pancreatitis 0 ·· ·· 4 50 3 0 Yes Yes Yes No
3 Alcohol use Epilepsy 0 ·· ·· 1 0 2 0 No Yes Yes No
3 Alcohol use Diabetes
mellitus 0 ·· ·· 37 32 ·· ·· Yes Yes Yes No
3 Alcohol use Motor vehicle
road injuries 0 ·· ·· 3 0 ·· ·· Yes Yes Yes Yes
3 Alcohol use Unintentional
injuries 0 ·· ·· 4 0 4 0 Yes Yes Yes Yes
3 Alcohol use Self-harm 0 ·· ·· 0 ·· ·· ·· Yes Yes Yes Yes
3 Alcohol use Interpersonal
violence 0 ·· ·· 2 0 1 0 Yes Yes Yes Yes
3 Drug use Hepatitis B 0 ·· ·· 6 0 ·· ·· Yes ·· Yes Yes
3 Drug use Hepatitis C 0 ·· ·· 16 0 ·· ·· Yes ·· Yes Yes
3 Drug use Self-harm 0 ·· ·· 1 0 0 0 No ·· Yes No
2 Dietary risks
3 Diet low in fruits Lip and oral
cavity cancer 0 ·· ·· 2 0 15 0 No Yes Yes Yes
3 Diet low in fruits Nasopharynx
cancer 0 ·· ·· 2 0 15 0 No Yes Yes Yes
3 Diet low in fruits Other pharynx
cancer 0 ·· ·· 2 0 15 0 No Yes Yes Yes
3 Diet low in fruits Oesophageal
cancer 0 ·· ·· 5 0 ·· ·· No Yes Yes Yes
3 Diet low in fruits Larynx cancer 0 ·· ·· 2 0 15 0 No Yes Yes Yes
3 Diet low in fruits Tracheal, bronchus, and lung cancer
0 ·· ·· 22 0 ·· ·· No Yes Yes Yes
3 Diet low in fruits Ischaemic heart
disease 0 ·· ·· 9 0 ·· ·· No Yes Yes Yes
3 Diet low in fruits Ischaemic stroke 0 ·· ·· 9 0 ·· ·· No Yes Yes Yes
3 Diet low in fruits Haemorrhagic
stroke 0 ·· ·· 5 0 ·· ·· No Yes Yes Yes
3 Diet low in fruits Diabetes
mellitus 0 ·· ·· 9 0 ·· ·· No Yes Yes No
3 Diet low in
vegetables Oesophageal cancer 0 ·· ·· 5 0 ·· ·· No Yes Yes No
3 Diet low in
vegetables Ischaemic heart disease 0 ·· ·· 9 0 ·· ·· No Yes Yes Yes
3 Diet low in
vegetables Ischaemic stroke 0 ·· ·· 8 0 ·· ·· No Yes Yes Yes
3 Diet low in
vegetables Haemorrhagic stroke 0 ·· ·· 5 0 ·· ·· No Yes Yes Yes
3 Diet low in legumes Ischaemic heart
disease 0 ·· ·· 5 0 ·· ·· No Yes Yes No
3 Diet low in whole
grains Ischaemic heart disease 0 ·· ·· 7 0 ·· ·· No Yes Yes Yes
3 Diet low in whole
grains Ischaemic stroke 0 ·· ·· 6 0 ·· ·· No Yes Yes Yes
Risk Outcome RCTs (n) RCTs with significant effect in the opposite direction (%) RCTs with null findings (%) Prospective observational studies (n)* Prospective observational studies with significant association in the opposite direction (%) Case-control studies assessing the risk- outcome pair relationship (n)† Case-control studies that show significant association in the opposite direction (%) Lower limit of RR >1·5 Dose– response relationship Biological plausibility ‡ Analogy§
(Continued from previous page) 3 Diet low in whole
grains Haemorrhagic stroke 0 ·· ·· 6 0 ·· ·· No Yes Yes Yes
3 Diet low in whole
grains Diabetes mellitus 0 ·· ·· 10 0 ·· ·· No Yes Yes No
3 Diet low in nuts and
seeds Ischaemic heart disease 1 0 100 6 0 ·· ·· No Yes Yes No
3 Diet low in nuts and
seeds Diabetes mellitus 1 0 100 5 0 ·· ·· No Yes Yes No
3 Diet low in milk Colon and
rectum cancer 0 ·· ·· 7 0 ·· ·· No Yes Yes No
3 Diet high in red
meat Colon and rectum cancer 0 ·· ·· 8 0 ·· ·· No Yes Yes No
3 Diet high in red
meat Diabetes mellitus 0 ·· ·· 9 11 ·· ·· No Yes Yes No
3 Diet high in
processed meat Colon and rectum cancer 0 ·· ·· 9 11 ·· ·· No Yes Yes No
3 Diet high in
processed meat Ischaemic heart disease 0 ·· ·· 5 0 ·· ·· No Yes Yes No
3 Diet high in
processed meat Diabetes mellitus 0 ·· ·· 8 0 ·· ·· No Yes Yes No
3 Diet high in sugar-sweetened beverages
Body-mass
index 10 0 60 22 0 ·· ·· Yes Yes Yes No
3 Diet low in fibre Colon and
rectum cancer 0 ·· ·· 15 0 ·· ·· No Yes Yes No
3 Diet low in fibre Ischaemic heart
disease 0 ·· ·· 12 0 ·· ·· No Yes Yes No
3 Diet low in calcium Colon and
rectum cancer 0 ·· ·· 13 0 ·· ·· No Yes Yes No
3 Diet low in seafood
omega 3 fatty acids Ischaemic heart disease 17 0 94 16 0 ·· ·· No Yes Yes No
3 Diet low in polyunsaturated fatty acids
Ischaemic heart
disease 8 0 75 11 0 ·· ·· No Yes Yes No
3 Diet high in trans
fatty acids Ischaemic heart disease 0 ·· ·· 13 0 ·· ·· No Yes Yes No
3 Diet high in sodium Stomach cancer 0 ·· ·· 10 0 ·· ·· No Yes Yes No
3 Diet high in sodium Systolic blood
pressure 45 0 73 0 .. ·· ·· No Yes Yes No
2 Sexual abuse and violence 3 Childhood sexual
abuse Alcohol use disorders 0 ·· ·· 2 0 3 0 No .. Yes Yes
3 Childhood sexual
abuse Depressive disorders 0 ·· ·· 7 0 ·· ·· No ·· Yes Yes
3 Intimate partner
violence HIV/AIDS 0 ·· ·· 2 0 0 0 No ·· Yes No
3 Intimate partner
violence Maternal abortion, miscarriage, and ectopic pregnancy
0 ·· ·· 1 0 3 0 Yes ·· Yes No
3 Intimate partner
violence Depressive disorders 0 ·· ·· 4 0 0 0 No ·· Yes Yes
Risk Outcome RCTs (n) RCTs with significant effect in the opposite direction (%) RCTs with null findings (%) Prospective observational studies (n)* Prospective observational studies with significant association in the opposite direction (%) Case-control studies assessing the risk- outcome pair relationship (n)† Case-control studies that show significant association in the opposite direction (%) Lower limit of RR >1·5 Dose– response relationship Biological plausibility ‡ Analogy§
(Continued from previous page) 2 Low physical activity 2 Low physical activity Colon and
rectum cancer 0 ·· ·· 20 15 ·· ·· No Yes Yes Yes
2 Low physical activity Breast cancer 0 ·· ·· 35 0 ·· ·· No Yes Yes Yes
2 Low physical activity Ischaemic heart
disease 0 ·· ·· 45 9 ·· ·· No Yes Yes Yes
2 Low physical activity Ischaemic stroke 0 ·· ·· 27 11 ·· ·· No Yes Yes Yes
2 Low physical activity Diabetes
mellitus 0 ·· ·· 57 7 ·· ·· No Yes Yes No
2 High fasting plasma
glucose Tuberculosis 0 ·· ·· 18 0 ·· ·· Yes Yes Yes No
2 High fasting plasma
glucose Colon and rectum cancer 0 ·· ·· 21 0 ·· ·· No ·· ·· Yes
2 High fasting plasma
glucose Liver cancer 0 ·· ·· 28 0 ·· ·· Yes ·· ·· No
2 High fasting plasma
glucose Pancreatic cancer 0 ·· ·· 35 0 ·· ·· Yes ·· ·· Yes
2 High fasting plasma
glucose Lung cancer 0 ·· ·· 16 6 ·· ·· No ·· ·· Yes
2 High fasting plasma
glucose Breast cancer 0 ·· ·· 39 0 ·· ·· No ·· ·· Yes
2 High fasting plasma
glucose Ovarian cancer 0 ·· ·· 11 0 ·· ·· No ·· ·· Yes
2 High fasting plasma
glucose Bladder cancer 0 ·· ·· 14 0 ·· ·· No ·· ·· Yes
2 High fasting plasma
glucose Ischaemic heart disease 8 0 100 150 ·· ·· ·· Yes Yes Yes Yes
2 High fasting plasma
glucose Ischaemic stroke 9 0 100 150 ·· ·· ·· Yes Yes Yes Yes
2 High fasting plasma
glucose Haemorrhagic stroke 9 0 100 150 ·· ·· ·· Yes Yes Yes Yes
2 High fasting plasma
glucose Alzheimer’s disease and other dementias
0 ·· ·· 17 0 ·· ·· No ·· ·· No
2 High fasting plasma
glucose Peripheral vascular disease 14 ·· ·· 4 0 ·· ·· Yes Yes Yes Yes
2 High fasting plasma
glucose Chronic kidney disease 5 ·· ·· 32 ·· ·· ·· Yes Yes Yes No
2 High fasting plasma
glucose Glaucoma 0 ·· ·· 5 0 ·· ·· No ·· ·· Yes
2 High fasting plasma
glucose Cataract 0 ·· ·· 1 0 1 0 No ·· ·· Yes
2 High total
cholesterol Ischaemic heart disease 21 0 57 88 ·· ·· ·· Yes Yes Yes Yes
2 High total
cholesterol Ischaemic stroke 21 0 57 88 ·· ·· ·· Yes Yes Yes Yes
2 High systolic blood
pressure Rheumatic heart disease 0 ·· ·· 62 ·· ·· ·· Yes Yes Yes Yes
2 High systolic blood
pressure Ischaemic heart disease 56 0 ·· 88 ·· ·· ·· Yes Yes Yes Yes
2 High systolic blood
pressure Ischaemic stroke 54 0 .. 150 ·· ·· ·· Yes Yes Yes Yes
Risk Outcome RCTs (n) RCTs with significant effect in the opposite direction (%) RCTs with null findings (%) Prospective observational studies (n)* Prospective observational studies with significant association in the opposite direction (%) Case-control studies assessing the risk- outcome pair relationship (n)† Case-control studies that show significant association in the opposite direction (%) Lower limit of RR >1·5 Dose– response relationship Biological plausibility ‡ Analogy§
(Continued from previous page) 2 High systolic blood
pressure Haemorrhagic stroke 54 0 ·· 150 ·· ·· ·· Yes Yes Yes Yes
2 High systolic blood
pressure Cardiomyopathy and myocarditis 0 ·· ·· 62 ·· ·· ·· Yes Yes Yes Yes
2 High systolic blood
pressure Other cardiomyopathy 0 ·· ·· 62 ·· ·· ·· Yes Yes Yes Yes
2 High systolic blood
pressure Atrial fibrillation and flutter 20 5 60 88 ·· ·· ·· Yes Yes Yes Yes
2 High systolic blood
pressure Aortic aneurysm 0 ·· ·· 62 ·· ·· ·· Yes Yes Yes Yes
2 High systolic blood
pressure Peripheral vascular disease 0 ·· ·· 88 ·· ·· ·· Yes Yes Yes Yes
2 High systolic blood
pressure Endocarditis 0 ·· ·· 62 ·· ·· ·· Yes Yes Yes Yes
2 High systolic blood
pressure Other cardiovascular and circulatory diseases
0 ·· ·· 88 ·· ·· ·· No Yes Yes Yes
2 High systolic blood
pressure Chronic kidney disease 8 ·· ·· 88 ·· ·· ·· Yes Yes Yes No
2 High body-mass
index (adult) Non-Hodgkin lymphoma 0 ·· ·· 8 0 ·· ·· No Yes Yes Yes
2 High body-mass
index (adult) Oesophageal cancer 0 ·· ·· 16 0 ·· ·· .. Yes Yes Yes
2 High body-mass
index (adult) Colon and rectum cancer 0 ·· ·· 38 0 ·· ·· No Yes Yes Yes
2 High body-mass
index (adult) Liver cancer 0 ·· ·· 34 0 ·· ·· No Yes Yes Yes
2 High body-mass
index (adult) Gallbladder and biliary tract cancer
0 ·· ·· 10 0 ·· ·· No Yes Yes Yes
2 High body-mass
index (adult) Pancreatic cancer 0 ·· ·· 20 0 ·· ·· No Yes Yes Yes
2 High body-mass
index (adult) Breast cancer (post menopause)
0 ·· ·· 44 2 ·· ·· No Yes Yes Yes
2 High body-mass
index (adult) Breast cancer (pre-menopause)
0 ·· ·· 25 8 ·· ·· No Yes Yes No
2 High body-mass
index (adult) Uterine cancer 0 ·· ·· 37 0 ·· ·· No Yes Yes Yes
2 High body-mass
index (adult) Ovarian cancer 0 ·· ·· 31 3 ·· ·· No Yes Yes Yes
2 High body-mass
index (adult) Kidney cancer 0 ·· ·· 28 0 ·· ·· No Yes Yes Yes
2 High body-mass
index (adult) Thyroid cancer 0 ·· ·· 16 0 ·· ·· No Yes Yes Yes
2 High body-mass
index (adult) Multiple myeloma 0 ·· ·· 20 ·· ·· ·· ·· Yes Yes Yes
2 High body-mass
index (adult) Leukaemia 0 ·· ·· 17 0 ·· ·· No Yes Yes Yes
2 High body-mass
index (adult) Ischaemic heart disease 0 ·· ·· 129 ·· ·· ·· No Yes Yes Yes
(appendix 1 p 22 for more detail). Fourth, we performed a
systematic review of all cohort and case-control studies
reporting a RR, hazard ratio, or odds ratio for any
risk-outcome pairs studied in GBD 2016 and then modelled a
dose-response relationship using DisMod ordinary
differential equations (ODE).
18Fifth, we estimated injury
PAFs from cohort studies and adjusted them to account
for victims.
Risk Outcome RCTs (n) RCTs with significant effect in the opposite direction (%) RCTs with null findings (%) Prospective observational studies (n)* Prospective observational studies with significant association in the opposite direction (%) Case-control studies assessing the risk- outcome pair relationship (n)† Case-control studies that show significant association in the opposite direction (%) Lower limit of RR >1·5 Dose– response relationship Biological plausibility ‡ Analogy§(Continued from previous page) 2 High body-mass
index (adult) Ischaemic stroke 0 ·· ·· 102 ·· ·· ·· No Yes Yes Yes
2 High body-mass
index (adult) Haemorrhagic stroke 0 ·· ·· 129 ·· ·· ·· No Yes Yes Yes
2 High body-mass
index (adult) Hypertensive heart disease 0 ·· ·· 85 ·· ·· ·· No Yes Yes Yes
2 High body-mass
index (adult) Atrial fibrillation and flutter 0 ·· ·· 5 0 ·· ·· ·· No Yes Yes
2 High body-mass
index (adult) Asthma 0 ·· ·· 7 0 ·· ·· ·· Yes Yes No
2 High body-mass
index (adult) Alzheimer’s disease and other dementias
0 ·· ·· 6 0 ·· ·· ·· No Yes No
2 High body-mass
index (adult) Gallbladder disease 0 ·· ·· 16 0 ·· ·· ·· Yes Yes Yes
2 High body-mass
index (adult) Diabetes mellitus 0 ·· ·· 85 .. ·· ·· Yes Yes Yes No
2 High body-mass
index (adult) Chronic kidney disease 0 ·· ·· 57 ·· ·· ·· No Yes Yes No
2 High body-mass
index (adult) Osteoarthritis 0 ·· ·· 32 0 ·· ·· No Yes Yes Yes
2 High body-mass
index (adult) Low back pain 0 ·· ·· 5 0 ·· ·· No Yes Yes Yes
2 High body-mass
index (adult) Gout 0 ·· ·· 10 0 ·· ·· .. Yes Yes No
2 High body-mass
index (adult) Cataract 0 ·· ·· 17 0 ·· ·· .. Yes Yes No
2 High body-mass
index (child) Asthma 0 ·· ·· 5 0 ·· ·· No Yes Yes No
2 Low bone mineral
density Injuries 0 ·· ·· 12 .. ·· ·· No Yes Yes Yes
2 Impaired kidney
function Ischaemic heart disease 0 ·· ·· 6 0 ·· ·· Yes ·· Yes Yes
2 Impaired kidney
function Ischaemic stroke 0 ·· ·· 6 0 ·· ·· Yes ·· Yes Yes
2 Impaired kidney
function Haemorrhagic stroke 0 ·· ·· 8 0 ·· ·· Yes ·· Yes Yes
2 Impaired kidney
function Peripheral vascular disease 0 ·· ·· 5 0 ·· ·· Yes ·· Yes Yes
2 Impaired kidney
function Gout 0 ·· ·· 3 0 0 0 Yes ·· Yes No
If multiple reports existed from the same study, we counted them as one study. We only assessed the dose–response relationship for continuous risks. To evaluate the magnitude of the effect size for continuous risks, we evaluated the relative risk comparing the 75th percentile with the 25th percentile of the exposure distribution at the global level. RCT=randomised controlled trial. RR=relative risk. *Prospective cohort studies or non-randomised interventions. †Case-control studies were included for those risk-outcome pairs where the sum of RCT and prospective observational studies included was less than five (where applicable). ‡Whether or not any biological or mechanistic pathway exists that could potentially explain the relationship of the risk-outcome pair. §Whether or not the risk is associated with another outcome from the same category and whether or not any evidence exists that it can cause the current outcome through the same pathway.
Table 1: Descriptive cataloguing of the epidemiological evidence used to assess whether each risk-outcome paper meets the causal criteria for inclusion in the Global Burden of Disease Study 2016 by risk level
Risk factors Exposure definition Theoretical minimum risk exposure
level Data representativeness index
<2006 2006–16 Total
0 All ·· ·· 100·0% 100·0% 100·0%
1 Environmental and
occupational risks ·· ·· 100·0% 100·0% 100·0%
2 Unsafe water, sanitation,
and handwashing ·· ·· 58·0% 75·4% 70·0%
3 Unsafe water source Proportion of households with access to different water sources (unimproved, improved except piped, piped water supply) and reported use of household water treatment methods (boiling or filtering, chlorinating or solar filtering, no treatment)
All households have access to water from a piped water supply that is also boiled or filtered before drinking
70·1% 88·4% 83·5%
3 Unsafe sanitation Proportion of households with access to different sanitation
facilities (unimproved, improved except sewer, sewer connection) All households have access to toilets with sewer connection 69·5% 88·4% 83·5% 3 No access to handwashing
facility Proportion of households with access to handwashing facility with soap, water, and wash station All households have access to handwashing facility with soap, water, and wash station
10·3% 33·3% 35·4%
2 Air pollution ·· ·· 100·0% 100·0% 100·0%
3 Ambient particulate matter
pollution Annual average daily exposure to outdoor air concentrations of PM2·5
Uniform distribution between 2·4 µg/m³
and 5·9 µg/m³ 23·1% 56·9% 78·0%
3 Household air pollution from
solid fuels Individual exposure to PM2·5 due to use of solid cooking fuels No households are exposed to excess indoor concentration of particles from solid fuel use (assuming PM2·5 in no fuel use is consistent with a TMREL of 2·4–5·9)
72·8% 59·5% 76·4%
3 Ambient ozone pollution Seasonal (3 month) hourly maximum ozone concentrations,
measured in ppb Uniform distribution between 33·3 µg/m³ and 41·9 µg/m³, according to minimum/5th percent concentrations
100·0% 100·0% 100·0%
2 Other environmental risks ·· ·· 48·7% 26·2% 51·8%
3 Residential radon Average daily exposure to indoor air radon levels measured in becquerels (radon disintegrations per second) per cubic metre (Bq/ m³)
10 Bq/m³, corresponding to the outdoor
concentration of radon 39·0% 0·0% 39·0%
3 Lead exposure Blood lead levels in µg/dL of blood, bone lead levels in µg/g of
bone 2 ug/dL, corresponding to lead levels in pre-industrial humans as natural sources of lead prevent the feasibility of zero exposure
37·4% 26·2% 43·6%
2 Occupational risks ·· ·· 92·3% 90·8% 100·0%
3 Occupational carcinogens ·· ·· 86·7% 85·6% 92·8%
4 Occupational exposure to
asbestos Proportion of the population with cumulative exposure to asbestos No occupational exposure to asbestos 82·6% 74·9% 87·2% 4 Occupational exposure to
arsenic Proportion of the population ever exposed to arsenic at work or through their occupation No occupational exposure to arsenic 82·6% 74·9% 87·2% 4 Occupational exposure to
benzene Proportion of the population ever exposed to benzene at work or through their occupation No occupational exposure to benzene 82·6% 74·9% 87·2% 4 Occupational exposure to
beryllium Proportion of the population ever exposed to beryllium at work or through their occupation No occupational exposure to beryllium 82·6% 74·9% 87·2% 4 Occupational exposure to
cadmium Proportion of the population ever exposed to cadmium at work or through their occupation No occupational exposure to cadmium 82·6% 74·9% 87·2% 4 Occupational exposure to
chromium Proportion of the population ever exposed to chromium at work or through their occupation No occupational exposure to chromium 82·6% 74·9% 87·2% 4 Occupational exposure to
diesel engine exhaust Proportion of the population ever exposed to diesel engine exhaust at work or through their occupation No occupational exposure to diesel engine exhaust 82·6% 74·9% 87·2% 4 Occupational exposure to
second-hand smoke Proportion of the population ever exposed to second-hand smoke at work or through their occupation No occupational exposure to second-hand smoke 82·6% 74·9% 87·2% 4 Occupational exposure to
formaldehyde Proportion of the population ever exposed to formaldehyde at work or through their occupation No occupational exposure to formaldehyde 82·6% 74·9% 87·2% 4 Occupational exposure to
nickel Proportion of the population ever exposed to nickel at work or through their occupation No occupational exposure to nickel 82·6% 74·9% 87·2% 4 Occupational exposure to
polycyclic aromatic hydrocarbons
Proportion of the population ever exposed to polycyclic aromatic
hydrocarbons at work or through their occupation No occupational exposure to polycyclic aromatic hydrocarbons 82·6% 74·9% 87·2% (Table 2 continues on next page)


![Figure 2 shows that in 2016, the leading Level 2 risk factors in terms of attributable DALYs at the global level for both sexes combined were malnutrition (11·5% [10·8–12·3] of DALYs), diet (9·6% [8·2–11·1] of DALYs), high blood pressure (8·9% [7·9–9·9](https://thumb-eu.123doks.com/thumbv2/5dokorg/3936670.68876/27.892.52.720.183.893/figure-leading-level-factors-attributable-combined-malnutrition-pressure.webp)


