http://www.diva-portal.org
Postprint
This is the accepted version of a paper published in European Journal of Finance. This paper has been peer-reviewed but does not include the final publisher proof-corrections or journal pagination.
Citation for the original published paper (version of record): Barasinska, N., Schäfer, D. (2018)
Gender role asymmetry and stock market participation – evidence from four European household surveys
European Journal of Finance, 24(12): 1026-1046
https://doi.org/10.1080/1351847X.2017.1371622
Access to the published version may require subscription. N.B. When citing this work, cite the original published paper.
Permanent link to this version:
Gender role asymmetry and stock market participation
-Evidence from four European household surveys
∗Nataliya Barasinska† Dorothea Sch¨afer‡
September 20, 2017
Abstract
This study investigates the importance of social norms for shaping women’s and men’s decision to participate in the stock market, aiming to disentangle the different channels playing a role in this decision. Gender role asymmetry is indicated by the country’s rank in the gender equality index of the World Economic Forum. Using data from four national household surveys, we find that in Italy – the country with highly asymmetric gender role prescriptions – women’s risk-taking behavior responds to this non-supportive environment. Consistent with the theory of social identity, Italian women refrain from stock market partic-ipation more than their self-reported risk tolerance levels would suggest. In contrast, in the three countries with a lower asymmetry in gender role prescriptions, no exaggerated female backing off from investing in stocks is observable. The result is robust to separately analyz-ing sub-samples of sanalyz-ingles and couples. However, women who self-select into stock market participation invest the same portfolio share in stocks as do their male peers – independent of the society’s degree of gender role divergence.
Keywords: Stock market participation; Gender; Social norms; Risk tolerance; Self-selection JEL classification: G11, J16
∗
The Version of Record of this manuscript has been published and is available in The European Jour-nal of Finance (published online: 11 Sep 2017) http://www.tandfonline.com/10.1080/1351847X.2017.1371622, http://dx.doi.org/10.1080/1351847X.2017.1371622. We are grateful to two anonymous reviewers for their fruitful recommendations. We also thank Dimitris Georgarakos, Heinz Hermann, Reinhard Hujer, Alexander Muravyev, Doris Neuberger, Tobias Schmidt, Alfred Steinherr, Brigitte Young, and participants of the research seminars at the Deutsche Bundesbank for valuable comments on earlier versions of this paper. The valuable input by Oleg Badunenko during the very early stages of this study, as well as the helpful comments by participants at the Annual Conference of the European Economic Association in Glasgow and the German Economic Association in Kiel, are also gratefully acknowledged. The work is part of the work package Gender and Capital Markets of the FINESS project (Financial Systems and Stimulation of Sustainable Growth), supported by the European Commission under the 7th Framework Programme, Grant Agreement No. 217266.
†
Deutsche Bundesbank, Wilhelm-Epstein-Straße 14, 60431 Frankfurt am Main, Germany. Tel.: +49-069-9566-5113. E-mail: nataliya.barasinska@bundesbank.de. The paper represents the author’s personal opinions and does not necessarily reflect the views of the Deutsche Bundesbank or its staff.
‡
Corresponding author, German Institute for Economic Research DIW Berlin, J¨onk¨oping University, J¨onk¨oping International Business School JIBS, and Center for Relationship Banking and Economics CERBE, Rom. Address: Mohrenstr. 58, 10117 Berlin, Germany. Phone: +49-30-8978-9162. Fax.: +49-30-8978-9104. E-mail:
dschae-1
Introduction
In this paper, we investigate the importance of social norms for shaping the decision of women and men to participate in the stock market. Thereby, we aim to disentangle the different channels playing a role in this decision. Risk preferences are traditionally expected to be particularly important. However, according to Akerlof and Kranton (2000)’s framework, social identity is another highly relevant channel. If social norms prescribe that financial risk-taking is a male domain, then individual women may actually invest less in risky stocks than their risk preferences suggest. Although we focus on the social identity channel, other channels, in particular self-selection and marital status are accounted for.
In order to explore the impact of social norms on female financial risk-taking, we analyze data from four particularly rich European household surveys, covering Austria, Italy, the Netherlands and Spain. These are the only European surveys providing, in addition to the common socio-economic characteristics, the information we need: the degree of risk tolerance, the incidence of stock investment, and, if there is investment, the amount.1 To assess the degree of asymmetry in social norms in the countries under consideration, we use the ranks from the country-level gender equality index of the World Economic Forum (Hausmann, Tyson, and Zahidi, 2006). The Netherlands, Spain and Austria rank in the top-quarter of this index while Italy is in the bottom third.
We find that in Italy – the country with highly asymmetric gender role prescriptions – women’s risk taking behavior responds to this non-supportive environment. Consistent with the theory of social identity, Italian women refrain from stock market participation more than their self-reported risk tolerance levels would suggest. In contrast, in the three countries with a more supportive environment, i.e. a lower asymmetry in gender role prescriptions, no exaggerated female backing off from investing in stocks is observable. The result is robust to analyzing separately sub-samples of singles and couples.
Another important result is that the consequences of female self-selection into stock market participation appears to be unrelated to the society’s degree of gender role divergence: Those women who invest in stocks hold the same portfolio share in stocks as do their male peers in all four European countries. Finally, the particularly rich Dutch survey allows us to establish that
1The richness of the representative household surveys comes at a cost: specific information on financial literacy
women and men are less different in the propensity to invest in stocks when they are married and manage their finances cooperatively with their partner. Although available only for one country, this evidence hints at the possibility that the impact of social norms – the incremental gender effect – is more difficult to observe among the sub-population of married people.
Our analysis contributes to three research areas. First, we complement studies analyzing the financial choices of women and men (e.gMatsa and Miller,2013;Ahern and Dittmar,2012;
Weber and Zulehner,2010;Bernasek and Bajtelsmit,2002). Secondly, our multi-country study of European household surveys adds to the single-country approaches (e.g. Almenberg and Dreber,2015;Li,2014;van Rooij, Lusardi, and Alessie,2011;Bertocchi, Brunetti, and Torricelli,
2011; Arrondel, Pardo, and Oliver, 2010 and Sunden and Surette, 1998). We shed new light on the puzzle of gender-unequal investing in complex securities, like stocks, and what kind of role institutional country-specific factors play (Ashok and Spataro, 2015). By specifically focusing on the role of social norms, we also contribute to the ongoing debate about the role of cultural determinants on economic behavior (e.g. Breuer, Riesener, and Salzmann,2014,Guiso, Sapienza, and Zingales, 2006 and Hofstede, 1983). Furthermore, we complement the research on female self-selection into risky activities (e.g. Beck, Behr, and Guettler,2013), which rarely investigates social norms.
There are other studies analyzing the competitive or risk-taking behavior of women and men if exposed to societies with different prevailing gender roles. However, they use experimental data (e.g. Gneezy, Leonard, and List,2009) while we use survey data and focus specifically on the propensity to invest in stocks. Studying the link between asymmetric gender role prescriptions and investment behavior is particularly important because stock-market participation may have, in the long run, significant consequences for the distribution of wealth across genders.
The remainder of the paper is organized as follows. In the next section, we review the related literature. In Section 3, we describe the theoretical background and the econometric model. Section 4 provides an overview of the data used. In Section 5 and 6, we report the main results. Section 7 addresses the question of whether marriage makes a difference for the association between gender and the likelihood of stock market participation. Section8concludes and suggests areas for future research.
2
Literature review
The financial choices of women and men are attracting increased attention in the Finance and Management literatures. In investment decisions, Barber and Odean (2001) find that men trade much more than women, but perform worse. The authors infer from this result that men are overconfident. In corporate decisions,Weber and Zulehner(2010) reveal that start-ups with female first hires have a higher share of female workers at the end of the first year, are more successful and survive longer. Ahern and Dittmar (2012) show that the introduction of mandatory gender quotas for Norwegian company boards induced a significantly larger drop in stock prices and Tobin’s Q of those publicly traded firms that had fewer female board members before the announcement of the law; whileMatsa and Miller(2013) find evidence that the quota reform led to considerably fewer employee lay-offs.
Earlier than in corporate decision making, the issue of gender influence was tackled in the area of household finance. Focusing on US data,Bernasek and Shwiff (2001) show that women are involved in a household’s financial decisions. Jianakoplos and Bernasek(1998), Bajtelsmit, Bernasek, and Jianakoplos(1999) andAgnew, Balduzzi, and Sund´en(2003) find that portfolios of financial assets held by women seem to be generally less risky than portfolios held by men.
A possibly distinct attitude toward risk, either in stated preferences or in actual behavior, is the most prominent issue considered in the research on the financial choices of women and men. By and large, the findings convey a broadly uniform message that women are less willing to take financial risk than men, be it in the professional or household arenas. Among professional investors, Beckmann and Menkhoff (2008) find a higher self-reported risk aversion of female fund managers. Weber, Weber, and Nosiandcacute (2013) report a higher willingness to take risk for male UK online-brokerage customers during the financial crisis. For private individuals,
S¨ave-S¨oderbergh (2012) reveal that portfolio risk does not differ much between the women and men choosing less risky portfolios, while among the population holding portfolios with higher risk men take on significantly more risk than women. Furthermore, a number of experimental papers document systematic differences between women and men with respect to choices of risky gambles (seeCroson and Gneezy,2009andEckel and Grossman,2008for a comprehensive review of this literature).
toward risk into perspective or refute them altogether. In particular, Schubert et al. (1999) show that the contextual framing of experiments has a paramount effect on the risk propensity of women and men. When lotteries are framed as gains, men are more risk-loving than women; however, when lotteries are framed in terms of losses, then men are more risk-averse than women.
Dohmen et al.(2011) find – based on a representative survey of the German population (GSOEP) – that the gender gap in risk attitudes varies over the life cycle. The risk propensity of men decreases steadily with age; while women experience a sharp decline in risk propensity between their late teens and age thirty but then the propensity stabilizes until their mid-fifties, when it starts to decline further.
Both Johnson and Powell (1994) and Atkinson, Baird, and Frye (2003) document equal readiness of female and male professional fund managers to take risks. Berger, Kick, and Schaeck
(2014) argue that a higher proportion of women on the executive boards of banks is associated with a higher level of risk-taking, while Adams and Ragunathan(2015) emphasize that banks with more women on their boards do not appear to take fewer risks than banks with fewer females on their boards.
In searching for an explanation for this contradictory evidence, the literature is increasingly examining other channels, beyond risk preferences, that might determine the financial choices of women and men. Collective values and norms can be very powerful channels - after all, they shape individual behavior in various contexts (Carroll, Rhee, and Rhee, 1994;Fern´andez and Fogli, 2006; Giuliano, 2007; Christelis, Georgarakos, and Haliassos, 2013; Nguyen, 2011;
Van Staveren,2014; Breuer, Riesener, and Salzmann, 2014) and are, thus, likely to also affect the financial choices of women and men. Indeed, when studying the propensity for risk-taking by women and men in groups with different social background, Finucane et al. (2000) find that gender differences vary significantly across ethnic groups in the USA. Similar evidence is provided by Gneezy, Leonard, and List(2009) with experimental data. They compare women’s willingness to compete in two distinct societies – one society with a dominating patriarchal social norm and the other with a pronounced matriarchal organization. The results show that in the patriarchal society more men than women choose to compete, while in the matriarchal society more women than men are willing to compete. Booth and Nolen(2012) also confirm the crucial impact of the social environment. They show that girls from all-girl schools are as likely as boys from either coed or all-boy schools to choose a risky gamble, while girls from coed schools are
more risk-averse than boys. Similarly, Lindquist and S¨ave-S¨oderbergh (2011) show in a natural experiment that females are more risk-averse when assigned to a male-dominated group, than if they are in a mixed or female-only group. Black et al.(2015) provide evidence that risk-taking is, to a large extent, environmentally determined.
We contribute to the literature on the importance of social norms for women’s and men’s de-cision to take risk. Our research is closely related to studies on the determinants of stock market participation among women and men, including research on the role of gender-specific financial literacy in this decision (Lusardi and Mitchell, 2014;Lusardi, 2014; Dwyer, Gilkeson, and List,
2002;van Rooij, Lusardi, and Alessie,2011;Halko, Kaustia, and Alanko,2012;Almenberg and Dreber, 2015; Ashok and Spataro, 2015). Furthermore, our analysis is linked to the very few studies covering European households that analyze a potentially differential effect of marital status on women’s and men’s propensity to invest in stocks (Bertocchi, Brunetti, and Torricelli,
2011;Christiansen, Joensen Schrøter, and Rangvid,2010). A multi-country perspective is rarely taken in research on gender-specific stock market participation. Ashok and Spataro (2015) is an exception. While their specific sample of elderly people in nine European countries provides harmonized data, it lacks information on the individual risk preferences that are at the core of our multi-country study.
In sum, prior research gives some indication of the importance of social identity on economic choices. However, the existing literature falls short of linking social norms in different societies to women’s and men’s decision to invest in stocks and to disentangling the different channels affecting this decision. Tackling these research gaps is highly relevant given the importance of stock market investments for retirement savings, in particular if interest rates stay very low for longer periods.
3
Methodology
3.1 Theoretical background
Akerlof and Kranton(2000) suggest that an individual’s utility derived from an economic action depends on the individual’s personal identity. Identity is defined as one’s sense of self or self-image. If a person follows the prescriptions of social norms, she affirms her self-image and gains identity. When social prescriptions are violated, the individual loses identity. Hence, a
person experiences utility gains or losses depending on whether she (or he) acts in harmony or in disharmony with their socially prescribed behavior. The level of gender equality in a society mirrors the prescription for expected social behavior of women and men. A high degree of gender equality is associated with less asymmetric role expectations for women and men. Applied to the issue of investing in a portfolio of financial assets Akerlof and Kranton (2000)’s framework proposes that a highly risk-tolerant woman invests more risk-aversely than her self-declared risk preferences suggest when the surrounding society is non-supportive in the sense that it predominantly considers men as risk takers.2
The gender equality index indicates the degree of asymmetry between gender-specific social prescriptions at the country level. The higher the rank in the index, the lower the degree of asymmetry between women and men in that country. Therefore, we use the index to analyze whether a non-supportive environment – highly asymmetric gender roles prescriptions – in a specific country is associated with overly risk-averse female investment behavior. More precisely, we test the following hypothesis in our country-by-country analysis: All other things being equal, women refrain from investing in stocks more than men when the gender equality level in the home-country is low.
3.2 Econometric specification
To test this hypothesis we apply, to each country in our sample,3 the following probit regression model:
RiskAi = Λ(δ Genderi+ νZi+ β RiskT olerancei+ εi), (1)
2Male risk tolerance and overconfidence seem to be closely related in this context. Through experiments,
D’Acunto(2015) reveals that priming male identity induces men to take on more risk as it nurtures confidence in their own abilities and exaggerated optimism with respect to their own chances.
3
For a number of reasons, we chose estimation of country-by-country regressions instead of pooling data from all countries and estimating a multi-level model. Firstly, multilevel regression models are not applicable to our data. For these models to be valid, cross-country data must be harmonized and the country sample must be large enough (Bryan and Jenkins, 2016). The number of countries satisfying our data requirements is much smaller than the required sample size. The literature recommends a minimum of 10 to 50 countries depending on model specification (Centre for Multilevel Modelling,2011;Stegmueller,2013;Bryan and Jenkins,
2016). Secondly, the national survey data are insufficiently harmonized. In particular, measurement of risk attitudes differs substantially across surveys (see Table1). Thirdly, by pooling we would have forced the model parameters to be the same across countries, which is inconsistent with empirical evidence on national differences in financial behavior (seeGuiso et al.,2003).
where i represents individuals. RiskA is the probability of stock market participation. Gender is a dummy variable equal to one if the person is a man and zero if the person is a woman. Z is a vector of all observable socioeconomic variables, RiskT olerance represents (self-reported) individual risk preferences, ε is the idiosyncratic error term, and Λ is the cumulative density function of the normal distribution.
The key coefficient of interest is δ, which determines how Gender is associated with the prob-ability of holding stocks in a household’s financial portfolio in the country under consideration. According toAkerlof and Kranton(2000), substantially asymmetric gender role prescriptions in the home-country can dominate self-reported risk preferences. Therefore, the crucial question is in which country-regression Gender remains still significant when risk preferences are included in the probit regression.
4
Data
Identifying the incremental effect of gender requires household surveys that contain not just self-reported risk preferences, but also the type of assets that women and men hold in their investment portfolios. Household surveys from Austria, Italy, the Netherlands and Spain provide such data. We use waves from the years 2004 for Austria, Italy, the Netherlands and 2005 for Spain.4 The restriction to these years ensures that the later financial crisis does not influence results.
To account for the level of gender equality in a country, we use the World Economic Forum’s Gender Gap Index of 2006 (Hausmann, Tyson, and Zahidi,2006). This composite index reflects differences between women and men in the access to resources and opportunities for four domains of life: (i) economic participation and opportunity; (ii) educational attainment; (iii) political
4
empowerment; and (iv) health and survival.5,6
According to the Gender Gap Index 2006, Scandinavian countries ranked the best. Among the four countries considered here, Spain (11) and the Netherlands (12) hold the highest ranks. Austria’s position (27) is noticeably lower but still in the top-quarter of the index. In contrast, Italy is 77th out of 115 and is, therefore, significantly distant from the other three. In line with Italy’s low rank in the gender equality index,Alesina, Lotti, and Mistrulli(2013) point out that, ”Italy is toward the extreme in terms of viewing women in a traditional role.” When ranking the countries by individual sub-index (and not by the overall index), Italy exhibits the largest gender gap in the three out of four sub-indices: economic participation and opportunity, polit-ical empowerment, as well as health and survival. Interestingly, in the sub-index ”educational attainment” Italy has the best ranking, while the Netherlands performs the worst.
Turning to the household micro data used in the analysis, the Spanish and Dutch data are drawn directly from the countries’ representative national survey data sets, the Spanish Survey of Household Finances (EFF) Wave 2005, and the DNB Household Survey Wave 2004. Data for Austria and Italy are drawn from the Luxembourg Wealth Study (LWS) database.7 Hence, for each country we have a cross-sectional data set with the household as the unit of observation.
Due to data standardization in the LWS, the Austrian and Italian data sets provide income
5
The Gender Gap Index is a proven source of useful information for gender-related research. For instance,
Guiso et al. (2008) employ the index to investigate whether the degree of sexism in 40 countries relates to cross-country variation in the gender gap in math scores. They find that the gender gap disappears in more gender-equal societies. A related study by Carden´as et al. (2011) finds boys to be more risk-prone than girls in Sweden and Columbia; however, the gender gap is smaller in the more gender-egalitarian Sweden. Gender equality in each of the four domains of life is quantified based on a number of dimensions that are combined into four sub-indices, respectively. For example, in the subindex ”economic participation and opportunity,” five dimensions are considered: (1) labor force participation; (2) wage equality for similar work; (3) earned income; (4) ratio of female legislators, senior officials and managers over male; and (5) ratio of female professional and technical workers over male. Individual dimensions are weighted in a way such that each dimension has the same relative impact on the respective sub-index.
6
The original methodology of the Gender Gap Index 2005 was criticized for including certain dimensions that are only relevant for women, for instance the number of years a woman has been head of the state and the female fertility rate (see Beneria and Permanyer,2010). The revised index of 2006 – which we refer to in our analysis – improves on these limitations. All dimensions of gender inequality of the Gender Gap Index 2006 reflect the relative position of women compared to men. Although criticizing particular dimensions of GGI 2005,Beneria and Permanyer(2010) argue in favor of composite gender equality indicators. Alternative measures of gender inequality available so far (e.g. UNDP’s Gender-related Development Index and the Gender Empowerment Measure) exhibit substantial limitations that make them inappropriate for the purpose of our analysis. Specifically, as argued by
Beneria and Permanyer(2010), the UNDP’s Gender-related Development Index and the Gender Empowerment Measure do not measure the gender inequality per se, but the absolute level of development of a given county corrected by the gender gaps in selected domains of life.
7
The original data were collected in the Austrian Survey of Household Financial Wealth Wave 2004 and the Italian Survey of Household Income and Wealth (SHIW) Wave 2004. For details about the surveys, seeBeer et al.
(2006) (Austrian survey),Van Els, Van den End, and Van Rooij(2005) (Dutch survey), Bover(2008) (Spanish survey) andFaiella et al.(2006) (Italian survey).
and wealth information for the entire household, but not for individual household members. The Spanish survey collects information about real and financial assets at the household level, while data on income is available at the level of individual household members. The Dutch survey collects all information items at the individual level. We calculate total household income for Spain and the Netherlands by summing the incomes across household members. The same method is used to calculate households’ asset holdings for the Netherlands. The Dutch survey asks two additional questions about who decides on financial issues within couples. We exploit this information when exploring the impact of marital status during sensitivity checks (Section
7).
Individual specific characteristics like age, education, self-employment, and risk attitudes are reported for the household member who is primary responsible for the financial decisions of the entire household. We resort to the definition of the decision maker to identify the person who determines the household’s financial portfolio. In the Austrian survey, the decision maker is defined as the self-declared household head or the household member who has the most accurate knowledge about household finances. The Italian survey considers the household member who declares her- or himself to be primarily responsible for the household budget to be the decision maker. In the Netherlands, the decision maker is the person who declares having the greatest influence on the financial decisions of the household, and in the Spanish survey the person who mainly deals with the financial issues is the decision maker. With these definitions, 36 % of the decision makers are women in Austria, 39 % in Italy, 48 % in the Netherlands and 41 % in Spain.
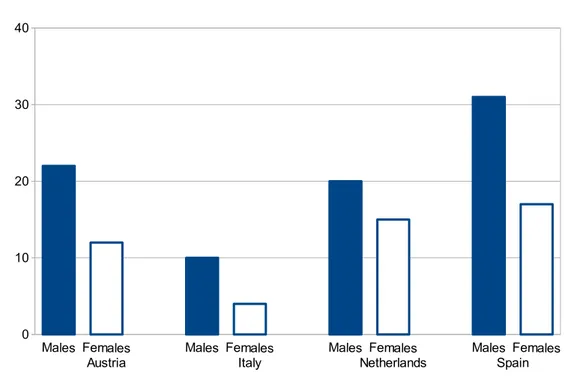
To describe the investment behavior of female and male decision makers, we calculate the proportion of those who hold risky financial assets in their portfolios. In our study, risky financial assets comprise only directly held stocks in both listed and unlisted companies.8 The proportion of decision makers who hold stocks differs not just between women and men, but
8
We use the terms stocks and risky financial assets synonymously in the remainder of the paper. Ignoring other financial securities, such as bonds, should not be critical as the participation and the share of these instruments in household portfolios is generally small (Guiso and Sodini,2012). We are unable to include stock ownership through mutual funds because the asset composition of mutual funds is not observed (the surveys ask only generally about the ownership of the funds but not about their composition). Although mutual funds are wide-spread among households (Guiso, Haliassos, and Jappelli,2002;Guiso and Sodini,2012) and, hence, neglecting them could lead to an underestimation of stockholding in the population overall, we are confident that we are not underestimating the riskiness of females portfolios more than that of male ones. Among others, Christelis, Georgarakos, and Haliassos(2011) find that the probability of holding stocks in mutual funds, given that the household owns any mutual funds at all, does not differ between single women and single men.
also across countries (see Figure1). The common, and statistically significant pattern according to a two-sided T-test, is that men are more likely to invest in stocks than women.
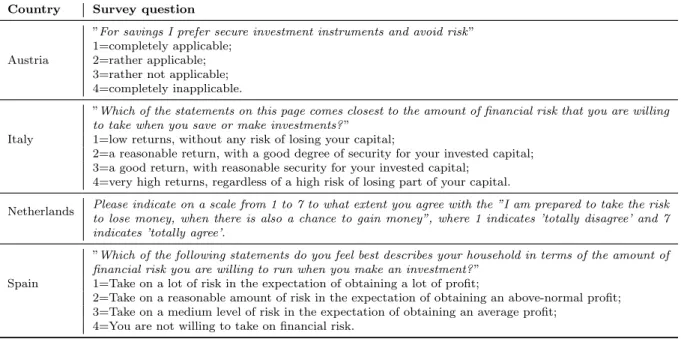
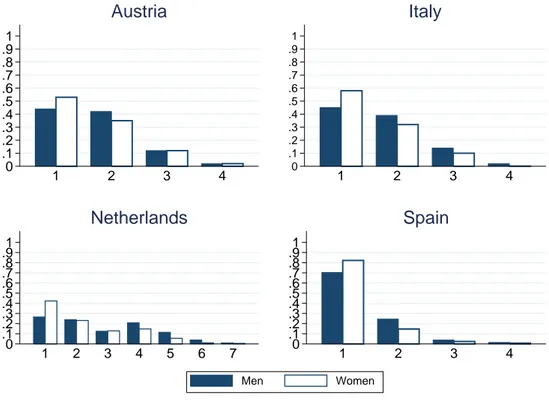
Individual risk preferences are a further crucial piece of our framework. This information is obtained in household surveys by asking the respondents to provide an assessment of their willingness to take financial risks (see Table 1 in the Appendix). The Dutch survey applies a 7-point scale, while the Austrian, Italian and Spanish surveys use a less detailed 4-point scale.9 Based on the original categorization of risk preferences, we generate a set of dummy variables Risk T olerance j with j = [1, 4] for Austria, Italy and Spain and j = [1, 7] for the Netherlands.10 A higher value of j corresponds to a greater willingness of individual i to take risk and, therefore, indicates a higher risk tolerance.
Figure 2 presents the country-specific distribution of women and men by self-reported tol-erance toward financial risk. In all countries, women clearly outnumber men in the group with the lowest risk tolerance. According to a two-sided T-test, differences are statistically significant at the 1% level. At higher levels of risk tolerance (j ≥ 2), the proportion of men exceeds the proportion of women, although the differences are not statistically significant.
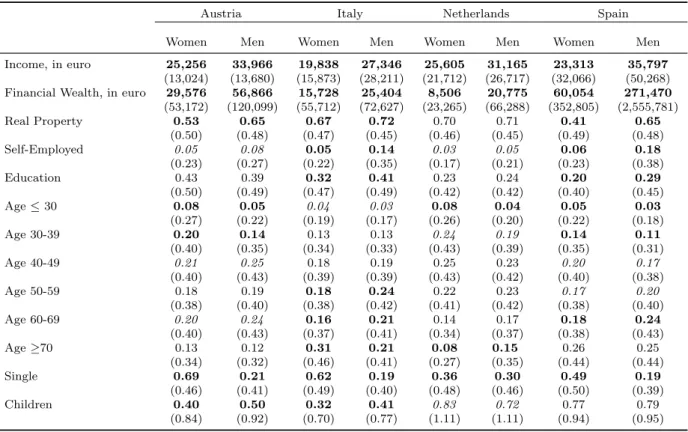
The remaining explanatory variables in both models are chosen in line with the existing literature on the role of household characteristics in the portfolio decisions (e.g. Guiso, Haliassos, and Jappelli, 2002). In particular, we control for the decision maker’s age, education, marital, and employment status as well as for the household’s income, financial wealth, ownership of real property, and number of children. The descriptive statistics are summarized in Table 2
by gender of the decision makers. In all countries, households with a male decision maker have higher incomes and financial wealth, more often own residential property, are older, and less frequently single than households with a female decision maker. The percentage of self-employed individuals is higher throughout the sample and, with the exception of Austria, men are better educated.
9
The Italian data set is characterized by a high rate of non-response to the question regarding the willingness to take financial risk. Non-responding individuals are excluded from the data set, which leads to a significant reduction of the sample. In order to see whether the decision to report risk attitude is influenced by gender, we fit the data to a probit regression model. The dependent variable is an indicator variable equal to 1 if risk attitude is reported and 0 if not. Our results show that the probability of non-response is independent of gender. However, the sub-set of individuals who provide information on their risk attitudes is wealthier and, therefore, more homogeneous with respect to financial resources than the overall population. This greater homogeneity in the Italian sample could bias our results toward finding no gender effects but not toward the contrary.
10For Spain, we reverse the scale in order to allow higher values to express greater subjective willingness to take
5
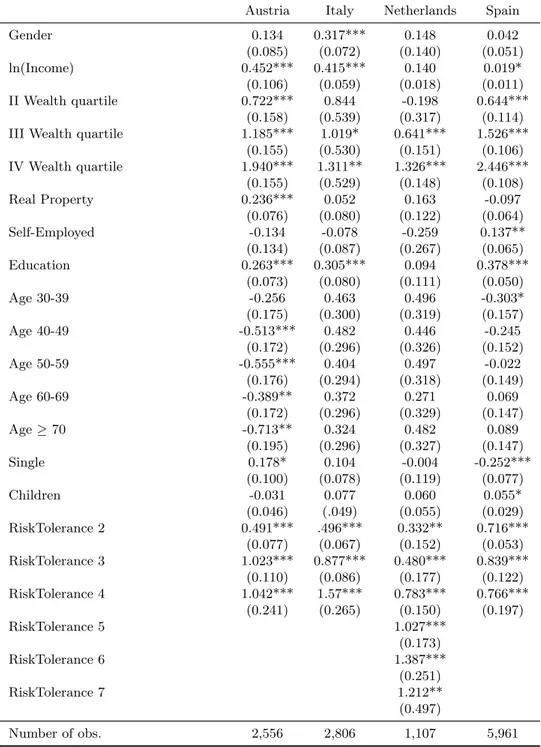
Results
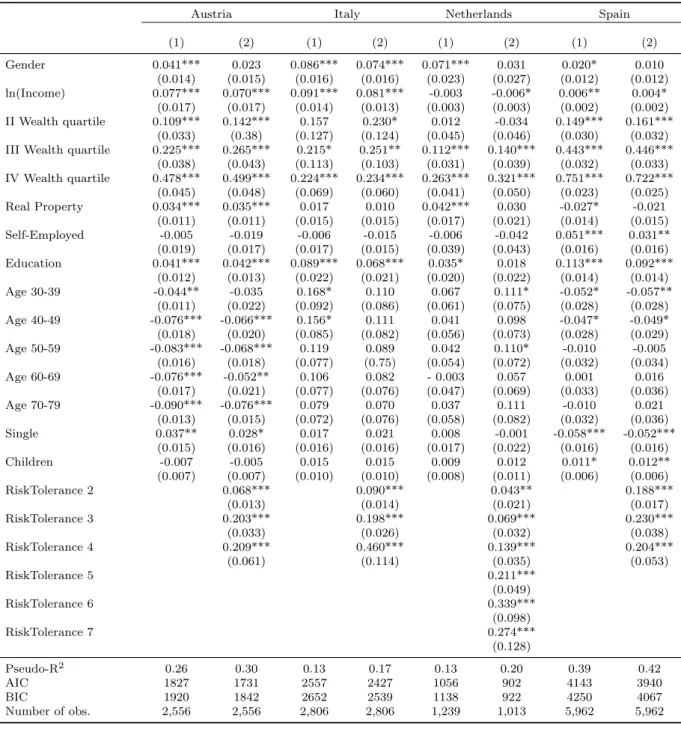
Table 3 presents our main results. Column (1) displays the specification that, ceteris paribus, explains stock market participation exclusively by gender while in Column (2) risk tolerance levels are also included. In Column (1) the expected result appears. The coefficient on the dummy variable Gender is positive and statistically significant for all four countries. However, the picture changes in Column (2). After RiskTolerance is included, Gender loses statistical sig-nificance in all countries except Italy. Hence, all other things being equal, our model predicts for Austria, the Netherlands and Spain that men and women invest in stocks with equal probability when the risk tolerance is controlled for. These three countries are ranked in the top-quarter of the gender equality index. In contrast, Italy, the country where Gender remains statistically and economically significant, is in the bottom third of the index. More precisely, an Italian man is, on average, almost 8 percent more likely to invest in stocks than an Italian woman with the same risk tolerance level.
These findings are consistent with the interpretation that prescribed gender norms are related to financial risk-taking. Since risk tolerance is controlled for in the regression, the predicted equal probability of stock market participation of women and men in Spain, the Netherlands, and Austria implies that the differences between gender role expectations in these countries are too small to dominate risk preferences. In contrast, the highly asymmetric gender roles in Italy seem to generate a conflict between personal risk preferences and the social identity of women and men to which women respond with overly risk-averse investment behavior.
One possible explanation for this finding is that in highly gender asymmetric societies women have insufficient opportunities to learn and acquire knowledge about, and familiarity with, stock markets through social interactions. Less access to talking circles where men share knowledge with family members and friends may make women feel less financially literate and less comfort-able with stock markets, even if they possess similar risk tolerance. The importance of having access to such social interactions is pointed out byDuflo and Saez (2002) and Li(2014). Duflo and Saez (2002) provide evidence that information acquired from colleagues increased partici-pation in retirement plans. Li (2014) shows that household members are more likely to invest in stock markets if their parents or children had entered the stock market during the previous five years. He argues that sharing investment knowledge and experience among family members
is instrumental to inducing investment in stocks by previous nonparticipants. Accordingly, the impact of social norms on women’s and men’s decision to invest in stocks may, at least in parts, be mediated via lower levels of financial literacy and self-confidence of women caused by a lack of access to social interactions that foster acquisition and sharing of financial knowledge.
Although the financial control variables often have the expected signs, some notable differ-ences appear across countries. Similar to the findings of other studies on stock market partici-pation (see e.g. Arrondel, Pardo, and Oliver,2010), being very wealthy increases the likelihood to participate in the stock market in all four countries. Income also increases the propensity of investing in stocks with the exception of Dutch women and men. Real property is only a significant predictor in case of Austria. In addition, the education variable, which may at least partly reflect the financial literacy, positively impacts the propensity of investing in all countries except the Netherlands. There, Education loses its significance when risk tolerance measures are included. With the exception of Spain, higher income uncertainty indicated by the variable Self-Employment does not affect the decision to participate.
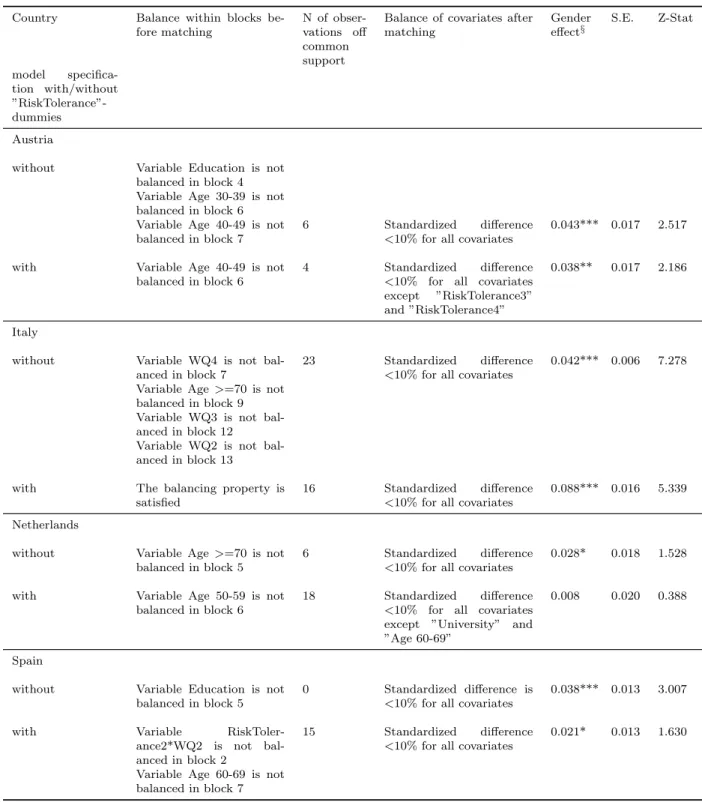
To test the robustness of the findings with respect to the substantial dissimilarities between the households with a female or male decision maker, we use a Heckman’s difference-in-difference matching estimation within each country (seeHeckman, Ichimura, and Todd, 1998; Smith and Todd, 2005).11 Table 4 summarizes the main results of the matching analysis and the balance diagnostics. Overall, the results of the propensity score matching analysis are in line with the initial estimation results. The estimated gender effect is the smallest in economic terms in the Netherlands and Spain, while after taking risk tolerance into account it becomes statistically insignificant for the Netherlands and only weakly significant for Spain, but remains statistically and economically highly significant for Austria and Italy.
We perform a number of additional estimations specifically to further elaborate on the Italian
11
Specifically, we estimate the effect of gender using only the sample of matched households, that is, households that differ only with respect to the gender of the decision maker, but are similar with respect to all other covariates important for the investment decision. We tested the balancing properties and dropped the ”off-support” observations that could not be matched. In order to achieve a satisfactory level of balance in the propensity scores, we adjusted the specification of the initial regression equation. In particular, we replaced the continuous variable lnIncome with dummy variables representing the quartiles of income distribution. Following the recent literature on propensity score matching (seeGarrido et al.,2014;Brookhart et al.,2006;Austin,2011;
Caliendo and Kopeinig,2008;Imbens,2004;Ho et al.,2007), we then dropped two variables that are associated with gender but seem to have no effect on investment decisions: Single and Nchildren. Furthermore, to reduce
the number of unbalanced covariates for Spain, we also include interaction terms of risk tolerance dummies with all other dummy variables, except Self-Employed, and an interaction term between Age 30-39 and Education. To determine the weights of matched observations, we used kernel matching.
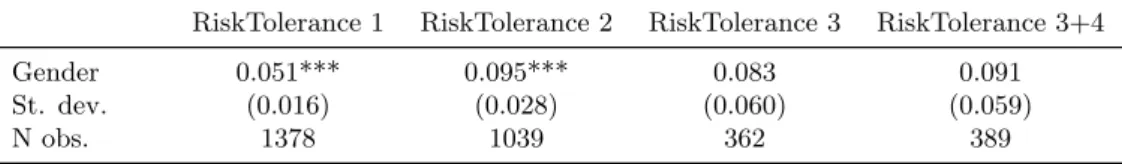
case. Firstly, we test whether the effect of gender is specific to particular classes of risk tolerance. To this end, we group the observations into four sub-samples: the first includes households with the lowest degree of risk tolerance (j = 1), the second includes those with a risk tolerance level of j = 2, the third sub-sample includes households with level j = 3, while the fourth sub-sample consists of households with risk tolerance levels of either j = 3 or j = 4. We do not create a specific sub-sample of observations with only the highest risk tolerance level, j = 4, as the size of this group is very small and a regression analysis is not feasible. We then run a probit regression for each of the four sub-samples separately. The estimated marginal effects of the dummy variable Gender are reported in Table 5. Gender has a significant effect on the probability of holding risky financial assets in the two sub-samples with low risk tolerance. In the sub-samples with higher risk tolerance, women and men are equally likely to invest in risky assets. Thus, the incremental gender effect obtained in the earlier regression, in which risk tolerance groups were pooled together, is driven by the distinct behavior of women and men with low risk tolerance. This result may imply that, compared to men, the conflict between a decision to hold risky assets and the social identity of a woman is particularly strong within the groups in which taking risks is unpopular anyway.
Apart from risk tolerance, the gender effect may also vary with the level of income. We expect the strongest effect among investors with higher incomes. In the presence of high fixed costs for stock market participation (e.g. high fixed fees for brokerage), women and men with low incomes are equally prevented from holding stocks regardless of their individual preferences or social norms. Thus, in the low income group, gender differences in the propensity to acquire stocks may not be seen, even if they exist, meaning that the gender effect in the sub-sample of the low-income investors will be small or insignificant. In the high income group, on the other hand, fixed costs should not matter (e.g. Arrondel, Pardo, and Oliver, 2010) and investors’ decisions should be affected only by social norms and their own preferences. In this case, gender differences, if they exist, will show up in the estimations leading to a strong gender effect.
In order to evaluate this conjecture, we focus on Italian households reporting low risk tol-erance (i.e. risk toltol-erance levels j = [1, 2]). Within this group, we construct four sub-samples of households that belong to different income classes. The first sub-sample includes households whose income falls into the 1st quartile of the sample distribution; the second, third and fourth sub-samples include those households whose income falls into the 2nd, 3rd and 4th quartiles
of the distribution, respectively. The results of applying equation (1) to each income class are reported in Table6. As expected, gender does not affect the probability of holding risky assets in the group with the lowest income. Among the households with higher incomes, the effect of gender on the probability of investing in risky financial assets is significant in all three income classes, with the largest effect among the households in the upper two income quartiles. Hence, despite similar financial resources and similar risk tolerance, women and men behave differently. This finding rules out income differences as an explanation for the observed incremental effect of gender in Italy and supportsAkerlof and Kranton (2000)’s social identity hypothesis.
6
Self-selection
Empirical findings for specific sub-populations, such as investment fund managers, entrepreneurs, and loan officers, indicate that self-selection renders the magnitude of risk-taking differences between women and men insignificant (seeJohnson and Powell,1994,Atkinson, Baird, and Frye,
2003, Beckmann and Menkhoff, 2008, Caliendo and Kritikos,2010, Beck, Behr, and Guettler,
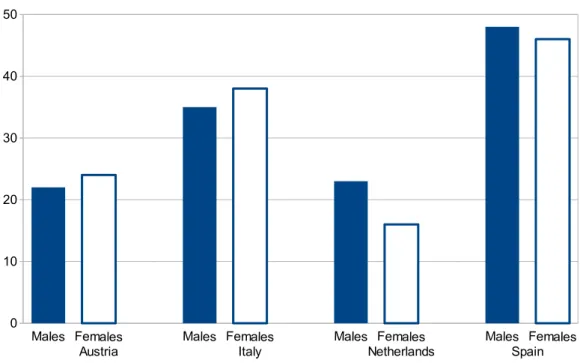
2013, and Niessen-Ruenzi and Ruenzi, 2015). Adams and Ragunathan (2015) find that listed banks with more female directors engaged in the same number of risk-taking activities around the crisis and did not have lower risk than other banks. Once individuals decide to join a risky occupation – having self-selected into such an occupation – the gender differences in actual risk-taking vanish. Such a mechanism may also work when individuals invest in financial assets. In order to analyze whether self-selection matters for identifying gender differences in fi-nancial portfolios, we limit our attention to the portfolio share of stocks once individuals have decided to invest in them. If self-selection occurs, then this share should not differ significantly between women and men. We are specifically interested in the Italian case since the role of self-selection in an environment that predominantly considers men as risk takers is not yet clar-ified. Figure 3 illustrates that no clear gender difference in the portfolio share of risky assets appears in the four countries under consideration. In Austria and Italy, women even seem to hold, on average, a bigger share of their portfolio in stocks than men, although this difference is not statistically significant.
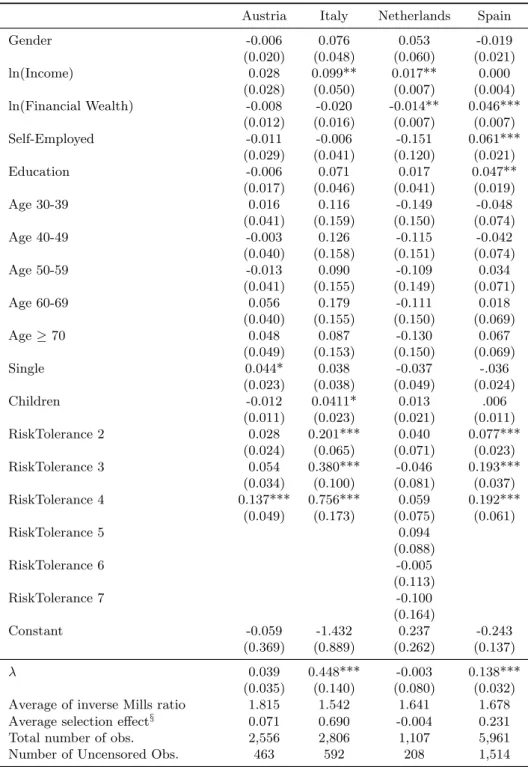
We use Heckman’s two-stage estimation procedure to test for the hypothesis of self-selection. The first-stage regression corresponds to the previous analysis (see Table3). In the second-stage
regression, wealth enters as a set of dummies indicating the 1st, 2nd, 3rd, and 4th quartiles of the sample distribution. In addition, we exclude the dummy variable Real P roperty from the equation. This adjustment is necessary in order to enable identification of the model.
Tables 7 and Table 8 report the results for the first-stage and the second-stage equations, respectively. For brevity, we focus on the results for the second-stage equation. Across all countries, the coefficient of Gender is not statistically different from zero in all specifications. These results show that once individuals have decided to invest in stocks, presumably because they feel sufficiently financially literate and self-confident to do so, the portfolio share of risky assets is not associated with gender. Women appear to self-select into ownership of risky assets independently of the gender equality regime in a country. We infer from these findings, that at least in the area of financial portfolio decisions, the outcome of self-selection is not linked to the level of gender equality in the home country.
Other observable characteristics have little effect on the share of stocks in portfolios. Fi-nancial wealth only has a positive and significant effect in Spain. The degree of risk tolerance remains a significant predictor of the size of the investment in risky stocks in all countries ex-cept the Netherlands. Weak explanatory power of the included variables is not surprising, even when they have affected the likelihood of participating in the stock market. Some factors that determine the participation decision are irrelevant for the decision about the share of stocks in the portfolio. For example, information costs may prevent individuals with low income and low education from participating in the markets for risky financial assets. However, once information is acquired, information costs should no longer play a role for the magnitude of investment.
It should be noted that the results reported in Table8also show that the estimated selection coefficient λ is positive in Austria, Italy, and Spain, thus indicating a positive correlation between the unobservable factors that determine the decision to hold risky assets and the unobservable factors that determine the risky assets’ portion in the portfolio. However, the selection effect is only statistically significant for Italy and Spain. Hence, there is no evidence of correlation between the two stages of the portfolio decision through unobservable factors in Austria and the Netherlands.12
In contrast, for Italy and Spain the unobservable factors in the selection equation positively
12The absence of the selection effect indicates that the two-stage estimation procedure is not necessarily required.
Estimation of a Tobit- and an OLS-regression for these countries produced similar results with respect to the gender effect. The results are available from the authors upon request.
affect the second stage results. To see by how much the conditional portfolio share of risky assets shifts up in these two countries due to the selection effect, we compute the average selection effect. The obtained numbers suggest that the average household that invests in risky assets, allocates a larger portion of the portfolio in these assets – by 23 percentage points larger in Spain and by 69 percentage points larger in Italy – than the average household in the population at large.
7
Sensitivity check with marital status
We split our sample country-by-country based on the individual’s marital status in order to study the association between a country’s level of asymmetry in gender role prescriptions and the effect of being single or married on the probability of investing in risky assets. For brevity, we only consider the participation decision. The results of applying Regression (1) to the sub-sample of singles (not reported here) are in line with our previous findings. The gender of Dutch, Spanish, and Austrian singles is only significant without risk tolerance levels, but significance vanishes if risk tolerance dummies are included. In contrast, Italian singles’ gender remains significant with risk tolerance levels included, indicating that the investments of single Italian women are overly risk-averse compared to their self-reported risk preferences.13 In sum, the issue of social identity seems to affect the asset holdings of female and male singles in the same way as it affects the portfolios of women and men in the population at large.
In a second step, we study how gender is associated with investing in stocks in the sub-sample of couples. This exercise requires distinguishing between couples with individual financial decision making and those who manage their investment portfolio cooperatively. The necessary detailed information is only available in the Dutch survey (see Table9 in the Appendix). This is why the following analysis is restricted to only the Dutch sample.
As expected, applying regression model (1) to the sub-sample of Dutch couples with a well-defined single decision maker confirms the previous results for the entire Dutch sample. When the risk tolerance level is accounted for, the gender variable loses its significance. As mentioned above, in the gender equality index, the Netherlands is ranked second-highest of the four con-sidered countries. Thus, the finding is consistent with the interpretation that a low degree of
13
We do not present the detailed estimation results. The interested reader is referred to the discussion paper
asymmetry in gender role prescriptions dampens gender differences in financial risk-taking. Two-thirds of the Dutch couples report pooling their money completely or to a large extent and deciding cooperatively how the money is invested. This is comparable to the share of US-couples with joint decision making, as reported in Bernasek and Bajtelsmit(2002). The probit estimation for the sub-sample of these Dutch couples is reported in Table 10. Simply including the indicators for both partners’ level of risk tolerance into the probit regression (1) may lead to multi-collinearity problems.14 Therefore, a set of dummies indicating the level of risk tolerance of one spouse (reference person), and a variable Diff. Risk Preference are constructed. Diff. Risk Preference is defined as the difference in the level of risk tolerance between both partners. A statistically significant positive value of Diff. Risk Preference means that the partner is more risk-averse than the spouse who is the reference person.
Bernasek and Bajtelsmit(2002) propose that a woman’s influence on the household’s financial decision making increases, as her share in the household’s income increases and as her formal level of financial education increases. Yilmazer and Lich(2015) find that the financial portfolio decisions in US-households with two persons depend on the risk preferences of the partner with more bargaining power. They consider the spouse with the best knowledge about family finances, or, alternatively, with the largest income, as the household member with the most bargaining power. In order to account for distinct sources of partners’ bargaining power, we test two specifications, one in which the Gender variable refers to the person who declares having the greatest influence on the financial decisions and one in which Gender refers to the main earner as reference person.
As expected, greater risk tolerance of the reference person (household head in column (2) and main earner in column (4) of Table 10) is associated with a higher probability of holding risky financial assets. However, the coefficient of the variable Diff. Risk Preference is negative and statistically significant in both specifications. This finding reveals that the couples’ asset portfolio is the result of a risk-taking compromise.15 Compared to a situation in which both partners have equal risk tolerance levels, the probability of holding risky assets in the household portfolio shrinks if the partner has a lower risk tolerance level than the spouse who is the
14
The coefficient of the correlation between the risk preferences of spouses in our sample is 30% and is statisti-cally significant.
15The finding is consistent withChristiansen, Joensen Schrøter, and Rangvid(2010), who provide evidence that
marriage induces a kind of risk compromise compared to the single state. Men reduce their portfolio risk while women increase their portfolio risk.
reference person. More precisely, a partner with one level lower risk tolerance than the reference person decreases the probability of risky assets in the household portfolio by 4 percent if the reference person is defined as household head. When the reference person is defined as the main earner, the reduction is about 3 percent.
As before, the coefficient of Gender does not differ statistically from zero in either specifica-tion. Neither the gender of the household head nor the gender of the main earner is associated with the risk-taking propensity of Dutch couples engaging in cooperative decision making. To summarize, the findings based on Dutch couples also yield results that are consistent with the notion that the asymmetry of gender role prescriptions in the highly ranked Netherlands is too small to dominate the impact of risk tolerance levels.
8
Conclusions
This study investigates the association of gender and stock market participation in four European societies with distinct social norms. We use household-level financial data from national surveys of Austria, Italy, the Netherlands, and Spain. We find that in Italy – the country with highly asymmetric gender role prescriptions according to the gender equality index – women are more likely to make investments that are overly risk-averse compared with their self-reported risk tolerance levels. In the three countries with a lower asymmetry in gender role prescriptions, women do not excessively refrain from investing in stocks. These results appear for singles and couples.
Our findings are consistent with the interpretation that female investment behavior is shaped by gender role prescriptions. If the social environment is non-supportive, in the sense that the society considers financial risk-taking as a male domain, women respond with exaggerated backing off from risk in their asset portfolios. In contrast, they invest in accordance with their self-perceived risk tolerance levels when societies are more gender-equal. In addition, we find that the share of risky assets in the portfolios is independent of gender in all four countries. This evidence suggests that self-selection occurs in financial risk-taking independently of whether the home-country’s society is supportive of female risk-taking or not.
The revealed association between the level of gender equality and the participation of women in the stock market can be helpful for the political efforts aimed at increasing stockholding among
households. While more efforts directed at enhancing financial literacy and familiarity in dealing with stocks in the population as a whole are helpful, a reduction in a country’s gender inequality can increase the likelihood that its residents will invest in the stock market. Policies specifically targeted at alleviating gender disparities in various domains of life should be implemented. In particular, measures aimed at improving the opportunities for women’s economic participation (e.g. professional advancement, reconciliation of career and family life) should be considered. Another important implication appears with regard to financial advice. Our results speak clearly against the simplistic approach of using an individual’s gender as a predictor for the propensity of financial risk-taking and, thus, providing gender-specific financial advice. Rather, financial advice needs to be based on individual risk preferences, planning horizon, and financial situation, while abstaining from stereotypical beliefs about a “typical” woman or man.
While our study provides evidence in favor of the social identity channel, further analysis is needed to test more explicitly the effect of social norms. One promising approach would be to test the effect of a measure of gender inequality in a cross-country setting based on a pooled-country (multi-level) estimation approach (see e.g. Bryan and Jenkins,2016). However, such analysis will only be appropriate when harmonized micro data are available for a larger number of countries. In future research, it is also important to examine the role of social norms and financial literacy for women’s and men’s propensity to invest in stocks in a cross-country setting. Last, but not least, further investigation of whether a supportive or non-supportive environment shapes self-confidence in financial risk-taking beyond subjective risk preferences is needed. Filling the above-mentioned research gaps requires representative and harmonized survey data comprising additional specific information on factors that influence respondents’ financial decision making, such as the investors’ financial literacy, level of self-confidence and whether friends or relatives hold risky assets.
References
Adams, Renee B., and Vanitha Ragunathan. 2015. Lehman Sisters. FIRN research paper. Fi-nancial Research Network. http://ssrn.com/abstract=2380036.
Agnew, Julie, Pierluigi Balduzzi, and Annika Sund´en. 2003. “Portfolio Choice and Trading in a Large 401(k) Plan.” American Economic Review 93 (1): 193–215.
Ahern, Kenneth R., and Amy K. Dittmar. 2012. “The Changing of the Boards: The Impact on Firm Valuation of Mandated Female Board Representation.” The Quarterly Journal of Economics 127 (1): 137–197.
Akerlof, George A., and Rachel E. Kranton. 2000. “Economics and Identity.” The Quarterly Journal of Economics 115 (3): 715–753.
Alesina, Alberto F., Francesca Lotti, and Paolo Emilio Mistrulli. 2013. “Do Women Pay More For Credit? Evidence From Italy.” Journal of the European Economic Association 11: 45–66. Almenberg, Johan, and Anna Dreber. 2015. “Gender, Stock Market Participation and Financial
Literacy.” Economics Letters 137: 140 – 142.
Arrondel, Luc, Hector Calvo Pardo, and Xisco Oliver. 2010. “Temperance in Stock Market Participation: Evidence from France.” Economica 77 (306): 314–333.
Ashok, Thomas, and Luca Spataro. 2015. Financial Literacy, Human Capital and Stock Market Participation in Europe: An Empirical Exercise under Endogenous Framework. Discussion papers. Dipartimento di Economia e Management (DEM), University of Pisa, Pisa, Italy. http://EconPapers.repec.org/RePEc:pie:dsedps:2015/194.
Atkinson, Stanley M., Samantha Boyce Baird, and Melissa B. Frye. 2003. “Do Female Mutual Fund Managers Manage Differently?” Journal of Financial Research 26 (1): 1–18.
Austin, Peter C. 2011. “A Tutorial and Case Study in Propensity Score Analysis: An Appli-cation to Estimating the Effect of In-hospital Smoking Cessation Counseling on Mortality.” Multivariate Behavioral Research 46 (1): 119–151.
Bajtelsmit, Vickie L., Alexandra Bernasek, and Nancy A. Jianakoplos. 1999. “Gender Differences in Defined Contribution Pension Decisions.” Financial Services Review 8 (1): 1–10.
Barasinska, Nataliya, and Dorothea Sch¨afer. 2013. Is the Willingness to Take Financial Risk a Sex-linked Trait? Evidence from National Surveys of Household Finance. Discussion paper. Deutsche Bundesbank.
Barber, Brad M., and Terrance Odean. 2001. “Boys Will Be Boys: Gender, Overconfidence, and Common Stock Investment.” The Quarterly Journal of Economics 116 (1): 261–292.
Beck, Thorsten, Patrick Behr, and Andre Guettler. 2013. “Gender and Banking: Are Women Better Loan Officers?” Review of Finance 17 (4): 1279–1321.
Beckmann, Daniela, and Lukas Menkhoff. 2008. “Will Women Be Women? Analyzing the Gen-der Difference among Financial Experts.” Kyklos 61 (3): 364–384.
Beer, Christian, Peter Mooslechner, Martin Sch¨urz, and Karin Wagner. 2006. “Financial Wealth Holdings of Austrian Private Households: Data Sources and Institutional Features.” Paper prepared for the Luxembourg Wealth Study Conference 14.
Beneria, Lourdes, and I˜naki Permanyer. 2010. “The Measurement of Socio-economic Gender Inequality Revisited.” Development and Change 41 (3): 375–399.
Berger, Allen N., Thomas Kick, and Klaus Schaeck. 2014. “Executive Board Composition and Bank Risk Taking.” Journal of Corporate Finance 28: 48 – 65.
Bernasek, Alexandra, and Vickie L. Bajtelsmit. 2002. “Predictors of Women’s Involvement in Household Financial Decision-Making.” Financial Counseling and Planning 13 (2).
Bertocchi, Graziella, Marianna Brunetti, and Costanza Torricelli. 2011. “Marriage and other Risky Assets: A Portfolio Approach.” Journal of Banking & Finance 35 (11): 2902 – 2915. Black, Sandra E., Paul J. Devereux, Petter Lundborg, and Kaveh Majlesi. 2015. On the Origins
of Risk-Taking. Working Paper 21332. National Bureau of Economic Research.
Booth, Alison, and Patrick Nolen. 2012. “Choosing to Compete: How Different are Girls and Boys?” Journal of Economic Behavior & Organization 81 (2): 542–555.
Bover, Olympia. 2008. “The Spanish Survey of Household Finances (EFF): Description and Methods of the 2005 Wave.” Banco de Espa˜na Documentos Ocasionales (0803).
Breuer, Wolfgang, Michael Riesener, and Astrid Juliane Salzmann. 2014. “Risk Aversion vs. Individualism: What Drives Risk Taking in Household Finance?” The European Journal of Finance 20 (5): 446–462.
Brookhart, M Alan, Sebastian Schneeweiss, Kenneth J Rothman, Robert J Glynn, Jerry Avorn, and Til St¨urmer. 2006. “Variable Selection for Propensity Score Models.” American Journal of Epidemiology 163 (12): 1149–1156.
Bryan, Mark L, and Stephen P Jenkins. 2016. “Multilevel Modelling of Country Effects: a Cautionary Tale.” European Sociological Review 32 (1): 3–22.
Caliendo, Marco, and Sabine Kopeinig. 2008. “Some Practical Guidance for the Implementation of Propensity Score Matching.” Journal of Economic Surveys 22 (1): 31–72.
Caliendo, Marco, and Alexander Kritikos. 2010. “Start-ups by the Unemployed: Characteristics, Survival and Direct Employment Effects.” Small Business Economics 35 (1): 71–92.
Carden´as, Juan-Camilo, Anna Dreber, Emma von Essen, and Eva Ranehill. 2011. “Gender Dif-ferences in Competitiveness and Risk Taking: Comparing Children in Colombia and Sweden.” Journal of Economic Behavior and Organization 83 (1): 11–23.
Carroll, Christopher D., Byung-Kun Rhee, and Changyong Rhee. 1994. “Are There Cultural Effects on Saving? Some Cross-Sectional Evidence.” The Quarterly Journal of Economics 109 (3): 685–699.
Centre for Multilevel Modelling. 2011. Sample Sizes for Multilevel Models. available from: http://www.bristol.ac.uk/cmm/learning/multilevel-models/samples.html [accessed: 3 Octo-ber 2016].
Christelis, Dimitris, Dimitris Georgarakos, and Michael Haliassos. 2011. “Stockholding: Partic-ipation, Location, and Spillovers.” Journal of Banking & Finance 35 (8): 1918–1930.
Christelis, Dimitris, Dimitris Georgarakos, and Michael Haliassos. 2013. “Differences in Portfo-lios across Countries: Economic Environment versus Household Characteristics.” The Review of Economics and Statistics 95 (1): 220–236.
Christiansen, Charlotte, Juanna Joensen Schrøter, and Jesper Rangvid. 2010. The Effects of Marriage and Divorce on Financial Investments: Learning to Love or Hate Risk? CRE-ATES Research Papers 2010-57. Department of Economics and Business Economics, Aarhus University.
Croson, Rachel, and Uri Gneezy. 2009. “Gender Differences in Preferences.” Journal of Economic Literature 47 (2): 448–74.
D’Acunto, Francesco. 2015. Identity, Overconfidence, and Investment Decisions. FIRN research paper. Financial Research Network. https://ssrn.com/abstract=2641182.
Dohmen, Thomas, Armin Falk, David Huffman, Uwe Sunde, J¨urgen Schupp, and Gert G. Wag-ner. 2011. “Individual Risk Attidudes: Measurement, Determinants, and Behavioral Conse-quences.” Journal of the European Economic Association 9 (3): 522–550.
Duflo, Esther, and Emmanuel Saez. 2002. “Participation and Investment Decisions in a Re-tirement Plan: The Influence of Colleagues’ Choices.” Journal of Public Economics 85 (1): 121–148.
Dwyer, Peggy D., James H. Gilkeson, and John List. 2002. “Gender Differences in Revealed Risk Taking: Evidence from Mutual Fund Investors.” Economics Letters 76 (2): 151–158. Eckel, Catherine C., and Philip J. Grossman. 2008. “Forecasting Risk Attitudes: An
Exper-imental Study using Actual and Forecast Gamble Choices.” Journal of Economic Behavior and Organization 68 (1): 1–17.
Faiella, Ivan, Romina Gambacorta, Stefano Iezzi, and Andrea Neri. 2006. “Household Income and Wealth in 2004.” Banca d’Italia Supplement to the Statistical Bulletin Nr 7, January. Fern´andez, Raquel, and Alessandra Fogli. 2006. “Fertility: The Role of Culture and Family
Experience.” Journal of the European Economic Association 4 (2-3): 552–561.
Finucane, Melissa L., Paul Slovic, C. K. Mertz, James Flynn, and Theresa A. Satterfield. 2000. “Gender, Race, and Perceived Risk: The White Male Effect.” Health, Risk and Society 2 (2): 159–172.
Garrido, Melissa M, Amy S Kelley, Julia Paris, Katherine Roza, Diane E Meier, R Sean Morrison, and Melissa D Aldridge. 2014. “Methods for Constructing and Assessing Propensity Scores.” Health Services Research 49 (5): 1701–1720.
Giuliano, Paola. 2007. “Living Arrangements in Western Europe: Does Cultural Origin Matter?” Journal of the European Economic Association 5 (5): 927–952.
Gneezy, Uri, Kenneth L. Leonard, and John A. List. 2009. “Gender Differences in Competition: Evidence From a Matrilineal and a Patriarchal Society.” Econometrica 77 (5): 1637–1664. Guiso, Luigi, Michael Haliassos, and Tullio Jappelli. 2002. Household Portfolios. Cambridge,
Massachusetts: The MIT Press.
Guiso, Luigi, Michael Haliassos, Tullio Jappelli, and Stijn Claessens. 2003. “Household Stock-holding in Europe: Where Do We Stand and Where Do We Go?” Economic Policy 18 (36): 125–170.
Guiso, Luigi, Ferdinando Monte, Paola Sapienza, and Luigi Zingales. 2008. “Culture, Gender, and Math.” Science 320 (5880): 1164–1165.
Guiso, Luigi, Paola Sapienza, and Luigi Zingales. 2006. “Does Culture Affect Economic Out-comes?” The Journal of Economic Perspectives 20 (2): 23–48.
Guiso, Luigi, and Paolo Sodini. 2012. Household Finance. An Emerging Field. Technical Report 1204. EIEF Working Papers Series.
Halko, Marja-Liisa, Markku Kaustia, and Elias Alanko. 2012. “The Gender Effect in Risky Asset Holdings.” Journal of Economic Behavior & Organization 83 (1): 66–81.
Hausmann, Ricardo, Laura Tyson, and Saadia Zahidi. 2006. The Global Gender Gap Report 2006. World Economic Forum.
Heckman, James J., Hidehiko Ichimura, and Petra Todd. 1998. “Matching as an Econometric Evaluation Estimator.” The Review of Economic Studies 65 (2): pp. 261–294.
Ho, Daniel E, Kosuke Imai, Gary King, and Elizabeth A Stuart. 2007. “Matching as Non-parametric Preprocessing for Reducing Model Dependence in Parametric Causal Inference.” Political Analysis 15 (3): 199–236.
Hofstede, Geert. 1983. “The Cultural Relativity of Organizational Practices and Theories.” Journal of International Business Studies 14 (2): 75–89.
Imbens, Guido W. 2004. “Nonparametric Estimation of Average Treatment Effects under Exo-geneity: A Review.” Review of Economics and Statistics 86 (1): 4–29.
Jianakoplos, Nancy Ammon, and Alexandra Bernasek. 1998. “Are Women More Risk Averse?” Economic Inquiry 36 (4): 620–30.
Johnson, J.E., and P.L. Powell. 1994. “Decision Making, Risk and Gender: Are Managers Dif-ferent?” British Journal of Management 5: 123–138.
Li, Geng. 2014. “Information Sharing and Stock Market Participation: Evidence from Extended Families.” The Review of Economics and Statistics 96 (1): 151–160.
Lindquist, Gabriella Sj¨ogren, and Jenny S¨ave-S¨oderbergh. 2011. “Girls will be Girls, especially among Boys: Risk-taking in the Daily Double on Jeopardy.” Economics Letters 112 (2): 158–160.
Lusardi, Annamaria. 2014. “Retirement Planning and Financial Literacy.” In International Handbook on Ageing and Public Policy, Chapters, Chap. 37, 474–490. Edward Elgar Pub-lishing.
Lusardi, Annamaria, and Olivia S. Mitchell. 2014. “The Economic Importance of Financial Literacy: Theory and Evidence.” Journal of Economic Literature 52 (1): 5–44.
Matsa, David A., and Amalia R. Miller. 2013. “A Female Style in Corporate Leadership? Evi-dence from Quotas.” American Economic Journal: Applied Economics 5 (3): 136–69.
Nguyen, Quang. 2011. “Does Nurture Matter: Theory and Experimental Investigation on the Ef-fect of Working Environment on Risk and Time Preferences.” Journal of Risk and Uncertainty 43 (3): 245–270.
Niessen-Ruenzi, Alexandra, and Stefan Ruenzi. 2015. Sex Matters: Gender Differences in the Mutual Fund Industry. Research paper. https://icare.hse.ru/data/2015/09/23/ 1075359264/Stefan.pdf.
S¨ave-S¨oderbergh, Jenny. 2012. “Self-Directed Pensions: Gender, Risk, and Portfolio Choices.” Scandinavian Journal of Economics 114 (3): 705–728.
Schubert, Renate, Martin Brown, Mattihias Gysler, and Hans Wolfgang Brachinger. 1999. “Fi-nancial Decision-Making: Are Women Really More Risk-Averse?” American Economic Re-view 89 (2): 381–385.
Smith, Jeffrey, and Petra Todd. 2005. “Does Matching Overcome LaLonde’s Critique of Nonex-perimental Estimators?” Journal of Econometrics 125 (1-2): 305–353.
Stegmueller, Daniel. 2013. “How Many Countries for Multilevel Modeling? A Comparison of Frequentist and Bayesian Approaches.” American Journal of Political Science 57 (3): 748– 761.
Sunden, Annika E., and Brian J. Surette. 1998. “Gender Differences in the Allocation of Assets in Retirement Savings Plans.” American Economic Review 88 (2): 207–11.
Van Els, Peter, Jan Willem Van den End, and Maarten Van Rooij. 2005. “Financial Behaviour of Dutch Households: Analysis of the DNB Household Survey.” BIS Papers 22: 21–40. van Rooij, Maarten, Annamaria Lusardi, and Rob Alessie. 2011. “Financial Literacy and Stock
Market Participation.” Journal of Financial Economics 101 (2): 449 – 472.
Van Staveren, Irene. 2014. “The Lehman Sisters Hypothesis.” Cambridge Journal of Economics 38 (5): 995–1014.
Weber, Andrea, and Christine Zulehner. 2010. “Female Hires and the Success of Start-Up Firms.” American Economic Review 100 (2): 358–61.
Weber, Martin, Elke U. Weber, and Alen Nosiandcacute. 2013. “Who takes Risks When and Why: Determinants of Changes in Investor Risk Taking.” Review of Finance 17 (3): 847–883. Yilmazer, Tansel, and Stephen Lich. 2015. “Portfolio Choice and Risk Attitudes: a Household
Appendix
Table 1: Survey questions about the attitude toward financial risks
Country Survey question
Austria
”For savings I prefer secure investment instruments and avoid risk ” 1=completely applicable;
2=rather applicable; 3=rather not applicable; 4=completely inapplicable.
Italy
”Which of the statements on this page comes closest to the amount of financial risk that you are willing to take when you save or make investments? ”
1=low returns, without any risk of losing your capital;
2=a reasonable return, with a good degree of security for your invested capital; 3=a good return, with reasonable security for your invested capital;
4=very high returns, regardless of a high risk of losing part of your capital.
Netherlands Please indicate on a scale from 1 to 7 to what extent you agree with the ”I am prepared to take the risk to lose money, when there is also a chance to gain money”, where 1 indicates ’totally disagree’ and 7 indicates ’totally agree’.
Spain
”Which of the following statements do you feel best describes your household in terms of the amount of financial risk you are willing to run when you make an investment? ”
1=Take on a lot of risk in the expectation of obtaining a lot of profit;
2=Take on a reasonable amount of risk in the expectation of obtaining an above-normal profit; 3=Take on a medium level of risk in the expectation of obtaining an average profit;
Figure 1: Proportion of women and men with stocks
Austria Italy Netherlands Spain
0 10 20 30 40
Figure 2: Distribution of individuals by the self-reported willingness to take financial risk (sub-jective risk tolerance)
0 .1 .2 .3 .4 .5 .6 .7 .8 .9 1 1 2 3 4
Austria
0 .1 .2 .3 .4 .5 .6 .7 .8 .9 1 1 2 3 4Italy
0 .1 .2 .3 .4 .5 .6 .7 .8 .91 1 2 3 4 5 6 7Netherlands
Men Women 0 .1 .2 .3 .4 .5 .6 .7 .8 .91 1 2 3 4Spain
Note: Each histogram shows country-specific distributions of women and men according to the self-reported risk tolerance. The degree of risk tolerance is measured on an ordinal scale with higher numbers corresponding to higher risk tolerance.
Figure 3: Average portfolio share of stocks for women and men
Austria Italy Netherlands Spain
0 10 20 30 40 50