Master Thesis in Business Administration
Title: The Impact of Corporate Social Responsibility (CSR) on Corporate Financial Performance (CFP) in the Listed Swedish Financial Institutions
Authors: Shatha Alkhalili and Victoria Namayanja
Tutor: Haoyong Zhou
Date: 2021-05-21
Key terms: Corporate Social Responsibility (CSR), Corporate Financial Performance (CFP), ESG disclosure, Sustainability.
Abstract
Given that Sweden is one of the most sustainable countries in the world (RobecoSAM, 2018), with a big number of its companies as active participants in CSR, we investigate the impact that these CSR activities could have on CFP with a focus on the Financial sector, using in 26 listed Financial Institutions. As we will find out from the existing literature, the CSR-CFP relationship is neither strictly negative nor positive. If it is positive, then the firm will allocate more resources to CSR to achieve better financial performance, and the firm may fore-go or approach CSR initiatives with caution if they affect CFP negatively. Past researchers have studied this relationship before and found that the reason why financial institutions get involved in socially responsible activities is to gain public trust and justification usually after a public financial scandal. So, we explore this further expecting that if it is indeed a matter of fact that these institutions gain the justification from the public that they so desire when they choose to get involved in socially responsible activities, then it should be that the public trust and justification would translate into improved financial performance. Therefore, the research question that we seek to answer is “Does Corporate Social Responsibility (CSR) have an Impact on Corporate Financial Performance (CFP) in the Listed Swedish Financial Institutions”
We examined the relationship between CSR and CFP using 26 Swedish financial institutions that are listed on Nasdaq Nordic stock exchange market (Stockholm) for the period between 2015 and 2019. The Fixed Effects Model regression analysis for panel data was used to test this relationship and we found that when Swedish financial institutions get involved in CSR, their financial performance is neither worsened or improved because of the insignificant ESG coefficients that we found. Swedish financial institutions' engagement in socially responsible activities does not guarantee an impact on their financial performance.
Table of Contents
Introduction 3
1.1 Background 3
1.2 Aim and Research Question 6
Literature Review 7
2.1 CSR Theories 7
2.2 CSR and Financial Performance 8
2.3 CSR in a National Context 11
2.4 CSR in Swedish Financial Institutions. 13
3. Methodology 17
3.1 Sample 17
3.2 Research Method: Quantitative Research Method 18
3.3 Models 18
3.3.1 Regression Model 18
3.3.2 Econometric Model 19
3.4 Measuring the variables 19
3.4.1 Financial Performance (Dependent Variable) 19 3.4.2 Corporate Social Responsibility (Independent Variable) 20
3.4.3 Control Variables 22
3.5 Hypothesis Testing and significance level 23
3.6 Data Collection 24
3.6.1 Literature review 24
3.6.2 Regression data 24
3.7 Reliability and validity 25
4. Results 26
4.1 Corporate Financial Performance (Dependent Variable) 26
4.2 Independent Variable and Control Variables 27
4.3 Correlation Matrices 28
4.4 Regression 29
4.4.1 Regression Results 29
Pooled OLS 30
Random effects Model 31
Fixed Effects Model 33
4.5 Interpretation of the Findings 34
5. Discussion 36
5.1 Theoretical Implication 37
6. Conclusion 40
6.1 Managerial Implications 40
6.2 Limitations of the study 41
6.3 Future Research 41
Reference list 42
1. Introduction
In this chapter we introduce the topic and provide definitions to the key concepts. We also provide a brief background to the study, highlight the purpose of the study and introduce the research gap and question that we seek to answer.
1.1 Background
Corporate Social Responsibility referred to as CSR hereafter, dates to the 1930’s with the social responsibilities of the private sector. In the 1950’s, Bowen (1953), specifically broke down the responsibilities as decisions made by the company in accordance with the values of the society. In the 1970’s, awareness of CSR increased and as such, societal expectations grew. Fast forward to the 2000’s, companies needed to be socially responsible but at the same time ensuring sustainability. Literature on CSR then believed that a company could benefit from CSR while maximizing the firm's value. Since 2015, the literature on CSR has been on its implementation and how it affects the different aspects of performance. (Latapi et al., 2019)
The European commission defines CSR as the responsibility of enterprises for their impacts on society. The commission outlines what an enterprise should do (push for clean energy, eliminate pollution) to meet that responsibility. CSR as defined by Pulos and Gimenez (2016) is the ethical role of the corporation in society; corporate actions and policies that have a positive impact on society.
We provide a number of definitions to CSR above but as the authors of this paper we resonate with Jingwen et al. (2018) more. According to Jingwen et al. (2018), CSR means that the company is responsible for all its community, employees, customers, shareholders, environment, society, among others. They add that it is not logical that a company seeks profit maximization without taking care of other factors and should strike a balance between social obligations and corporate development. CSR is a wide and complicated concept, but we can say that CSR shows the commitment of a firm to its stakeholders, both internal like employees, shareholders and external like customers and society, (Lin et al., 2015).
It is important to note that in Europe, the term CSR has been largely replaced with the term “sustainability” as the former is associated more with philanthropic rather than strategically important activities, (PwC Japan, 2020).
Corporate Financial performance (CFP) principally reflects business sector outcomes and results that show overall financial health of the sector over a specific period. It indicates how well an entity is utilizing its resources to maximize the shareholders wealth and profitability, (Naz & Ijaz, 2016). It is measured by return on equity, sales growth, and cash flow/sales ratio, (Lin et al., 2015).
Verma (2020) explained that financial performance shows the extent to which financial objectives have been achieved and is an integral part of financial risk management. It can also be seen as a way to measure the results of a company's policies and operations in monetary terms and overall financial health over a given period. It allows for comparability between similar firms in the same industry or between industries.
Before we embark on a journey to study this relationship within the Swedish Financial Institutions, we must note that the relationship between CSR and CFP is neither strictly negative nor positive and does not necessarily have a linear relationship as studies have found an inverted U-shaped relationship proving the non-linearity (Trumpp & Guenther, 2017, as cited in Xie et al., 2018).
CSR and financial performance have inconsistencies or irregularities as mentioned above and cases of neutrality have also been found. The reason for the circumstance is the complexity that exists when measuring this relationship. Golrida et al. (2018) studied this complexity and found that the inconsistent results between CSR and CFP is because of the nature of the relationship between the two variables.
In 2020, the same researchers found that the CSR practices are contextual and inherent within the institution or company in which they are conducted. This actively demonstrates that the conclusions made about this relationship are contextual and lack generalization. The relationship depends on the environment, the economic, legal, social, cultural setting in which they are carried out, (Goll & Rasheed, 2004, as cited in Golrida et al., 2020) which leads to the differences in this relationship. Additionally, countries' institutional factors influence the intensity of the CSR and financial performance relationship, (Li et al., 2010 as cited in Golrida et al., 2020). The more similar the institutional characteristics that countries have the more similar their CSR activities will be.
Furthermore, D’Amato & Falivena (2019) stated that the impact of social responsibility on CFP is an empirical question due to the inconclusiveness of the theory behind it; the neoclassical theory (suggests that socially responsible activities are expenditures and not investments), and stakeholder theory (encourages socially responsible activities). Proponents of the neoclassical theory predict negative results (Friedman, 1970 as cited in D’Amato & Falivena, 2019), and those of the stakeholder theory predict positive and, in some cases, neutral results (Freeman, 1984; and Harrison et al., 2010 as cited in D’Amato & Falivena, 2019). This would imply that the obtained results could lean towards the theory that is most agreeable with the researcher, the information available to the researcher and the variables that they use in their studies.
With that said, firm effort to invest in CSR initiatives is dependent on how it affects the financial performance of the firm. If the effect is positive, then the firm will allocate more resources to socially responsible activities to achieve better financial performance, and the firm may forgo or approach CSR initiatives with caution if they affect financial performance negatively (Lin et al., 2015). They added that it is therefore important to understand how CSR initiatives will affect financial performance before implementation in any firm, community, country, and the world at large.
We identified a gap within the existing literature as we did not find any research that studied this relationship within the Swedish financial sector. Most of the studies that directly relate to our topic like Golrida et al., 2020, Zhang and Ouyang 2020, Xie et al., 2018 among others, were done in other parts of the world and a study relating to the Swedish Financial Industry was done by Peter Norberg in 2015. Therefore, we chose to study the Swedish financial sector because previous research on CSR within Sweden has mainly studied this relationship in terms of the banking sector and not the financial sector. Furthermore, the most notable study Norberg (2015), focused mainly on the justifications of the banking sector’s involvement in CSR and not necessarily on the relationship that could exist between CSR and CFP. The research gap is therefore a combination of both a geographical and sectoral gap.
We hope that by the end of this study, we can find out how CSR affects Financial Performance within the financial sector in Sweden. The findings can be applied to all financial institutions in Sweden since all these companies share institutional characteristics
which influences the intensity of the CSR and Financial performance relationship supporting the findings of Li et al., 2010 as cited in Golrida et al., 2020.
1.2 Aim and Research Question
As stated above, previous literature regarding this relationship has mainly studied the banking sector within Sweden and not the financial sector (Grafström, 2015, Norberg, 2015). The study by Norberg that studied the same industry, was not necessarily concerned with the relationship between CSR and CFP and relied heavily on the legitimacy theory. The study suggests that financial institutions more specific to banks undertake CSR initiatives to gain justification from the public, earn their trust and gain a better reputation usually after a public financial scandal.
In his article Bankers Bashing Back: Amoral CSR Justifications he investigated the CSR justifications appearing in annual and sustainability reports from the Swedish finance industry. He found that these corporations believe that arguing in support of CSR activities is likely to lend their company legitimacy. He explains that when a company is criticized for lacking ethics, then it will make educated guesses about how shareholders will react to their involvement in CSR, and as a result Financial firms provide the justifications that shareholders appear to demand.
We chose this study because we expect that if it is indeed a matter of fact that these institutions gain the justification from the public that they so desire when they choose to get involved in socially responsible activities, then it should be that the public trust and justification would translate into improved financial performance. With that brief background we seek to investigate whether the Swedish Financial institutions gain some reward in the form of improved financial performance from their involvement in CSR activities.
The overall Research question that we seek to answer is “Does Corporate Social Responsibility (CSR) have an Impact on Corporate Financial Performance (CFP) in the Listed Swedish Financial Institutions on the Nasdaq Nordic stock exchange market (Stockholm)”
2. Literature Review
In this chapter, we present the research and findings of different authors within this field in general, then talk about CSR within Sweden as a whole and then move on to explain how the Swedish Financial sector is being socially responsible.
2.1 CSR Theories
Visagie and Coetzee, (2019), the authors of The evolution and Models of Corporate Social Responsibility use the work of different researchers to explain the CSR theories that we discuss in this section. Agency theory asserts that the social responsibility of a corporation is to increase profits, stating that only human beings can be morally responsible, and that agents (managers) are only responsible for acting in the interests of the shareholders. According to this theory, social issues are supposed to be handled by the state and not corporations (Friedman,1970 as cited in Visagie & Coetzee, 2019). Agency theory therefore holds that individuals will work towards maximizing their utility functions and increase their wealth while decreasing expenditure, and since it costs a lot in terms of resources to implement CSR initiatives, there is increased expenditure, and it should therefore be avoided, (Jensen & Meckling, 1976 as cited in Visagie & Coetzee, 2019).
Given that financial institutions are money managers and not necessarily the owners of the money that they spend, Shareholder theory similarly disagrees with company involvement in social responsibilities and stresses that a firm should maximize the present value of all future cash flows (Danielson et al., 2008 as cited in Visagie & Coetzee, 2019). They argue that it is imprudent to spend shareholder’s money on unprofitable social issues. Saleem et al. 2016 as cited in Visagie & Coetzee, 2019 add that it is inappropriate to be generous with another’s money given that the company managers do not actually own the shareholder’s resources. They add however, that if CSR initiatives increase the bottom line or net income, then they are worth implementing.
On the other hand, the stakeholder theory maintains that business obligations extend beyond the traditional duties towards shareholders to other groups like customers, employees, suppliers, financiers, competitors, media, and neighboring communities (Camilleri 2015; Rojas et al; 2017 as cited in Visagie & Coetzee, 2019). Freeman 2002 as cited in Visagie & Coetzee, 2019 maintains that managers bear a fiduciary relation to stakeholders. The stakeholder’s engagement, knowledge, skills, talent and loyalty are needed to achieve
organization objectives, (Nikolova & Arsic, 2017 as cited in Visagie & Coetzee, 2019). Saleem et al., 2016 added that firms become more attractive to consumers with increased CSR and concluded that CSR initiatives should be taken on by all firms.
2.2 CSR and Financial Performance
CSR engagements have been used to attract stakeholder attention (Madsen and Rogers, 2015 as cited in Zhang & Ouyang 2020) as companies with high CSR engagements are easily spotted by stakeholders, (Graaflund, 2018, as cited in Zhang & Ouyang 2020).
First, firms need to pursue long-term, consistent, and proactive environmental strategies in order to achieve corporate reputation which is connected to CFP. Corporate environmental responsibility enhances CFP not only from stakeholder attention but also from a positive impression from them of why the company is engaging in CSR. The CSR initiatives boost companies’ prominence which indirectly improves CFP. In the blossoming era of corporate influence and growing interest in environmental wellbeing, companies that engage in Environmental Protection activities are prone to being liked by stakeholders with the same interest (Zhang & Ouyang, 2020).
Secondly, CSR, especially environmental activities, drive innovation which increase revenue that covers the additional costs that come with CSR; (Ambec et al., 2013, Porter & Van der Linde, 1995 as cited in Xie et al., 2018). With environmental activities viewed as an additional cost in the past that decrease profitability, the Porter theory asserts that it could lead to technological and managerial innovation, offsetting the costs and eventually generating revenue.
According to Heikkurinen (2010; as cited in Zhang & Ouyang 2020), environmental initiatives are viewed by stakeholders as corporate responsibility which boost corporate reputation and in turn CFP, as environmental strategies disclosure has a positive relationship with CFP (Aerts et al., 2008 as cited in Xie et al., 2018). This was the case for the polluting industries in the USA, (Clarkson et al., 2011as cited in Xie et al., 2018). Amrou et al. (2020) explain that the positive relationship between CSR and Financial performance could influence managers to invest more in CSR activities, report and publish all their achievements in social engagements and the environmentally friendly approaches they follow, to improve the firm's
image and attract investors. It then becomes easier for first in class CSR firms to get loans and access to more capital and eventual improvement in the Financial performance of the firm.
Despite all the research that supports the idea of companies implementing CSR because they are doing “good”, CSR initiatives and engagements can also be used as a distraction after a scandal or misconduct, (Du, 2015, Ouyang, Zhang & Hu 2020) and could also be viewed as hypocrisy if the initiatives follow a bad reputation (Salmones & Perez, 2018, as cited in Zhang & Ouyang 2020). However, CSR contributes to social legitimacy and mitigates the risk of adverse regulatory, legislative, and fiscal action (Hillman & Kleim, 2001, as cited in D’Amato & Falivena, 2019) and the cashflow that would have been used in the litigation process is then diverted to strategic investments. (Sharfman & Fernando, 2008, as cited in D’Amato & Falivena, 2019).
Additionally, firms voluntarily disclose ESG information to gain social legitimacy for environmental and social impacts that have been caused by their operations and it is seen as a strong motive for disclosure, (Lokuwaduge & Heenetigala, 2017 as cited in Xie et al., 2018). With increased social media pressure and an increased need for stakeholder attention, the disclosure maintains and enhances the company reputation (Brammer & Pavelin, 2008 as cited in Xie et al., 2018).
Xie et al., (2018) investigated if firms that were rooted in ESG activities could be efficient and profitable, and found that it is as important to disclose the CSR initiatives as it is to implement. They found that with moderate disclosure of the ESG activities, there is a positive association between ESG, and efficiency as opposed to high and low disclosure. Disclosures about governance initiatives have the strongest relationship to efficiency, followed by social and then environmental activities disclosure. Firms are increasingly taking up sustainability strategies and the disclosure rates continue to increase, bringing changes to the business model and management theory, (Xie et al., 2018).
In addition to stakeholder attention, companies also disclose their CSR activities to avoid information asymmetry between the managers and outside investors. Investors tend to undervalue good corporations and overvalue bad ones because of the limited information that they have. Investors that lean toward social impact will prefer socially responsible funds to
conventional funds with higher financial performance, (Riedl & Smeets, 2017 as cited in Xie et al., 2018).
ESG disclosure could also reap benefits to a specific sector. More specifically to the banking industry or sector, good corporate governance initiatives coupled with disclosure, have a positive effect on CFP, (Sanchez et al., 2017 as cited in Xie et al., 2018). On disclosure of governance activities, firms are in a better position to hire more capable managers, which translates to better financial performance, (Hermalin & Weisbach, 2012).
As mentioned earlier, there are other variables that could affect the CSR-CFP relationship, we explore firm size and age of the firm and use them as control variables. Literature on the same variables has been done in the past. There has always been an assumption that CSR-CFP relationship did not vary with firm size (Mackey, Mackey & Barney, 2007 as cited in D’Amato & Falivena, 2019) and as such, the past literature was mainly focused on large companies, (Lozano, 2015 as cited in D’Amato & Falivena, 2019). D’Amato and Falivena (2019) explored firm level moderators to study the relationship between CSR and CFP to check if the firm size and age drive the relationship in any way. The findings show that the CSR-CFP relationship is negatively impacted when small and young companies are considered due to lack of financial resources, experience, reputation among others.
A stream of research highlights negative relationships since it is viewed as an unnecessary additional cost, (Bird et al., 2007 as cited in D’Amato & Falivena, 2019). However, there was a claim that by Makni et al., 2009 as cited in D’Amato & Falivena, 2019, that large firms have more resources and can afford the extra cost, and smaller firms must rely on their personal resources, which could be a struggle, (Johnson and Greening, 1999 as cited in D’Amato & Falivena, 2019). Furthermore, CSR initiatives need to be carried out on a large scale to be successful, (Youn, Hua & Lee, 2015) in terms of resources, number of people, structures and so on, making it easier for larger firms to implement CSR (Tsoutsoura, 2004 cited in D’Amato & Falivena, 2019).
Just like firm size could affect this relationship, the age of a company could affect stakeholder relationships, market share, experience, and strategic position, reputation and goodwill given the reluctance of stakeholders to interact with them due to lack of established links and legitimacy. Younger firms are also subject to more volatile cash flows, more growth and less
financial resources for CSR initiatives, (D’Amato & Falivena, 2019). They stated that younger firms need to be established further to have the ability to implement CSR successfully and, in a cost, friendly manner. Younger firms also exhibit less reputational capital, since their reputations are less stable than those of older firms, (Flanagan & O’Shaughnessy 2005 as cited in D’Amato & Falivena, 2019).
Therefore, to sum up the literature on the control variables, there is evidence to prove that both younger and smaller companies have less resources and less formalized decision-making in their structure, (Frederick, 1986 as cited in D’Amato & Falivena, 2019) and as such may not be able to afford participation in the CSR initiatives.
2.3 CSR in a National Context
The term CSR is also known as sustainable business and can be described as the work companies do that has a positive impact on society, the environment, or the economy. Examples of these CSR initiatives may include but are not limited to carbon dioxide emissions reduction, promotion of equal career opportunities, and involvement with local communities through sponsorship of local events. The scope has increased over the years to cover aspects of business operations as diverse as corruption in supply chains and local environmental efforts as reported by the Swedish government website.
The Swedish Government’s end goal is to ensure that all companies warrant sustainability and as an example, the government demands that all the 46 companies it owns are a part. Since 2007, the government has required sustainability reports (in compliance with the Global Reporting Initiative guidelines) from all state-owned enterprises. Additionally, all Swedish companies are expected to respect human rights in all their operations. In addition to that, the Swedish government is engaged in the Global Goals and the 2030 Agenda for Sustainable Development
A recent study by Grafström et al., (2015), suggests that the trend towards CSR and the public questioning about companies’ responsibility became more prominent world over in the late 1990’s after the 1999-2000 scandals of three major companies including one from Sweden. In 1999, both Enron and WorldCom faced bankruptcy because of accounting breaches and in 2001 Skandiaaffären was criticized for high bonus contracts, corrupt management team, and the administrative decision-making that disadvantaged the customers. It was after this that the
government acted and established a trust commission to restore and strengthen the public trust in the Swedish financial industry, (Grafström et al., 2015).
As a result, within the CSR or sustainability field, Swedish companies are active participants and have been for the longest time since 2001. As a country, Sweden, also viewed as a pioneer for sustainability worldwide, has ranked number one of sixty-five countries by RobecoSAM Country Sustainability Ranking in both 2013 and 2019 on seventeen ESG indicatorsas mentioned on the government website.
On the environmental aspects, Sweden has strict environmental regulations, with high levels of knowledge and awareness making their operations highly innovative and efficient. Paper recycling, the sustainable use of resources, minimizing environmental footprints and reducing water consumption are some of the areas of focus for Sweden. It came third in the Global Cleantech Innovation Index 2017, after Denmark and Finland. Cleantech includes products or services for example non-fossil fuels that improve performance and productivity while ensuring low costs of production and less wastage or pollution. Swedish financial institutions were some of the first to issue green bonds in the green bond market (SEB, Nordea, Kommuninvest, Vasakronan) and the Swedish National Debt office issued its first sovereign green bond in September 2020, according to the Stockholm Sustainable Finance Centre (SSFC).
On the Social aspect, with a major focus on gender equality and human rights achievable in companies by promoting a work and family life balance, encouraging shared participation in childcare, and giving women and men equal opportunities to rise to leadership positions; Sweden ranked fourth of one hundred and fifty-three countries on the national gender gap in the assessment done by The World Economic Forum in Global Gender Gap Report 2020. Sweden has had strong anti-corruption legislation since 1997 in collaboration with the EU, European Council, UN, and OECD prohibiting bribery of public servants in international business relationships. On the governance aspect Sweden was ranked fourth of 180 countries on the Transparency International’s Corruption Perceptions Index in 2019.
2.4 CSR in Swedish Financial Institutions.
According to the Swedish Bankers Association, the three major roles of the financial system are to convert savings into funding, manage risks and make it possible for payments to be made efficiently. The services offered by companies within the financial sector are crucial to the well-functioning and growth of an economy. There is an increase in welfare of any
country whose system of savings, finance, payment intermediation and risk management are reliant and efficient. Some of the types of companies within the financial sector include banks, credit institutions, insurance companies and securities companies, which channel the savings from households and companies into investment projects.
Following financial scandals in the early 2000s that involved several leading global companies, the need to increase and take up CSR initiatives also increased in the company strategies to achieve sustainability, (Galbreath, 2009; Lozano & Arenas, 2009, as cited in D’Amato & Falivena, 2019). The European Commission has been encouraging companies to develop CSR strategies since 2001 (Commission of the European Communities, 2001).
On a global scale, when the financial system morally failed customers and companies after the financial crisis, there was an increased focus on the financial industry from the public, (San-Jose et al., 2011 as cited in Lenka & Jiri, 2014). From the crisis, it was realized that there was a lack of moral principles in managers´ decisions because the livelihoods of millions of people around the world decreased through increased unemployment due to a reduction of global consumption, (Lenka & Jiri, 2014). As a result, financial institutions started to face an external pressure to take on social responsibility (Weber et al. 2014 as cited in Norberg, 2015), started to talk more about it in a bid to improve their social strategy and minimize the reaction from stakeholders and critics about the unethical attitudes these institutions may have had a role in, (Norberg, 2015).
Norberg continues and asserts the importance of disclosing CSR for the financial sector. They not only engage in CSR activities but also report, publish, and disclose it to raise their reputation and gain justification. The financial institutions are in position to disclose their initiatives because they can afford the cost of reporting given that they are huge companies with financial abilities. Disclosure was especially important because with these scandals and increased criticism of the financial institutions from the public, awareness of social issues had increased, socially responsible investments were born and investors chose their investment channels without relying on the profit criteria solely but also took environmental and social issues into consideration (Scholtens 2006, 2009 as cited in Jo et al., 2014).
As time went on, the Financial institutions started to feel indirectly responsible for their clients’ environmental behavior, and the banks developed strong reasons for availing less capital to environment harming projects (Islam et al. 2012 as cited in Jo et al., 2015). In the same vein of Socially responsible investments, many financial institutions started to offer
savings accounts promoting sustainability and promising the customers that their money will be used to finance environment friendly projects or projects that care about society. This made it easier for such projects to access funding, (Scholtens 2006, 2009, Jo et al., 2015) thereby ensuring sustainability.
To sum up everything that has been mentioned so far, we see that sustainable finance is taken seriously in Sweden, and both the government and financial institutions have taken up and continuously plan sustainable initiatives. As an example, the Swedish government issued its first green bond in 2020 and joined most of the Swedish banks that already offer green mortgages, green covered bonds to fund green mortgages among others, (Nilsson, 2020).
Having looked at the general picture, we now mention how some of the financial institutions are ensuring sustainability. Most of the activities/initiatives we mention cut across all the financial institutions since most are formulated from the sustainable goals and are of similar institutional characteristics. We will first consider Swedbank that is committed to providing credit and lending facilities to enable the transition to a low-carbon economy by using environmental, social and governance criteria in its lending process. Since the early 2000s, it has integrated and reported environmental issues into its lending process. To support a sustainable economy, the products and services offered to its privatecustomers include green mortgage loans, green car loans, green car leasing, solar panel loans and energy loans. Swedbank is both an issuer and an issuing institute in the green bond market and has issued two green bonds since 2017. Green bonds create value for the company, investors, and society.
Sustainability is an integral part of Svenska Handelsbanken’s culture and method of working which means they act responsibly (responsible investment and lending) and with a long-term perspective in areas where the Bank can make a difference.
They ensure to have a positive impact on society by promoting human rights, ensuring tax compliance by following the laws and regulations, and having a group wide department dedicated to preventing financial crime. At Handelsbanken, there’s a need to have an inclusive work culture, based on trust and respect for all individuals and endeavor to achieve and maintain gender equality and diversity.
SEB ensures through sustainable investments that money is placed where they can do environmental and social benefits excluding companies whose operations can contribute to
the opposite like illegal and nuclear weapons, companies where coal mining accounts for more than 5% of sales, alcohol, other weapons, tobacco, and pornography. Their sustainable and ethical funds invest in companies that perform particularly well in managing carbon dioxide emissions, water consumption and toxic emissions.
As mentioned earlier, SEB, together with the world bank, was the first bank to issue a Green bond. On the issuance of its EUR 500m five-year green bond on 10th February 2017, the bank’s stock was affected positively on the stock market as seen in the graph below.
Graph1 (Avanza, 2021)
Additionally, the Bank supports entrepreneurs and young people since entrepreneurial thinking and innovative companies are needed to create a better world. This is done through their daily operations and collaboration with well-established organizations that promote entrepreneurship in all its phases.
In line with the SEB fund savers preferences; fighting climate change, clean water and sanitation and good education for all.
In a nutshell, the relationship between CSR-CFP can be positive, negative, or neutral as we have seen from the available literature. This is because the relationship is dependent on so
many known and unknown variables like geographical scope (whether a company is in a developed or developing country), firm size (number of employees, total assets) publicly traded firms (companies that are on the stock exchange market), the level of disclosure of the CSR engagements among others. The way that different researchers use the different factors and tests as they do their study could also influence the relationship. Amrou et al. (2020) found a positive relationship by testing different variables, however, when they controlled the endogeneity (location), the research found that the significant positive correlation between CSR and operating performance disappeared.
We will therefore use the ESG Score, Firm size (total assets), Age of the firm (how long the company has existed) and the capital structure of the firm to investigate if CSR improves financial performance in the Listed Swedish Financial Institutions.
3. Methodology
In this chapter, we present information on the selected sample, how we conducted this research and the reasoning behind using the different methods and approaches that were based majorly on methods that were used in previous studies within this topic. First, we introduce the sample, the research method, demonstrate the collection process of our panel dataset, explain the measure of the variables, and then run the regressions.
3.1 Sample
The thesis focuses on the relationship between CSR and CFP within the Swedish Financial Institutions listed on the Nasdaq Nordic Stock exchange market (Stockholm) by the end of 2019. We collected the data from twenty-six financial institutions whose home country is Sweden between the years 2015 and 2019. We chose to study listed companies mainly because of how easy it is to access, assess and measure their market value. We also look at this relationship from a more recent perspective while excluding the impact that the COVID-19 pandemic could have had on both the dependent and independent variables that are CFP and CSR activities of the firms hence taking the study period between 2015 and 2019. We had hoped to study longer periods but were limited as we elaborated in Section 6.2, we took all the Large Cap, Mid Cap and Small Cap to eliminate the bias surrounding the size of the firm.
The sample consists of nine banks and 17 investment companies with fifteen listed as Large Cap, nine as Mid Cap and two as Small Cap1. More characteristics regarding the sample have
been mentioned in section 4 of this paper.
3.2 Research Method: Quantitative Research Method
We employed a quantitative research method that uses numeric data (numbers) to test the relationship between two variables using different statistical techniques like regression and hypothesis testing. With this method, a researcher can incorporate control variables ensuring data validity, (Saunders et al., 2012, p. 161). With the quantitative research method, the
researcher can study specific variables and investigate their correlations, relationships, and causality. It also gives the researcher the opportunity to have a wide study with a great number of subjects and allows for generalization and accuracy as it ensures validity and reliability. The bias associated with a researcher having direct interaction with the subjects can be eliminated by keeping distance from the subjects and using developed technologies, (University of South California, 2021.).
We used this method because with it, a researcher can test for causal relationships between variables and use the results for predictions and generalisations and comparability with similar studies, (McLeod, 2019). So, with the results that we found, we were in position to make predictions and generalisations about CSR and CFP for the financial institutions in Sweden.
3.3 Models
3.3.1 Regression Model
From the data collection, we obtained panel data and used the Fixed Effects regression model to test the impact that CSR the independent variable has on CFP the dependent variable. We carried out various tests that are elaborated in section 4.4.1 before we chose FEM as the optimal model for this study. We used a fixed effects model, a model that investigates the relationship between two variables whose observations span between cross section units (for example companies, countries and in our specific case, the financial institutions under study) and over several periods of time, as our data, known as panel data. We use this model because it controls for the unobserved variables that a researcher might not know about but could affect this relationship and bias the results. With the fixed effects model the effect that the unobserved variable could have had is omitted.
The equation of the fixed effects model is Yit= αi+ β1X1it+ β2X2it . . . + βKXKit+ εit,from
which we notice that FEM considers the intercept (αi) to be a constant term in the regression and captures the unobservable, and immeasurable characteristics that make all these financial institutions different, implying that these differences are constant over time. In addition to this, FEM assumes the mean and variance of the error terms to be zero and by these assumptions, the results obtained by the ordinary least squared (OLS) method that FEM uses, are consistent, unbiased, and efficient (Sherron & Allen, 2000).
3.3.2 Econometric Model
From the regression model in the previous section, we adopted the econometric model stated below.
𝑌𝑖𝑡 = α𝑖 + β1𝑋𝑖1 + β2𝑋𝑖2 + β3𝑋𝑖3 + β4𝑋𝑖4 + ε𝑖𝑡
Where, Yi- is the dependent Variable (Tobin’s Q and ROA of the Firm)
Xi1– ESG Score/rating of the Firm
Xi2– Firm Size (Number of employees)
Xi3– Age of the firm (How long the Company has existed)
Xi4– Capital structure of the firm
i – the observations (firms)
β - the unknown coefficient of each independent variable Ei– The error term
3.4 Measuring the variables
We present how we intend to measure all the variables that we will use in the regression.
3.4.1 Financial Performance (Dependent Variable)
To measure the financial performance of the firms, we used a market-based measure, Tobin’s Q which reflects the value of the company, and an accounting-based measure, Return on Assets (ROA) which reflects the internal efficiency of the company.
According to the National Institute of Economic research, (KonjunkturInstitutet, 2019), Tobin’s Q measures the relationship between the market value of an asset and its replacement cost. It is a measure of how profitable it would be to invest in that asset and therefore a high Tobin’s Q is preferred to a lower one. We used Chung & Pruitt’s (1994) method as used in Fang et al., 2008 shown below to calculate it.
Where, MVE is Market Value of Equity PS is Market Value of Preferred Stock
DEBT is the book value total debt (both short and long term) of the firm TA is the book value of total assets
We also used an accounting-based measure to measure the financial performance of the companies; Return on Assets (ROA). It is a measure of profitability and is an indicator of how well a company is performing in terms of managing its resources effectively, (Thakur & Vaidya, n.d.).
We used the formula below to calculate the return on assets.
(Thakur, n.d.)
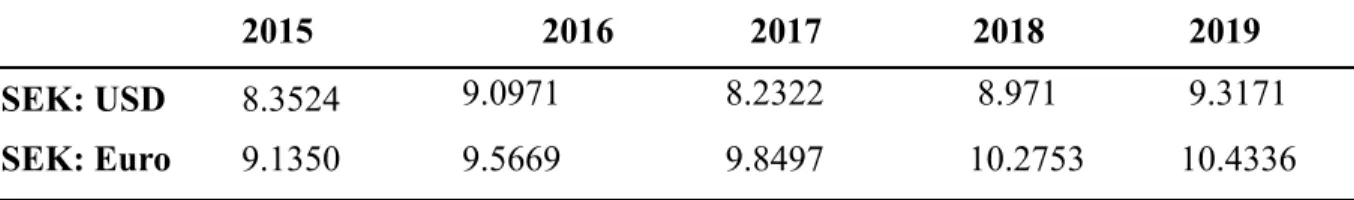
All the financial data is in Million Swedish Krona (SEK, M). There were companies that reported in either US dollars or Euros (VNV global in US dollars, and Nordea bank and EQT in Euros). The data that we obtained in Euros and US dollars was converted to SEK using the exchange rate that was prevalent on the last day of each year as shown in table 1 below, taken from Swedish National Bank, (Sveriges Riksbank, n.d.). All these three companies, like many of the others, have fiscal years starting in January and ending in December, justifying our use of the end of year exchange rate.
2015 2016 2017 2018 2019
SEK: USD 8.3524 9.0971 8.2322 8.971 9.3171
SEK: Euro 9.1350 9.5669 9.8497 10.2753 10.4336
Table 1: Showing the Euro and Dollar exchange rates that were used to convert the data to SEK
3.4.2 Corporate Social Responsibility (Independent Variable)
For CSR, we used the combined ESG rating, or score received by each firm and taken from the Refinitiv DataStream (The macroeconomics analysis DataStream). The ESG score is in percentages and the highest score that can be attained or obtained by any firm is 100% and the least possible score is 0% depending on the CSR activities that have been reported by each individual firm. This score from Refinitiv is designed to objectively measure a company’s ESG performance, commitment and effectiveness across ten themes like emissions, environmental product innovation, human rights and many more using publicly reported data by the companies.
ESG stands for Environmental, Social and Governance, a subset of non-financial performance indicators reflecting the three key factors for measuring the sustainability and ethical impact
of an investment in a company. Most socially responsible investors monitor companies using the ESG criteria to screen their investments, (Market Business News, n.d.)
Figure 1 below summarizes the process and the ten pillars against which the ESG score is calculated by Refinitiv.
Figure 1
The overall ESG score of the companies from the Refinitiv DataStream follows a detailed process and is calculated on the three major pillars of CSR: Environmental, Social and Governance aspects. With over five hundred ESG measures, trained analysts process data manually for each company, which goes through a standardised process to make it comparable across all companies. There is continuous updating of the database either by adding a new company or in light of new controversial events that are picked up by global media. All this is made possible through Companies’ own ESG disclosure since the analysts collect this data from the companies’ annual reports, CSR reports, companies’ websites, NGO websites, stock exchange filings and news sources. (Refinitiv, 2021)
3.4.3 Control Variables Capital Structure
Capital structure of the firm was calculated as the debt-to-equity ratio of the company in the listed Swedish financial institutions. It reflects the combination of debt (bond issues or loans) and equity (common stock, preferred stock or retained earnings) that a company needs to finance its overall operations and growth, (Tuovila, 2021).
There is reason to believe that firms that incorporate CSR in their activities will have access to more capital either through equity or debt. Yang et al., 2014, as cited in Selcuk 2019, found that firms that are actively involved in CSR possess higher leverage than firms that are not as active, due to the reduction of information asymmetry between firms and creditors.
Firm Size
The firm size in our model was measured as the total assets at the close of the financial year in each company throughout the period of study. The assets of any given company are of economic value and are held by the company with the expectation that they will derive future benefit. Assets within financial institutions can be in the form ofbank deposits, stocks held by the firm in another company, bonds held by the firm, loans issued to customers also known as financial assets, (Khan Academy, n.d.). They can also be physical assets like equipment, land and buildings (if they are owned by the company) and so many others,(Brooks, 2017)
Age
The age in our model was calculated as the number of years that the company has existed. This information (the year the company was founded) was taken from the respective company’s homepages and we took the difference of the founding year from the year whose data was being collected. For example, if a company was founded in 1960, then it would be 55,56,57,58,59 years in 2015,2016,2017,2018 and in 2019 respectively.
We considered firm size and age just like recent researchers because the assumption in the past was that the CSR-CFP relationship did not vary with firm size and as such literature from the previous studies looked at only large firms and ignored smaller and younger firms. D'Amato and Falivena (2019) investigated firm level moderators to investigate the relationship between CSR and CFP and noted that due to a lack of financial resources, experience, and reputation, small and young businesses may not reap the same benefits from their CSR engagements. We therefore decided to study the companies of all sizes and ages to eliminate this bias.
3.5 Hypothesis Testing and significance level
Hypothesis testing in statistics, is a means by which a researcher proves an assumption about a population depending on the nature of their data and purpose of their study, (Majaski &
Westfall, 2020). The stated hypothesis is the null hypothesis denoted as H0 and is tested
against the alternative hypothesis denoted as H1, (Gujarati & Porter, 2009, p.113).
We tested the hypothesis using the p-value approach. The p-value measures the probability that an observed difference could be by chance to be able to interpret statistical significance, (Beers & Westfall, 2020). We set and used a 5% level of significance as is the convention in most studies and then compared the p-values obtained from the regressions to test for significance. A p-value less than 0,05 allows for rejection of the null hypothesis and a failure to reject the null hypothesis if a higher p-value is obtained.
The hypothesis that will be tested in this research is mentioned below as follows.
H0: There is a positive relationship between CSR and CFP i.e., 𝞫2>0
We tested the hypothesis that there is a positive relationship between a financial institution that chooses to get involved in CSR and the financial performance of that firm, given the background that it can be positive, negative, or neutral.
From the regression results, we could either reject or accept our null hypothesis. Obtaining a significant positive result, would mean that we failed to reject the null hypothesis. A positive result would generally support the hypothesis that when firms get involved in CSR, it could increase their visibility and improve their reputation, giving them access to more capital and therefore an eventual improvement in financial performance supporting the findings of Selcuk, 2019 and Freeman, 1984 as cited in Selcuk, 2019. A negative result on the other hand, would imply that these firms are spending on CSR and incurring unnecessary costs on something that does not improve the bottom line or in some cases, even worsening the financial performance. This would be consistent with the findings of Friedman, 1970; Williamson, 1964, and Harrison et al., 2010 as cited in D’Amato & Falivena, 2019. This would mean that we rejected the null hypothesis.
Additionally, rejecting the null hypothesis and accepting the alternative would mean that we obtained an insignificant result implying a neutral relationship. This would be an indication that whether the Swedish financial institutions get involved in socially responsible activities (CSR) or not, their financial performance will neither improve or deteriorate, supporting the 2000 study of McWilliam & Siegel as cited in Selcuk, 2019.
3.6 Data Collection
3.6.1 Literature reviewWe used peer reviewed articles that studied the relationship between Corporate Social Responsibility and financial performance in the past. In order to get access to these articles we searched some key words like CSR, ESG, financial performance, Swedish financial sector, social responsibility among others, using google scholar, Jönköping University library database, Ideas repec, among others. To ensure that we get relevant, recent, and reliable information, we limited our search for articles within this topic to a period between 2014 and 2021.
3.6.2 Regression data
We investigated this relationship using all the financial institutions listed on the Nasdaq Nordic Stockholm Market by the end of 2019 between 2015 and 2019. We chose to study financial institutions because we did not find literature that studied this relationship in Sweden before.
Since the firms are listed, they are publicly traded companies. We were able to access and collect their annual reports (financial data) from the Refinitiv DataStream, a historical financial database (The macroeconomics analysis DataStream) for the years stated above. On 7th May 2021, we collected the ESG scores from Refinitiv, we specify the date because the scores keep changing in light of new information. All the necessary numbers needed to calculate the financial performance were also collected from Refinitiv. We collected the net income and total assets to calculate ROA, long term debt and equity to calculate the capital structure. We chose this DataStream because it has 65 years’ worth of information and tools needed to interpret market trends, cycles, and their impacts on the world, (Refinitiv, n.d.). We visited the homepages of the various institutions to find their years of establishment to enable us to calculate the age of the companies.
In order to calculate Tobin's Q, we obtained the market capitalization from the Morningstar fact sheet of the companies that is uploaded on Nasdaq Nordic website and used the already obtained total debt and assets from Refinitiv.
3.7 Reliability and validity
Reliability, tests if a specific tool or test will give the same results in different circumstances keeping other factors constant. With quantitative data as ours, reliability means that any
research tool should give the same results when used by different people or at different times. For Example, if we run the regression today or after a week or if other researchers run the same regression, then similar results should be obtained, (Roberts et al., 2006). With our data and findings, keeping all other factors constant, any researcher will obtain the same results when they run a regression.
External validity as explained by Roberts et al., 2006, means that the results obtained by a researcher can be applied to other people, that is, they can be generalised, while keeping other conditions the same. In our study the results can be generalized for all the financial institutions in Sweden (given the similar country characteristics) but not to other sectors and the financial institutions in other countries.
4. Results
From the data collection, we obtained 48.46% of the ESG Scores in our observations that is 63 out of 130 total observations. 17 out of 26 firms (about 66%) had actively and rightly disclosed their CSR activities and were awarded an ESG rating or score by Refinitiv. This automatically clustered our data into two; reporting (high levels of disclosure) and non-reporting firms (Low levels of disclosure).
In this section, we provide a summary of the data that we collected from our sample in the form of descriptive statistics, correlation matrices and regression results. The last part of this section gives the general overview and interpretation of our findings.
4.1 Corporate Financial Performance (Dependent Variable)
Tables 2 and 3 below summarise the annual data for all the variables that we used to test our hypothesis. The information is representative of 26 Swedish Financial institutions listed on the Nasdaq Nordic Stock Exchange (Stockholm) between the years 2015 and 2019.
Statistic ROA Tobin's Q
Mean 0.0722 0.8849
Standard Deviation 0.1077 0.7700
Minimum Value -0.1629 0
Maximum Value 0.5985 7.03
Count 130 130
Table 2: Descriptive Statistics for the Dependent Variable Return on Assets
The Institutions have an average Return on Assets of 7.0722% and standard deviation of 10.77% indicating a high volatility and variation since the values range between -16.29 and 59.85%. From the data, we notice that the ROA for the companies generally dropped throughout the period of study, with only a few companies realising a slight increase in this ratio. This ratio is suggestive that the financial institutions utilised their assets effectively and generated profit throughout the period under study.
Tobin’s Q ratio
The mean of Tobin’s Q ratio is 0.8849 and the values range between 0.00 and 7.03 with a standard deviation of 0.77. Unlike ROA, Tobin’s Q remained consistent throughout the period with slight increases and decreases within the individual companies. On average, the financial institutions are undervalued on the market, an indicator that the total market value of the firms is less than their total asset value also known as replacement costs.
4.2 Independent Variable and Control Variables
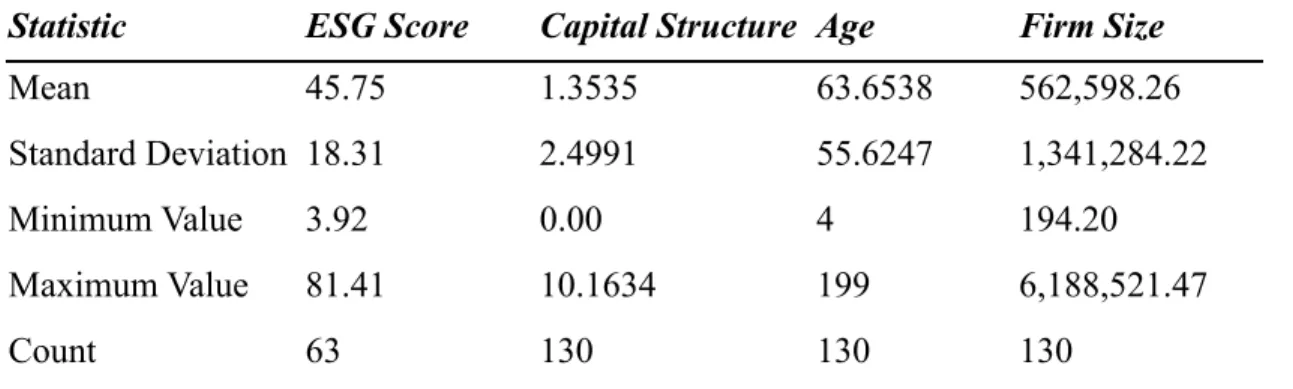
Statistic ESG Score Capital Structure Age Firm Size
Mean 45.75 1.3535 63.6538 562,598.26
Standard Deviation 18.31 2.4991 55.6247 1,341,284.22
Minimum Value 3.92 0.00 4 194.20
Maximum Value 81.41 10.1634 199 6,188,521.47
Count 63 130 130 130
Table 3: Descriptive Statistics for the Independent Variable Corporate Social Responsibility
From Table 3 above, which shows the descriptive statistics of the variables, the ESG mean score of the institutions throughout the period under study was 45.75% with a standard deviation of 18.31% which indicates a low volatility and variation. The ESG scores, especially in 2019, can be explained by the entrance of the smaller institutions on the reporting radar. Previously in 2015, 2016 and 2017, almost only the larger institutions were disclosing their CSR activities correctly using the required standards and therefore obtained ESG ratings from Refinitiv. Although the smaller firms reported their CSR implementation in their annual and/or sustainability reports, they were unable to obtain ESG ratings throughout the period of study.
Capital structure, Firm size, and Age of the firm
The capital structure of the firms ranges between 0 and 10.16 with a mean of 1.35 implying that the institutions rely more heavily on debt than equity. This means that the outstanding debt for these financial institutions is 1.35 times larger than the equity that they hold. This
average was majorly influenced by the bank ratios as they heavily rely on debt for their operations. The standard deviation is 2.49 indicating a high volatility and variation from the mean.
For firm size and age of the firm as mentioned earlier was taken as the number of total assets and the years of existence of each company respectively. We then took the natural logarithm for the firm size and age to avoid having highly skewed data as the numbers range between 6,188,521 (approximately 6 trillion SEK) and 194, 200,000 SEK for firm size and between 4 and 199 years for the age of the firm. The details are shown in table 3 above. The average age and size of the firms in the sample is approximately 63.65 years and 562 billion SEK in total assets.
4.3 Correlation Matrices
The value in each individual cell of the matrix shows the Pearson Correlation Coefficient between each pair of the variables. It helps a researcher summarise a large dataset to be able to identify and envisage patterns in the data that they collected (Corporate Finance Institute, 2021).
ROA ESG Score
Capital
Structure LnAge LnFirmsize
ROA 1
ESG Score -0.4121276 1
Capital Structure -0,2949251 0.66003112 1
LnAge -0,2254754 0.61571841 0,628471772 1
LnFirmsize -0,2668453 0.61144392 0,652509442 0,6867642 1 Table 4: Correlation Matrix for ROA and the independent variables
We found that ROA is slightly negatively correlated to all the explanatory variables. These values, however, are close to zero and so there is no strong evidence for significant correlation between the variables (Statology, 2020) as shown in table 4 above.
Similarly, Tobin’s Q also has a weak negative correlation with all the explanatory variables; CSR, Capital structure, age of the firm and firm size as presented in table 5 below. We also noted that the control variables are strongly positively correlated with the independent variable but because none of the correlations is above 0,7 (an indicator of highly correlated variables), then multicollinearity should not be a problem. Multicollinearity is due to having two highly correlated independent variables, which could undermine the statistical significance, (Allen, 1997, 176)
Tobin's Q ESG Score
Capital
Structure LnAge LnFirmsize
Tobin's Q 1
ESG Score -0,2686047 1
Capital Structure -0,2063541 0,66003112 1
LnAge -0,0800284 0,61571841 0,628471772 1
LnFirmsize -0,1846249 0,61144392 0,652509442 0,6867642 1 Table 5: Correlation Matrix for Tobin’s Q and the independent variables
4.4 Regression
4.4.1 Regression Results
We run two other tests alongside the Fixed effects model namely Pooled Ordinary Least Squares (Pooled OLS) and Random effects model (REM) to test which model would be a better fit for our study. The results and their respective tests were as shown below.
Pooled OLS
It is a model that is used with panel data to obtain regression results that assumes the same intercept and same slope for all the cross-sectional data in this case (the financial institutions) over time. This method does not control for heterogeneity data, that is the same constant relationship for the intercept and slope holds for all the cross-sections and all time-series observations which is an extremely strong assumption, (Gujarati & Porter, 2009).
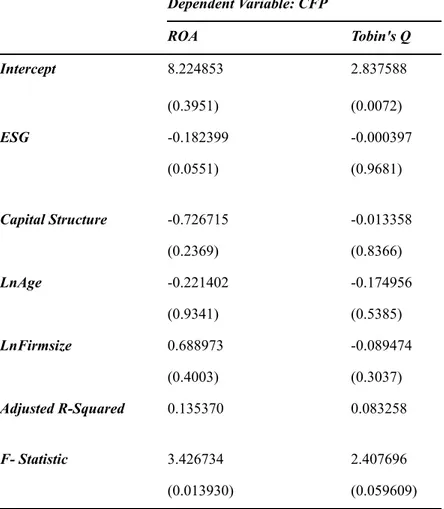
Nevertheless, we regressed our data using this method and obtained the results presented below. Dependent Variable: CFP ROA Tobin's Q Intercept 8.224853 2.837588 (0.3951) (0.0072) ESG -0.182399 -0.000397 (0.0551) (0.9681) Capital Structure -0.726715 -0.013358 (0.2369) (0.8366) LnAge -0.221402 -0.174956 (0.9341) (0.5385) LnFirmsize 0.688973 -0.089474 (0.4003) (0.3037) Adjusted R-Squared 0.135370 0.083258 F- Statistic 3.426734 2.407696 (0.013930) (0.059609)
Table 6 Showing the Pooled OLS regression results
The results show that there is a negative and significant relationship between CSR and CFP at the 10% level of significance as the ESG coefficient has a p-value of 0.0551 in the ROA regression. However, the adjusted R-squared values were 13.537% and 0.083% in the ROA and Tobin’s Q regressions respectively and extremely low. This was an indication that the model was not a perfect fit for our data. We made a Lagrange multiplier test to check whether this was really the case as presented below.
Breusch and Pagan Lagrange Multiplier test
This test is used by a researcher to identify whether the random-effects model or the pooled OLS model is appropriate for their data. The null hypothesis for this test is that the variance of the random effect is zero meaning that every variable has the same intercept, and pooled regression can be used, (Gujarati & Porter, 2009) i.e.
H0: Pooled OLS is appropriate.
H1: Random effects model is appropriate. (Gujarati & Porter, 2009)
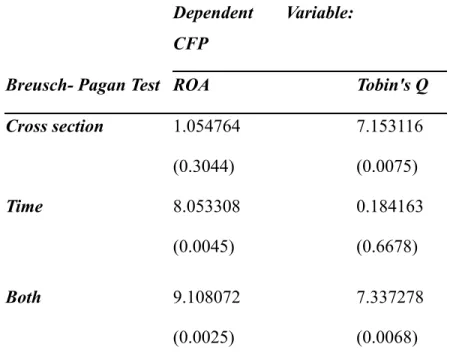
Considering this, we did the LM test to help us to decide between the random effects model and the pooled OLS whose results are shown in table 6.1 below. With this test, we rejected the null hypothesis that Pooled OLS is an appropriate model based on the fact the p-values (presented in parentheses) are less than 0.05. We then accepted and explored the alternative that REM is appropriate in table 7.
Dependent Variable: CFP
Breusch- Pagan Test ROA Tobin's Q
Cross section 1.054764 7.153116 (0.3044) (0.0075) Time 8.053308 0.184163 (0.0045) (0.6678) Both 9.108072 7.337278 (0.0025) (0.0068)
Table 6.1 showing Breusch and Pagan Lagrange multiplier test results
Random effects Model
It is a model that is used with panel data to obtain regression results that assumes a random intercept for each unit in the cross section, in this case (for each financial institution). This method assumes heterogeneity of the data that is different intercepts for each financial institution, (Gujarati & Porter, 2009).
From table 7 below, we present the results from the REM regression. We find that the significant CSR-CFP relationship that we found in the Pooled OLS regression above disappears. However, we find that at the 5% level of significance, the age and size of the firm respectively, have a positive and negative significant relationship with the firm value as seen in Tobin's Q regression. When the company’s age increases by 1 year, the market value of the
company goes up by 0.7215 units while the market value will go down by 0.4738 units if the company assets increase by 1 million SEK.
In addition to that, the adjusted R-squared value in the ROA regression was lower in REM than it was in the pooled OLS method (8.22% vs 13.53) but was higher in REM than in the Pooled OLS for the Tobin’s Q regression (38.73% Vs 8.32%).
With this information, we did a Hausman test below to decide between REM and FEM for the final regression. Dependent Variable: CFP ROA Tobin's Q Intercept 8.114369 3.531754 (0.4219) (0.0090) ESG -0.152047 -0.000421 (0.1088) (0.8590) Capital Structure -0.787505 0.039425 (0.2364) (0.5145) LnAge -0.339030 0.721521 (0.9019) (0.0457) LnFirmsize 0.634399 -0.473846 (0.4533) (0.0000) Adjusted R-Squared 0.082227 0.387346 F- Statistic 2.388715 10.79978 (0.061247) (0.000001)
Table 7 Showing the REM regression results
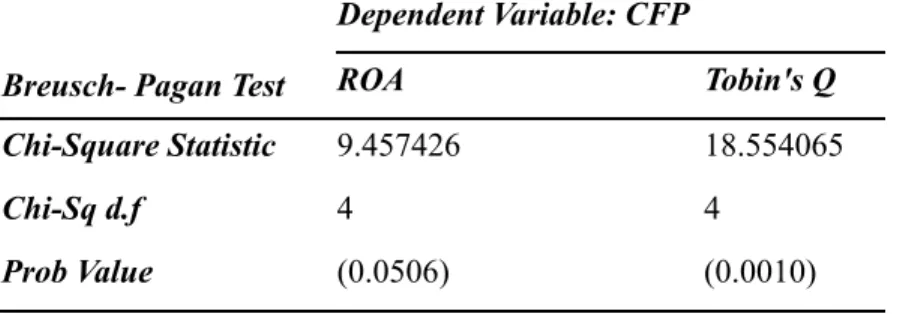
Hausman test
This is a Chi square distribution test used by a researcher to identify whether the random-effects model (REM) or the fixed - effects model (FEM) is appropriate for their data. The null hypothesis for this test is that the REM is appropriate. FEM is consistent in both the
null and alternative hypothesis, but REM is consistent only with the null, (Gujarati & Porter, 2009).
H0: REM is suitable.
H1: REM is not suitable, use FEM.
Dependent Variable: CFP
Breusch- Pagan Test ROA Tobin's Q
Chi-Square Statistic 9.457426 18.554065
Chi-Sq d.f 4 4
Prob Value (0.0506) (0.0010)
Table 7.1 showing Hausman test results
According to the results shown in the table 7.1 above, we reject the null hypothesis in Tobin’s Q regression and accept the null hypothesis for ROA. However, for uniformity, we use FEM for both regressions since it is consistent with both the null and alternative hypotheses.
Fixed Effects Model
In table 8 below, we present the coefficients of the variables and their respective p-values in parentheses, the adjusted R-Squared and F statistic values that we obtained from the FEM regression.
The adjusted R-Squared values for both ROA and Tobin’s Q regressions were higher when the Fixed effects model was used than when the pooled OLS and Random Effects model were used as seen in tables 6 and 7 above. This is an indicator that the model we used fit our data well. From the adjusted R-squared values that we obtained, we can conclude that the independent and control variables account for 26.47% and 98.36% of the variance in ROA and Tobin's Q respectively.
Dependent Variable: CFP ROA Tobin's Q Intercept -308.1925 -6.297255 (0.2005) (0.0910) ESG 0.181598 -0.000635 (0.2576) (0.7953) Capital Structure -0.020754 0.037077 (0.9963) (0.5893) LnAge 76.86633 3.290938 (0.1911) (0.0006) LnFirmsize -2.383022 -0.593502 (0.5791) (0.0000) Adjusted R-Squared 0.264715 0.983640 F- Statistic 2.116050 187.3810 (0.020344) (0.000)
Table 8 Showing the FEM regression results
4.5 Interpretation of the Findings
From table 8 above, we notice that CSR insignificantly affects Corporate Financial Performance with a positive and negative coefficient in ROA and Tobin’s Q regressions. This was based on the fact that the coefficients of the independent variable had P values greater than the conventional significance levels of 0.01, 0.05 and 0.1, i.e., p-values of the ESG coefficient in the ROA regression was 0.2576 and 0.7953 in the Tobin’s Q regression. Against this background, we accepted the null hypothesis of the test that the coefficients are equal to zero and therefore insignificant and concluded that statistically, there is no positive relationship between CSR and CFP.
With that said, using the probability value of the F statistic 0.020344 and 0.0000 respectively in the ROA and Tobin’s Q regressions, we can conclude that the independent variables are jointly statistically significant whereas they are not significant individually as we mentioned above. We therefore rejected our null hypothesis that there is a positive relationship between CSR and CFP in the Swedish listed financial institutions. Furthermore, the control variables
also showed no significant relationship at the 10%, 5% and 1% levels of significance. As a matter of fact, all the variables were statistically insignificant at all the conventional levels of significance in the ROA regression unlike firm size and age of the firm that showed a significant positive and negative relationship respectively, with the firm value measured using Tobin’s Q at the 5% level of significance. This implies that when the company’s age increases by 1 year, the market value of the company goes up by 3.29 units while the market value will go down by 0.59 units if the company assets increase by 1 million SEK.
Apart from the regressions, just through pure observation we noticed that ROA or Tobin’s Q, our measures of CFP of the companies continued to grow despite their ESG scores declining, increasing, or remaining constant. In some instances, CFP declined when the ESG was constant or increased and/or CFP increased when the ESG declined. This was one of the indicators from the data that pointed towards ESG having no positive relationship with CFP. This can be illustrated with the table below.
Financial Institution Years ESG Score ROA
Industrivärden AB 2016 27,63 18,47 2017 33,48 15,25 2018 27,09 -8,26 2019 34,39 28,38 Swedbank AB 2016 80,66 0,91 2017 81,41 0,89 2018 77,8 0,95 2019 40,55 0,85 Investor AB 2016 35,98 9,53 2017 41,84 11,38 2018 45,55 -0,56 2019 50,95 21,69
Table 9 showing the movement of the ESG scores and ROA.
From the table we indicate upward movement in ESG score and ROA with the cells highlighted in green and a downward movement with the cells highlighted in orange. Just like
we explained above there were instances where the ESG score improved in a particular year, but the companies’ financial performance fell and vice versa for example between 2016 and 2017, Industrivarden AB saw a 21.17% increment in their ESG score and a 17.43% decrease in their ROA while Swedbank saw a 4.43% decrease in their ESG score and a 6.74% increase in their financial performance between 2017 and 2018. Obviously, there were cases when ESG improved or declined together with the financial performance but there is no evidence to prove that the better performance was because of their engagement in social activities. Overall, the social engagements did not move hand in hand with the financial performance of the firms as we have been able to see.
In the final analysis, we find that there is no statistical evidence to prove that the institution’s involvement in socially responsible activities has a significant impact on their financial performance. There is no reason to believe that when Swedish financial institutions get involved in CSR, their financial performance is neither worsened nor improved since we found insignificant ESG coefficients.