VTI särtryck
Nr 212 0 1994
Dynamic Testing of Fine Grained
Subgrade oils
aria Arm
Paper presented at the European Symposium on
Flexible Pavements, Lisbon, September 20 22, 1993
Väg- och
tmnspart-orskningsinstitutet
VTI särtryck
Nr 212 0 1994
Dynamic Testing of Fine Grained
Subgrade Soils
Maria Arm
Paper presented at the European Symposium on
Flexible Pavements, Lisbon, September 20 22, 1993
Väg- och
DYNAMIC TESTING OF FINE GRAINED SUBGRADE SOILS
Maria Arm, Swedish Road and Transport Research Institute, Sweden ABSTRACT
The strength properties of ne grained subgrade soils were studied using repeated load triaxial compression tests. The aim was to characterize subgrade soils and to produce input to a mechanistic design model.
In situ samples of soils with nes contents (percent ner than 60 um) ranging from 10 to 100 % (clay, silt, sand) were studied. In total 75 samples from eleven sites were tested.
The resilient (elastic) and the residual (permanent) deformation were recorded during
the test. The resilient strain was used to calculate resilient moduli and the accumulated
permanent deformation was used as a failure criterion.
Complementary analyses in laboratory, such as determination of water content, dry density, plasticity index, capillarity, uniformity coef cient, nes content and clay
content, were carried out.
In order to establish relationship between properties calculated from triaxial tests and properties measured with eld equipments, complementary eld investigations were carried out along with sampling. The following equipments were used, static and dy-namic cone penetrometer, vane apparatus and at some sites FWD. In-situ samples for CBR-tests at laboratory were also taken.
Among the results can be mentioned
stress dependence of resilient modulus for different types of subgrade soils variation in permanent deformation and resilient modulus with water content, dry density, plasticity index, capillarity, uniformity coef cient, nes content and clay content
1. INTRODUCTION
The Swedish road design guidelines are empirical. It means that extrapolation towards new materials or heavier axle loads is not to recommend. Therefore, work with changing them into a mechanistic design procedure is going on.
A mechanistic pavement design is based on design calculations and structural characteristics of soils and granular materials are input to those calculations. This study deals with laboratory testing of ne grained soils to determine their mechanical properties and to produce input to a mechanistic design model. 2. SOILS TESTED
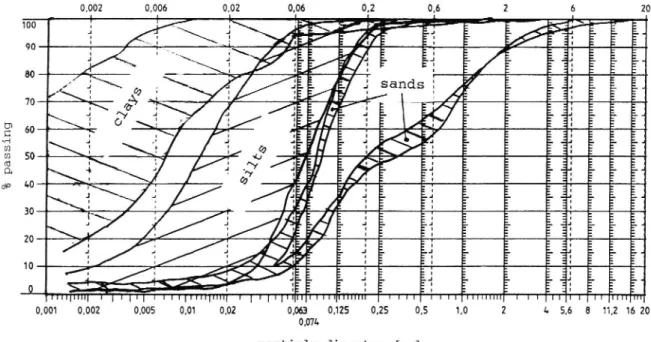
Soils with nes contents ranging from 100 to 10 % ner than 60 um (clay, silt, sand) were tested. 75 in-situ samples from eleven sites in total. Only four were sands, because of dif culties in taking undisturbed samples of sand.
0,002 0,006 0,02 0,06 0,2 0,6 2 6 20 p a s s i n g % | | I J | | I J I | | J | | -L -_ -L -_ _ L -L -_ L _ -S D Ul 0,001 0,002 0005 0,01 0,02 0,063 0.125 0,25 1,0 2 lo 5,6 8 11,2 16 20 0,071. particle diameter [mm]
Fig 1 Particle size distribution of the soils tested
3. PREPARATION OF SPECIMENS
The tests were carried out on undisturbed tube samples from subgrade level at eleven
sites. From each tube (740 mm length, 120 mm diameter) up to three specimens could
be prepared. To be suitable for testing a specimen of 200 mm length i 20 mm must be cut from the tube sample, and must be free from defects such as cracks antkother damages that cannot be repaired during preparation.
A special equipment for trimming test specimens from undisturbed tube samples has been developed at the institute.
The specimen is enclosed by a latex membran, which is sealed with O-rings to the bottom and top platen.
4. TESTING EQUIPMENT AND PROCEDURE
A cyclic load triaxial apparatus with a specimen size of 100 mm diameter by 200 mm height was used. Air was used as the con ning uid. The specimens were undrained during the test.
A constant con ning stress, 03, of 10 kPa was applied to the triaxial specimen by internal pressure in the triaxial cell.
Axial stress was applied by means of a 5 kN MTS servo-hydraulic actuator connected to the loading piston. The axial deformation of the specimen was measured by a LVDT mounted outside the triaxial cell.
The apparatus was computer operated. The resilient (elastic) and the residual
(permanent) deformation were recorded during the test. The resilient strain was used to calculate resilient moduli and the accumulated permanent deformation was used as a failure criterion.
The test started with preconditioning under static load during 24 hours were 01 = 20 kPa and 03 = 10 kPa. This represented the overburden stresses.
In the dynamic test the axial stress consisted of a static part, 20 kPa, and a cyclic part having the form of a half sine wave with a frequency of 10 Hz. The following values
were chosen for the cyclic part, 5, 10, 20, 30, 40 and 50 kPa.
The tests were continued for 105 cycles or until 3 % permanent deformation was reached.
After testing the water content, w, was determined.
Complementary analyses in laboratory, such as determination of dry density, plasticity index, capillarity, uniformity coef cient, nes content and clay content were carried
4 M Alm
5. RESULTS
5.1 Stress Dependence of Resilient Modulus
The resilient moduli, MR and MRdev, were calculated from the applied cyclic axial
stress, Oea, the deviator stress, Odev = 01 - 03, and the resulting resilient axial strain, era, according to:
Odev
Em
Oca
MR = and MRdev :
am
For each specimen there were one MR and one MRdev calculated for each stress level. In the following paragraphes of this paper the MR calculated for Oea = 20 kPa is used, since this stress level corresponds to the stress from normal traf c at road surface about one meter above the subgrade surface.
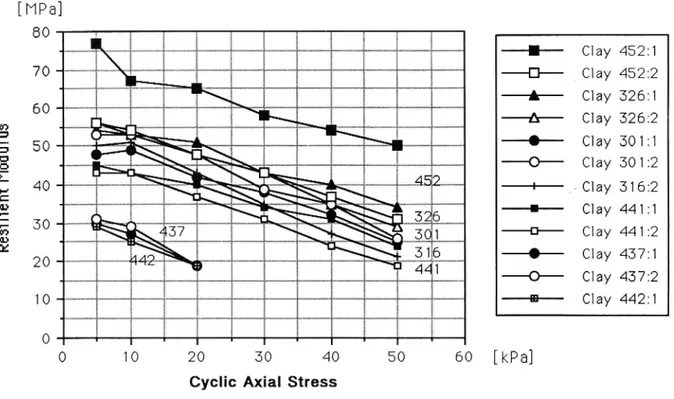
Generally the MR and MRdeV for clays were strongly stress dependent, as can be seen in Figure 2, whereas the moduli for silts showed less stress dependence and also a greater difference between sites, Figure 3 and 4.
Clay
[MPa]
1l - Clay 452 1 _D Clay 4522 -A Clay 326:1 m A Clay 3262%
_o
Clay 30m
"% O Clay 3012 "E _l gClay 3162 .2 l CMy 4414 E _G Clay 44121
_o
Clay 437:1
_C Clay 4372 B Clay 442:1 0 10 20 30 40 50 60 [kPa]Cyclic Axial Stress
Fig 2 Resilient modulus, MR, versus cyclic axial stress, for clays investigated
* **
MArm
Linear regression gives the equation
MR = 56,87 ' 0,54 Oea With r2= 0,53
Regression for MRdev versus deviator stress gives
MRdev = 2724,39 ' OdeV-1 07 With 1'2 = 0,88
Those two equations are only valid for the specimens who were tested at all stress levels. The results from specimen 437 and 442 (Figure 2) were therefore excluded before regression analyses.
The properties for clay specimens are listed in table 1.
Table 1 Properties of clay specimens
Specim W WL Ip clay pdry CBR T MR**
nr [%] [%] content [t/n ] [%] [kPa] [MPa] [%] lab* SCP DCP vane triax
437:1 40 71 36 73 2,5 - (19) 437:2 38 74 39 72 - 2,8 2,2 - (19) 441:1 39 70 37 73 4,9 2,5 >200 40 441:2 34 73 44 71 2,0 >200 37 442:1 38 73 48 71 2,0 >200 19 452:1 36 74 48 70 2,0 >200 65 452:2 35 77 48 73 1,50 1,7 z170 48 301:1 31 66 45 62 - - 42 301:2 30 68 47 59 - 48 316:2 23 72 47 - 43 326:1 30 67 40 64 - - 51 326:2
32 75 48 66
- - 48
Values from three CBR tests with 700 mm overburden. (2,54 mm-values).
MR from triaxial tests were calculated after 105 load applications at 05a = 20 kPa. Value in parenthesis means failure before 105 applica-tions, MR for 437:1 and 437:2 were calculated after 103 applications.
Only four of those 19 clay specimens failed before the test was nished, two failed at
Here is discussed specimens from two sites in the south east of Sweden, in the
at.
following called siltl and silt2. [MPa] Re si li en t Mo du lu s Fig 3 80 70 60 50 40 30 20 O 10 20 30 40 50 60
Cyclic Axial Stress
Resilient modulus, MR, versus cyclic axial stress,
for silt from Åtvidaberg, (siltl)
[MPa] Re si li en t Mo du lu s Fig 4 80 70 60 50
40
30 20 0 10 20 30 40 50 60Cyclic Axial Stress
Resilient modulus, MR, versus cyclic axial stress, for silt from Norrköping, (silt2)
MAtm * Silt 1439:1 _l Silt 144821 D Silt 144822 _i Silt 1450:1 _A Silt 145022 ___-0 Silt 1455:2 [kPa] * Silt 144221 + Silt 143222 _C Silt 130422 __. Silt 1304:1 A Silt 1432:1 + Silt 2433:1 _B Silt 243312 [kPa]
The silts from the two sites had the following properties
Table 2 Properties of silt specimens
Åtvidaberg (siltl) Norrköping (silt2)
dry density 1,47 1,56 t/m3 1,64 1,72 t/m3
w 10 15 % 20 24 %
wL 24 27 % 24 26" %
fines content 40 58 % 43 62 %
capillarity 2,6 3,3 m 2,2 2,9 m
Table 2 shows that silt2 has somewhat higher dry density and almost doubled water content. The other properties are rather similar for those two soils. As shown in Figure 3 and 4 the character of stress-dependence is quite different, siltl has a decreasing MR while the MR for silt2 increases with increasing stress. In the next paragraph is shown that this can not be explained only with difference in water content.
All of the 19 silt specimens failed before the test was nished, the majority (twelve)
failed at 30 kPa, three at 40 kPa, two at 50 and two only reached 20 kPa.
5. 2 In uence ofW on Resilient Modulus
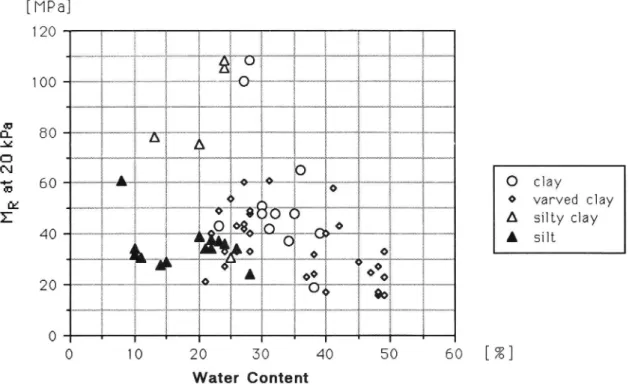
There seems to be no straight relationsship between water content and resilient modulus for any of the soils studied, Figure 5.
[MPa] 120 100 EE 80 x Cl N "Tå 60 O clay m 0 var vedtlay E A silty clay 40 A silt 20 0 0 10 20 30 40 50 60 [%] Water Content
Fig 5 Resilient modulus at 20 kPa vertical stress versus water content, all soils investigated
5. 3 In uence ofW on Permanent Deformation
Only specimens in the silt group show a signi cant relationship between water content and permanent deformation at (Ica : 20 kPa, Figure 6.
[m]
3000 A on n. x D 2000 N"E AHA C) cmy
& AA AA 0 varved clay
E A. A. sHhxcMy ,__ . 31000 A Sllt A Å A I sand A . Å A 0 O oo o O 0 0
0
A
éW ? ?>wa 0°38
0 10 20 30 40 50 60 [%] Water ContentFig 6 Permanent deformation at 20 kPa cyclic axial stress versus water content, all soils investigated
Linear regression gives the equation
perm defzo = -34,74 + 65,35 w
with r2 = 0,63
This equation is valid for 16 silt specimens from four sites.
5.4 In uence of Dry Density, Plasticity Index and Capillarity on Permanent Defonna on
None of those parameters alone shows any signi cant relationship with permanent deformation for the specimens tested.
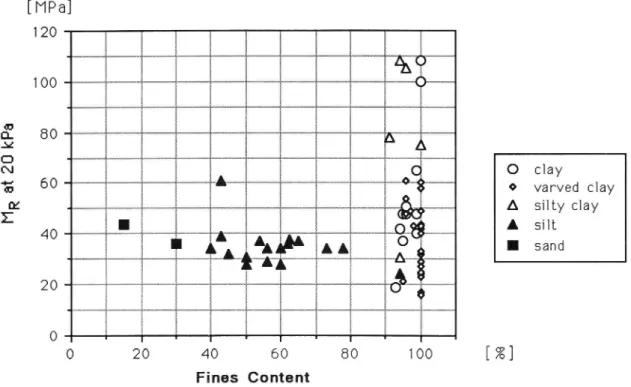
5. 5 In uence of Fines Content on Resilient Modulus
Fines contents are approximately 100 % for clays and therefore only interesting for the silts. For the specimens tested, nes contents varied between 40 and 93 %.
The resilient strain was not affected by the nes content and sequently not the MR either, as is shown in Figure 7.
[MPa] 120 100
&
80
Ja! Cl ni C) chy 15 60 0 varvedl ay :E A silty clay E 40 A. sHt. I sand 20 O 0 20 40 60 80 100 [%] Fines ContentFig 7 Resilient modulus at 20 kPa cyclic axial stress versus fines content, all soils investigated
5. 6 In uence of Fina Content on Permanent Deformation
There is a weak relationship between nes content and permanent deformation for the silt specimens, with the regression equation
perm defzo = -257,0 + 25,38 nes content with r2 = 0,38
(permanent deformation at 20 kPa has been used and ranges between 395 and 2 490 mm, which means 1 975 resp 12 450 ustrain).
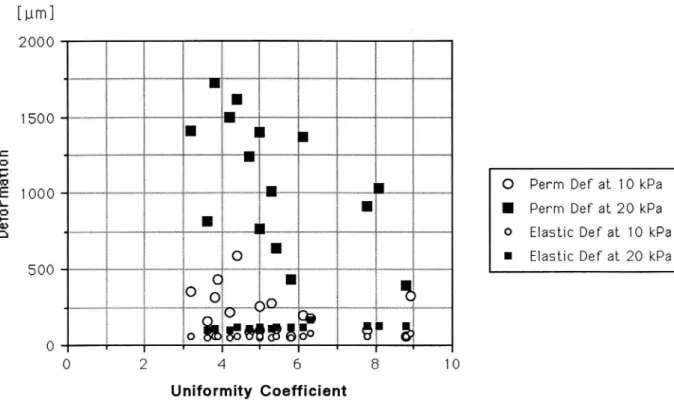
5. 7 In uence of Uniformity Coef cient on MR and Permanent Deformation The shape of the grading curve was also investigated. In the example in paragraphe
5.1, the silt2 specimens had uniformity coef cients, cu, ranging from 3 to 6, whereas
the siltl specimens were more graded with cu between 5 and 9. A linear regression for all silts tested (4 sites) yielded the equation MR = 43,74 - 1,98 cu with r2= 0,56
According to this equation, the more graded a silt is, the lower MR it should have, which is surprising. In Figure 8 is shown that the elastic deformation, from which the
resilient modulus is calculated, increases with increasing cu. However, in the same gure can be seen that the permanent deformation decreases with an increasing uniformity coef cient.
[m] 2000
l
1500 ,ål ål . ' g I iE 1000 ' . o Perm D r t10 kPe a a*:5 I I Perm Def at 20 kPa
a l
c: ' 0 Elastic Def at 10 kPa
o
'
u Elastic Der at 20 kPa
500 o o l % C)0 7(%D ? ' . I O o 85688520" åå & ' T I 0 2 4 6 8 10 Uniformity Coefficient
Fig 8 Permanent and elastic deformation at different cyclic axial stresses versus uniformity coefficient, for silts investigated
6 . CONCLUSIONS
Triaxial compression tests have been done on 75 samples from eleven sites using repeated load.
The tests on ne grained soils are nished for the moment and analyses of the test results are going on. So far the following results have been found for the soils tested - The resilient moduli for clays were strongly stress dependent
. The resilient moduli for clays were more stress dependent than the MR for silts - Regression for MRdev for clays versus deviator stress gave
MRdeV = 2724,39 - (MeV-1,07 with r2= 0,88
- 14 of 19 silt specimens failed under an applied cyclic axial stress, (Ica, of 30 kPa or less.
' - No straight relationship between water content and resilient modulus was found for any of the soils studied
MArm ]]
- A signi cant relationship between water content and permanent deformation at sea = 20 kPa was found for silt
- Neither dry density, plasticity index nor capillarity alone showed any clear relationship with permanent deformation for the specimens tested
- No straight relationship between nes content and resilient modulus was found for any of the soils studied
- For nes content and permanent deformation there was a weak relationship for silt
. The permanent deformation decreased with increasing uniformity coef cient for silts investigated. However, for the same specimens was found that the elastic deformation increased and sequently the resilient modulus decreased with an