~-. 1":\ 41J, -.A .. i. w; 1 I2 13 o I I, . ~f0 g ;
Statens vag- och trafikinstitut (Vl'l) - Fack - 581 01 Linkoping
Nr 109A - 1978
National Road & Traffic Research Institute - Fack - S-581 01 Linkoping - Sweden ISSN 0347-6030
Degradation of steering and
suspension components affecting
driver-vehicle performance
during emergency situations
FOREWORD
The present research was conducted at the National Swedish Road and Traffic Research Institute. Mr Olle Odsell was reSponsible for the vehicles and the tech-nical aspects of the study. Dr Peter W Arnberg was responsible for selection and training of the subjects and the ergonomical aspects of the study.
Particular acknowledgement is due to Mr Olle Nordstrom for his active c00peration throughout the study.
This is the third report in a project that covers effects of component degradation on vehicle handling. The two earlier reports (in Swedish) are:
Arnberg P W, Nilsson A: Performance of the
driver-vehicle system affected by degradations, - a literature survey. (1976)
Arnberg P W, Nilsson A: Performance of the driver
vehicle system affected by degradations in steering and suspension components. (1976)
CONTENTS ABSTRACT SUMMARY BACKGROUND General Literature search Previous study METHOD General
Lane change manoeuvre
Surprise situation Subjects Training Vehicles Procedure Measurements Ratings RESULTS General Speed Side acceleration
Steering wheel angle sum Steering wheel movements
Number of cones hit
Surprise incident
Ratings of handling qualities DISCUSSION
Evaluation of the method Evaluation of the results LITERATURE REFERENCES
VTI REPORT NO. 109A
Page II
e
wH
H
o o o o m m m m 10 13 15 15 15 16 16 18 18 20 21 22 24 24 26 3ODEGRADATION OF STEERING AND SUSPENSION COMPONENTS AFFECTING DRIVER-VEHICLE PERFORMANCE DURING EMERGENCY SITUATIONS
by Peter W Arnberg and Olle Odsell
National Swedish Road and Traffic Research Institute Fack
8-581 01 LINKOPING
ABSTRACT
The report deals with the effects of free play in steering and wheel suspension components on vehicle handling, with special attention to the performance of the driver/vehicle system in emergency situations.
A field study has been carried out in which 33 subjects
drove a Volvo 142 and a Saab 99 in both original condition and with certain degradations in steering
and wheel suspension. The cars were driven on a test track where the drivers were exposed to two different types of surprise situations in which quick avoidance manoeuvres were necessary. The cars were equipped with
instruments for the registration of speed, side
acce-leration, and steering wheel movement. After having driven the cars, the drivers made a comparative rating of the handling qualities of the cars.
The test method used in the study is evaluated and a comparison. is made with other methods for testing vehicle characteristics. Based upon the results from the present study and from other similar studies, in USA and Sweden, conclusions are drawn regarding the effects of free play in steering and suspension on
vehicle handling and traffic safety. Consequently, some
general recommendations are given for the evaluation
of degradation in steering and suspension components at annual vehicle inspections.
II
DEGRADATION OF STEERING AND SUSPENSION COMPONENTS AFFECTING DRIVER-VEHICLE PERFORMANCE DURING EMERGENCY SITUATIONS
by Peter W Arnberg and Olle Odsell
National Swedish Road and Traffic Research Institute Fack
8-581 01 LINKUPING SWEDEN
SUMMARY
The purpose of this project is to investigate the effects of free play in steering and wheel suspension components on the handling of passenger cars. Earlier tests within the project have proved that average drivers are able to compensate for degradations in steering and wheel suspension surprisingly well, and to drive vehicles impaired by such defects on roads and on difficult test traCks with almost intact preci sion. Despite this fact, many drivers have judged these
vehicles to be unsafe in traffic, due to bad handling
characteristics. A conceivable eXplanation of this difference between the drivers' judgements and their results is that the drivers may doubt their ability to compensate for the degradations in emergency situations as they can in well trained test situations.
In the test described in this report 33 drivers drove, either a Volvo 142 or a Saab 99 in both original condi tion and with certain degradations,on a closed test track. During the drive they were eXposed to situations in which they had to make avoidance manoeuvres, like when an obstacle suddenly appears on the road. In parti
cular, two situations were studied, one where the dri
ver was prepared to some extent to make an avoidance manoeuvre, and another where he was completely unprepa
red. The speed, lateral acceleration and the steering
wheel movements of the cars were registered. as were
the number of lane marking cones hit and whether a sudden-ly appearing obstacle was run over or not.
III
The results show that driving precision was almost
exactly the same with the degraded vehicles as with the
original ones, and the recorded values didn t show any
greater risk for loosing control of the vehicles with degradations. However, the degraded vehicles required more steering activity from the drivers. It can be argued that this would be tiring, but earlier tests within the project has shown that average drivers can Compensate very well for free play even during long driving periods.
The behaviour of the driver dominates the system and the driver has in all tested driving-tasks been able to compensate for the degradations in steering and wheel suspension. Generally, the drivers noticed the defects in the cars and some of them judged the worn cars as unsafe in traffic. It seems that free play in the steering gives the driver an uneasy feeling, and therefore drivers tend to exaggerate the importance of the degradations with regard to traffic safety.
The investigations conducted so far indicate that free play in steering and wheel suspension componentsdoes not affect the handling characteristics of the vehicle
to such an extent that it can be regarded as unsafe in
traffic. But that does not mean that free play is accep table without reservations. Generally applicable limit values for free play in steering and wheel suspension components cannot be given on the basis of impaired
handling characteristics alone. The limit values should mainly be based upon the risk of component failure
(e.g. separated ball joints), and upon economic consi-derations as well, (e.g. if free play in tie-rod ends causes increased wear of tires). Free play in tie-rod ends and in bushings of the wheel suspension may, when
braking, give steering effects of different size
depen-ding on the design of the chassis. The path deviations are normally small, especially when the driver
IV
sates with the steering wheel, but earlier tests have
shown that assymetric play in the bushings for live rear axles can produce rather large path deviations
when braking.
The judgement of free play at the mandatory periodic vehicle inspection in Sweden is based mainly upon the above mentioned factors and because of that very small amounts of play are accepted in ball joints. In other components, where the risk of total failure is very small, larger amounts of play can however be
tolerated-It is essential to point out that the degradations mentioned in this study would be the result of normal wear. Very large amounts of free play in,for instance, the steering is normally the result of some component
failure, and this can be immediately be seen to be
unsafe because important information from the steering wheel about the vehicle and the road is significantly
decreased.
The tests which were carried out addressed themselves
to certain components only, and combinations of many
components with free play as well as other vehicle
para-meters, such as heavy loads, defective shock-absorbers,
low air pressure in the tires etc, were not tested. It can be assumed that the effects of free play are larger
at high speeds, but the driving tests have, of
safety reasons been made in relatively low speeds. However, despite this, the results provide no reason for changing the criterion used today for judging free play in steering and wheel suspension, at the periodic technical inspection of passenger cars in Sweden.
BACKGROUND
General
During the past few years periodic vehicle inspection has become compulsory in many countries (in Sweden since 1965). As a consequence of this, interest has increased
in studies on the effect of wear and tear, adjustment,
and free play on vehicle handling characteristics.
It is generally assumed that a vehicle with high de-grees of wear in several components, is a greater risk in traffic than a new vehicle. This is not only because the probability of breakdown of components such as the
tie-rod ends, the brake cylinders, etc is increased,
but also because it is felt that worn components degrade
handling.
Despite this assumption, very little is known about which worn components have the greatest effect on the driver/vehicle system. Similarly,it is not known to
what degree a component or a group of components in
combination may be allowed to deteriorate before they
effect the vehicle's handling characteristics to the extent that the accident risk is increased.
Many investigations have been carried out to determine the proportion of total accidents than can be directly attributed to component wear. The results of these studies vary considerably. However, the majority of
them state that vehicle defects were the direct,
contributing or possible contributing reason for 3 to
25% of the investigated accidents.
When looking at the mechanical defects,faulty brakes and defective tyres were cited most often. Although
statistical data for defects in steering or wheel
suspension is very limited, several investigators state
such defects were possibly the main contributing factor
in l - 5% of traffic accidents.
The question of car handling and its importance to traffic safety is difficult to answer. For example, is
it necessary to specify a standard for each make and model of car,or is it enough to set a general minimum
vehicle standard? According to an extensive study in
the USA (Fancher et al 1972) the difference in handling
between new passenger cars of different types and models is greater than the difference between new and used
vehicles of the same type. From a safety point of view perhaps one should concentrate on those vehicles which have the worst handling characteristics. On the other hand, a general improvement of the vehicle pOpulation
will take place if degraded vehicles, which originally
handled well, were also repaired.
The main difficulty today is that there is no generally accepted way to objectively measure vehicle handling
with regard to safety,and therefore,it is not possible to determine any minimum standards. Investigations
continue in this area both in Sweden and internationally but until measures are develOped, it is often necessary
to resort to comparisons of simple values, such as maximum speed, lateral acceleration, and subjective
judgement on handling.
Theoretically the best method for determining acceptable degradations would be to study how drivers cope with driving defective vehicles in real traffic situations. However, this is not only potentially dangerous but also means that complete control of trials and subjects
is virtually impossible. Therefore, it is necessary
to conduct experiments on closed tracks in simulated
traffic situations.
In the past when measuring vehicle handling
characte-ristics, researchers have tried to minimize the effect which the driver has on the test. This has been done by using trained test drivers, by establishing
well-defined steering manoeuvres (e.g. turning the steering
wheel to a predetermined position), or by eliminating
the driver entirely by using automatic steering. Such so-called "open lOOp" tests give very good opportunities to compare objective measurement data because such
tests are almost completely reproducable.
These tests, however, need to be viewed very carefully since it is not necessarily true that the measurements obtained are relevant for normal drivers in traffic. Therefore, in order to ensure that the results from a test are generalizable to the traffic situation, an
"open lOOp" test must be combined with the so called "closed loop" test. In closed 100p tests the driver
adjusts the vehicle's movements during driving. In this way it is possible to determine whether or not the driver can compensate for the vehicle's altered characteristics. To lessen the influence of different driver behaviours in such tests,many subjects need to be used. Then powerful statistical methods can be used which allows accurate measurements of performance across degree of mechanical fitness of the vehicle.
Literature search
A search of available literature regarding the effects of component wear on handling was carried out. Three rather extensive reports dealing with the problem were found, (Clayton Manufacturing Company 1969, Cornell
Aeronautical Laboratory 1971 and Highway Safety Research
Institute, Michigan 1972). The Michigan study reports
results from an extensive simulation program. The
program calculated how alternations in different vehicle
components,affected vehicle handling in six different well-defined manoeuvres and showed which components were most likely to have an influence on vehicle handling. To further study the effect of these critical components
a full-scale test using real vehicles was also under
taken.
The results of the three reports were in some cases
contradictory, but all concluded that reasonable amounts of free play in steering and wheel suspension compo-nents does not necessarily degrade vehicle handling to
a great extent. It is important to note, however, that all three of these investigations have dealt with
hand-ling at the limit of the vehicles' capacity, (i.e. so called "limit performance"). They have also typically used automatic steering devices or trained test drivers
with high levels of preparedness who drove vehicles for
very short times. It was therefore felt that it was necessary to investigate how "average" drivers can cope with degraded vehicles during "normal" driving for long
periods of time.
Previous study
In 1974 75 the National Swedish Road and Traffic
Research Institute (VTI) carried out a test in which
12 "average" drivers each drove 9 vehicles with different
degradations, ranging from front end misalignment to
free play in steering and wheel suspension components.
The degraded components in the test were chosen on the basis of the results from the report by the Highway Safety Research Institute in Michigan. The vehicles
were driven on a test track for almost two hours. The
track consisted of three different manoeuvres: a straight
line tracking task, a double lane-change and a serpentine
tracking task. During these manoeuvres, speed, steering
wheel angle,yaw velocity, lateral acceleration and the
vehicle's tracking error from the mid-line were recorded. After the test, the drivers judged the handling and
traffic safety of the different vehicles.
The results showed that normal drivers can compensate even over long periods for relatively large amounts of free play. However, despite the results, drivers judged
that several of the defective vehicles were extremely difficult to handle and that these vehicles should not be allowed in traffic. This discrepancy suggested that further research was necessary to investigate whether the drivers' judgements of the defective vehicles'
traffic safety were justified or not. Perhaps the drivers
were afraid that they would not be able to compensate for the defects in the same way in an emergency situation. The following work within the project was therefore
oriented towards degraded vehicles in emergency
situa-tions and the current report investigates whether "average" drivers can adequately compensate for free
play in steering and wheel suspension components even in critical situations, i.e. when an unprepared driver has to quickly manoeuvre the vehicle out of a poten
tially dangerous situation.
METHOD
General
It is, of course, difficult to simulate a realistic
surprise situation which can be repeated several times with the same subject. Since the object of the experiment
was to compare the characteristics of vehicles in
different conditions, it was necessary to restrict the
drivers to a pre-determined set of steering manoeuvres
that could be repeated. To accomplish these goals, the
test was divided into two main situations, one where
the driver was required to complete a trained avoidance
manoeuvre but without knowing when, and another where
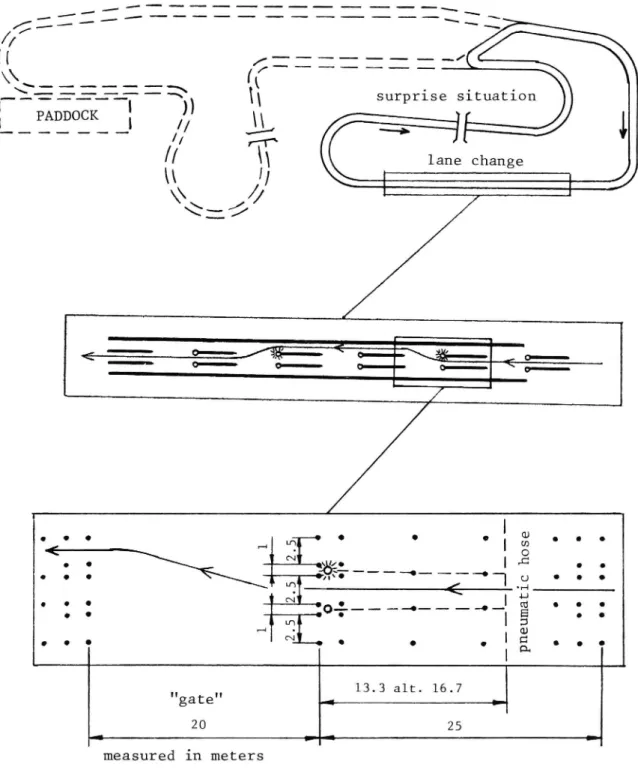
the driver was totally unprepared. The test was con-ducted on a 1.7 km long 100p track at the Scandinavian Raceway in Anderstorp, (see figure 1, 2 and 3).
Lane change manoeuvre
Approximately 400 meters of the straight track was marked with plastic cones to give three lanes for a
lane change manoeuvre.
In this test a lane change could be required at any one of 10 "gates" by a light signaling system. The driver was required to change lanes and drive through
a gate When the light in front of the gate was lit,
otherwice the driver was required to drive straight ahead. By using a control panel located at the side of
the track, the experimenter could, before each run,
choose which course a vehicle should take as it went
through the track. The light at each gate entrance was
activated as the car drove over a pneumatic hose at
a pre-determined distance from the gate.
Because of the relatively short pre-warning time and because the driver did not know when and how often a lane change was required, the test situation provided an element of uncertainty despite the well rehersed
nature of the task.
06"
x
H
/ :: : :
-
-V\ ____________i__ ((f _ '- i ..._\.._-':: ::_._ _T ' surprise situationL ... If???
__..__ ////
. r
r1S
l
// 3 lane changeIA!
_1
o-I--i
- _ \_i
i
1 // g1o o . -4 "21H o o o I| (D8 o o o. o
N @34-
"c
' '
o 0 O ¢lltT- - -_..l U 0 O O2
<
'H
o O 0 N 4.00 _____ _____.__ in) o o o . o : 7 | E o oJ 2
a
o O O 0 O o O Q (I I H n 13.3 alt. 16.7 gate 20 25 7* measured in metersdots mark plastic cones
Figure 1. Test track at Scandinavian Raceway in Anderstorp
Surprise situation
In a separate section of the track loop, an isolated
surprise situation was created. A 150 x 40 cm cylindri-cal styrofoam filled rubber bag was drOpped in front of the car from a container attached to the underside of a bridge spanning the track. The bag was completely
safe to run over and it could be drOpped at a chosen time before the vehicle passed under the bridge. The aim was to cause a surprise situation in which the driver was forced to execute a vigourous lane change manoeuvre in order to avoid running over the obstacle. The subjects were asked in advance whether they could accept being exposed to a total surprise situation
and none refused.
Subjects
A total of 33 subjects was used, 16 drove one car and
17 the other. All subjects were men aged between 20 to 60 years who had regularly driven at least 10 000 kilo
meters per year during the last three years.
To lessen the need for training on the two types of car used, the subjects were chosen, with the help of
the local car salesmen's register, from owners of
either a Volvo 140 series or a Saab 99. They werewell paid and highly motivated to participate in the
experi-ment. Training
The drivers were familiar with the type of vehicles used in the experiment but extensive training was required to get the subjects aquainted to the lane change signaling system.
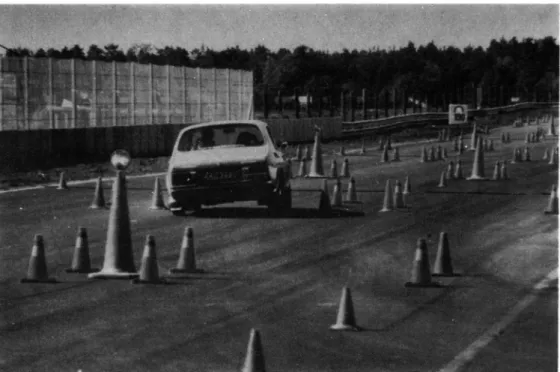
Figure 2. Lane-change track
..«.4.\. i.7».uu».. ..7.
.ka»M.. . w-l ~WNW-....».&WW.W
Mm, Wu...
M .» ...
Figure 3. Surprise obstacle falling from bridge
10
Training was done in the subjects' own cars in two stages. The first stage consisted of subjects driving behind a research vehicle at a relatively low speed to learn the track, while the second stage consisted of individual instruction. Continous information was
given by the experimenter concerning what mistakes the driver had made (e.g. braking, driving over cones). The subjects drove one by one and gradually increased their speed until they could easily drive through the entire track at 60 km/h.
Vehicles
Two 1972 cars were used: a Volvo 142 and a Saab 99,
both equipped with automatic transmission. Measurement and recording instruments were mounted in the back seat. The experimenter sat in the front passenger seat. Both cars were equipped with Michelin ZX steel radial tires, set to a pressure of 180 kPa all round. Each vehicle was driven both in original and defected condi tion, (free play in the steering and the wheel suspen sion). In this test only those defects which were
judged to be the most serious in the previous experi
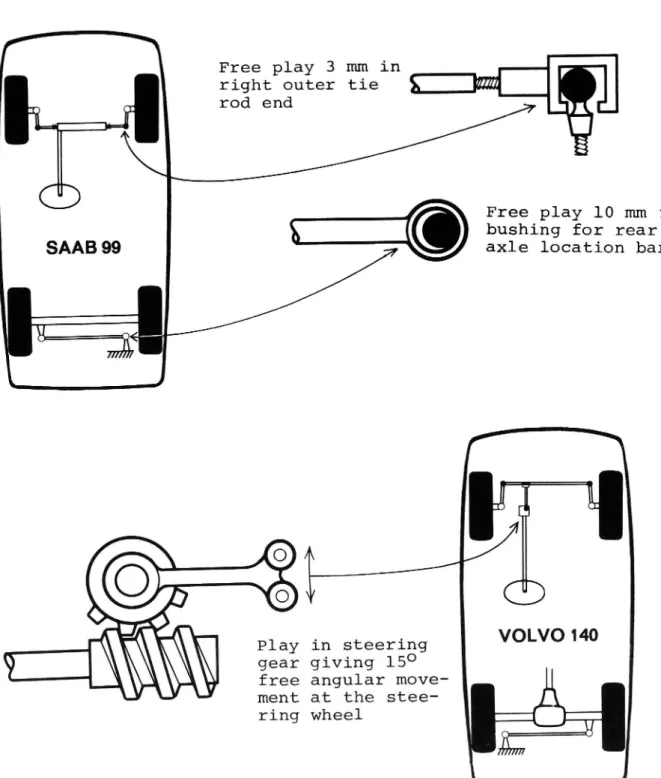
ment (Arnberg & Nilsson 1976) were used. These defects were (see figure 4):
Volvo 142 Play in steering gear giving 150 free
angular movement at the steering wheel when the wheels were oriented straight ahead. This was achieved by unscrewing the
adjust-ment screw on the steering box.
Saab 99 Free play 3 mm in right outer tie rod end and 10 mm free play in bushing for rear axle location bar. These defects were
achieved by replacing the original components with machined components.
11
Figure 4. Simplified illustration of test vehicles with.defects in steering and wheel suspension
' Free play 3 mm in
right outer tie rod end
SAABQQ
4%
axle location bar
Free play 10 mm in 8 bushing for rear
in steering giving 150 angular move-at the stee-ring wheel
12
Procedure
The subjects drove each test car for two 45-minute sessions after becoming familiar with it on the way to the test site from the paddock (~ 1 km). During the
first test session half of the subjects drove cars in the original condition and the other half drove cars
which had been modified. The subjects naturally did
not know in advance the condition of the test cars.
Each test session consisted of eleven laps of the
track lOOp. The first two laps were considered training laps with only one or two lane changes per lap. Then three laps followed with three lane changes per lap. Before these laps the subjects were instructed to concentrate fully, because many lane changes would occur during each lap. The test session ended with six laps in which the drivers were instructed to drive in a relaxed manner, because only a few lane changes would
be required during the six laps. During three of these
laps, no lane changes were required while during the remaining three, one or two changes were required.
For the first 16 subjects (8 on each car) the lights were set to light up one second before the car reached
the gate (at 60 km/h). For the rest of the subjects,
the pre warning time was decreased to 0,8 seconds to further increase the effect of surprise.
After the subjects had driven the eleventh lap and were on their way back to the paddock, the obstacle was drOpped in front of the car from the bridge. The container holding the bag was opened when the car was at a distance of 40 meters from the bridge. It took approximately 1 second from the time the container was Opened until the obstacle reached the ground. Since the drivers could see the obstacle when it was in the air, they had at least 2 seconds to execute an
avoid-ance manoeuvre .
13
The second test session included the same program in
the lane change track as the first, except that the
laps were driven in a somewhat different order. This was done in order to counteract the previously learned patterns. The obstacle at the bridge was dropped during the sixth lap, i.e. the first lap in the section of
"relaxed" driving.
Measurements
The following measurements were taken for all cars:
1. Speed (a control variable)
2. Maximum side acceleration (giving a measurement of
how much of the available friction was used)
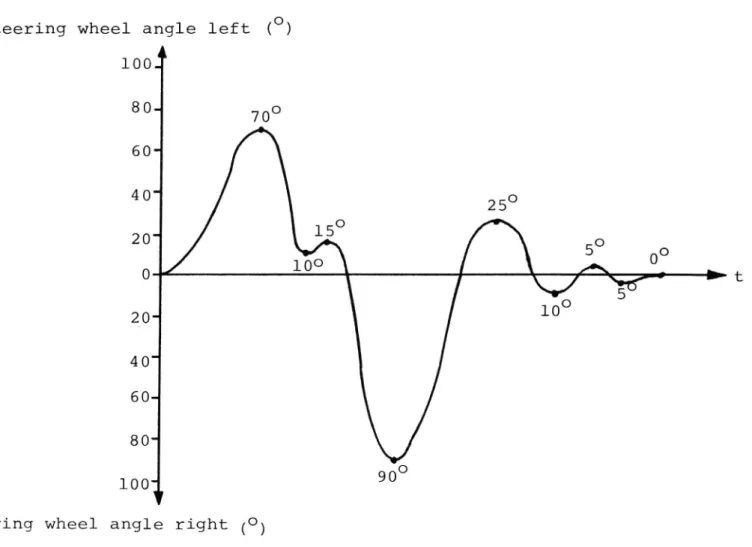
3. Steering wheel angle sums (total of degrees turned
during a steering manoeuvre, see figure 5)
4. Steering wheel movements (stating how many steering wheel movements of various sizes were made during a
steering manoeuvre. Steering wheel movements were measured in five different intervals: 4 - 120,
12
200, 20
280, 28
figure 5).
360 and over 360, see
Recordings were made during one lane change per lap as well as during the surprise incident. The measurement equipment was started and stOpped at the same distances
before and after each measured steering manoeuvre.
These distances were chosen so that the vehicle was stable and was being driven straight ahead both at the beginning and at the end of the recording period.
ThexunMxmrof cones knocked down and whether the surprise
obstacle was hit were also recorded.
The accelerometer was placed on the floor behind the front seats. As no compensation was made for the roll
l4
steering wheel angle left (0)
1003
80
7o
60-40'20
15
100204
40' 60-80'1001
V
steering wheel angle right (0)
steering wheel angle sum steering wheel 90 movements number
>360
4
280-360
1
200 280
0
120-200
1
40-120
3
O totally >4 9==7OO+6OO+50+1050+1150+350+150+lOO+50==4200
Figure 5. Registration of steering wheel angle sum and
steering wheel movements
VTI REPORT NO. 109A
(example)
15
of the car, the side acceleration values should not be
considered as actual lateral acceleration values.
Ratings
Following each drive, the drivers were asked to evaluate the vehicle's handling. After the completion of all
testing they were asked to rate which Vehicle was best, why, and what differences they had noticed about the cars. They should also state if they considered that any of the vehicles would be unsafe in traffic and make a comparison with their own cars.
RESULTS
General
The lane change test was relatively difficult concep-tually, and it was considered to be near the performance limits of an average car driver. Although the prescribed speed of 60 km/h produced rather high lateral accele rations, there was very little risk of loosing control
of the vehicle. The maximum side accelerations measured
was in the order of 5 - 7 m/sz, i.e. about 0.5 - 0.7 g
(g = gravity 9.81 m/s2). As the friction number was
estimated to approximately 1.0 on the dry track, a
relatively good margin was available.
In the beginning of the training, many subjects were doubtful if they would be able to perform the lane changes at 60 km/h, but most drivers learned the task quickly. It was obvious that many of the subjects had never driven a car in such a demanding manoeuvre and they expressed surprise that it was possible to steer a car through such sharp turns at the prescribed speed.
16
Speed
With very few exceptions the subjects were successful in maintaining a constant speed during the lane changes. The difference in the arithmetical means (see figure 6) between original and degraded vehicles was not
signifi-cant. The difference between the Volvo and the Saab
can believably be due to the fact that the speedometer
in the Saab was more stable and easier to read than
that in the Volvo. V
Side acceleration
The maximum side acceleration during a steering manoeuvre varied considerably for the same person during different lane changes, depending on how quickly he reacted to the light. If one looks at the individual mean side acceleration during the test, there is no tendency for higher values with either of the vehicle conditions. The mean side acceleration for all subjects together show the same result, - no significant difference bet-ween original and degraded vehicles -, (see figure 6). To test whether difference in mean speed affects the
comparison, a standard for side acceleration at 60 km/h
was calculated using the following formula:
2
a60 km/h = ( 79)
° a (In/32)
The formula is derived from the formula for centripetal
acceleration:
2 e
v ac = r
The standard implies that the vehicle is driven with
the same curve radius r as in the real measurements but
with the speed 60 km/h instead of with the real speed
V T I R E P O R T N O . 1 0 9 A
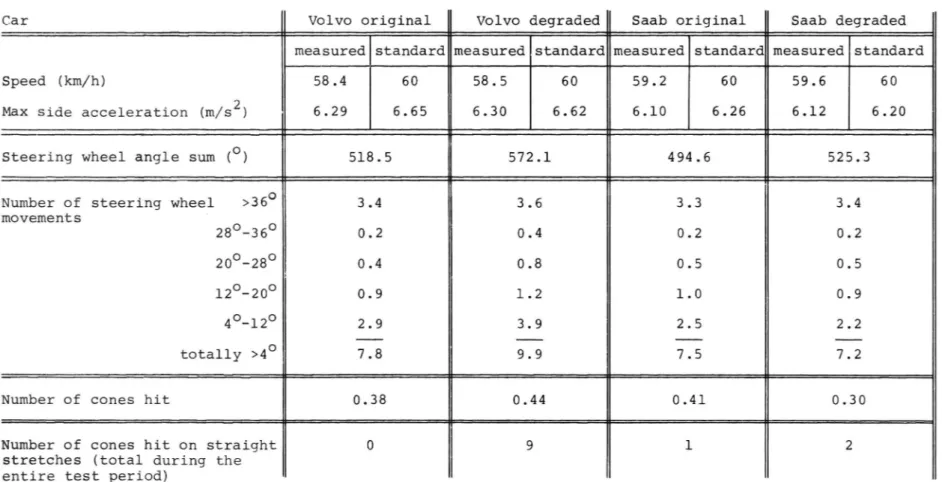
Figure 6. Arithmetical means per lane-change for all subjects (a total of
469 lane changes : Jr 31 subjects)
Car Volvo original Volvo degraded Saab original Saab degraded
measured standard measured standard measured standard measured standard
Speed (km/h) 58.4 60 58.5 60 59.2 60 59.6 60
Max side acceleration (m/sz) 6.29 6.65 6.30 6.62 6.10 6.26 6.12 6.20
Steering wheel angle sum (0) 518.5 572.1 494.6 525.3
Number of steering wheel >36O 3.4 3.6 3.3 3.4
movements ' 280-360 0.2 0.4 0.2 0.2 200 280 0.4 0.8 0.5 0.5 120 20O 0.9 1.2 1.0 0.9 40-120 2.9 3.9 2.5 2.2 totally >4O 7.8 9.9 7.5 7.2 17
Number of cones hit 0.38 0.44 0.41 0.30
Number of cones hit on straight 0 9 l 2
stretches (total during the entire test period)
U)
18
V km/h. The standard does not produce any significant
differences in side acceleration and therefore does
not alter the previous conclusions.
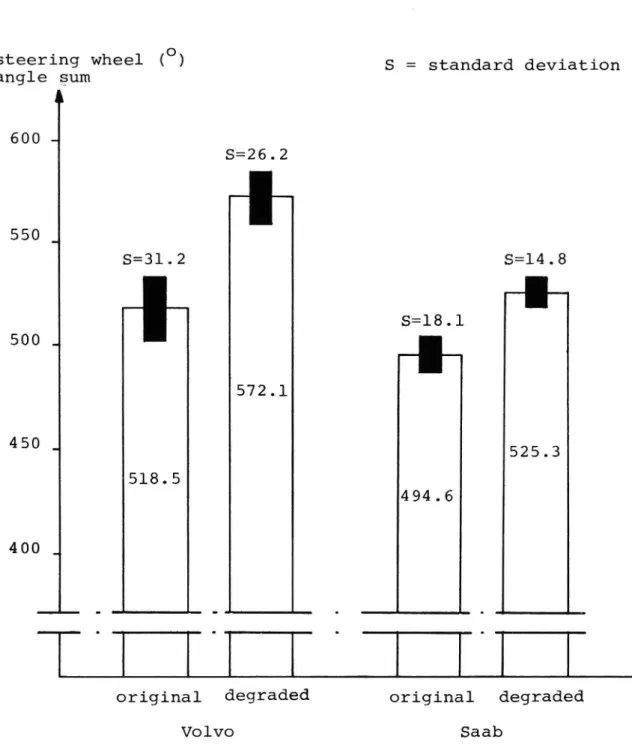
Steering wheel angle sum
The steering wheel angle sum show the sum of all steering wheel movements during a manoeuvre and can therefore be called a measure of drivers' performance. Both the Volvo and the Saab present significant
differences (dependent t-test 5% level, Ferguson 1966)
in the arithmetical means for all subjects (see figure 7).
The greater differencevnij1the Volvo was possibly due to the amount of "play" in the steering at midpoint; approximately 150 in the modified form, as compared with approximately 40 in the original form. In the Saab
no equivalent difference in "play" existed because only
the tie rod at one front wheel was modified for free
play.
Steering wheel movements
The number of steering wheel movements of different size gives a further measurement of the driver's
per-formance.
The degraded Volvo required more steering wheel move-ments than the original vehicle, in all movement size classes. This was to be expected due to the nature of the modification. In particular, the number of small steering wheel movements increased considerably in the defective car, and it was seen that it demanded greater
attention from the driver.
The small differences in steering wheel movements found
l9
. o
Steerlng Wheel ( ) S = standard deviation
angle sum 600 S=26.2
550
S=3l.2 S=l4.8 S=18.l 500 - II 572.1450 -
525.3
518.5 494.6 400 woriginal
degradEd
original
degraded
Volvo Saab
Figure 7. ArithmeticalIMEnusfor steering wheel angle sum per
lane change
20
with the Saab are not significant.
Number of cones hit
The function of the plastic cones was to mark the track
exactly so that the lane change test could be
repli-cated accurately on each session. However, depending on the driver's attentiveness, reaction time and driving ability, the path taken varied a lot. During the first half of the test (with a one second pre-warning), very
few drivers failed to turn into the correct gate. However, during the second half (prewarning of 0.8 seconds) several drivers reacted too slowly to success
fully complete the lane change. For the entire test,
an average of one cone was knocked over at every third lane change. However, the spread between different drivers was large. The cone most often knocked over was the one in the inner-turn when driving into the
new lane.
No significant differences were found between the mean number of cones knocked over per lane change for the original and modified vehicles. Most of the drivers drove over somewhat fewer cones during the second test drive than the first.
In a few cases, cones were driven over even on straight stretches between gates. Here, a significant difference
was found between the Volvo's two different conditions.
Thus, a total of nine cones were knocked over by the defective Volvo while no cones were knocked over by the Volvo in original condition. This shows that it
was more difficult to keep the degraded Volvo on a
straight course in the 2.5 m wide lanes.
21
Surprise incident
The rubber bag drop from under the bridge was a total surprise for the drivers on the first test drive. During
the second test drive they were more cautious when driving past the bridge, but many admitted that they
were surprised even the second time. They had expected that the obstacle would drop again during the last lap
and not during the middle of the test drive.
Immediately after the surprise incident, the drivers
were interviewed by the experimenter (a psychologist)
concerning how they had experienced the situation. Almost all of the drivers felt the situation was
realistic and many were shaken by how ineffectively
they had reacted - even those who had succeeded in
avoiding driving over the obstacle. All subjects thought
that the test was fruitful and instructive.
Most drivers made an avoidance manoeuvre to the left
without braking, some veered to the right off the track, and in several cases the driver drove straight onto
the obstacle with almost no decrease in speed. Although the drivers in general were aware of the obstacle
approximately 2 seconds before they reached it at
60 km/h, the obstacle was run over in 25% of the cases.
It was run over more often in the first test drive than in the second (39% and 10% respectively).
Another 20% of the cases were not usable for evaluation
since the driver drove too slowly, drove in the middle of the road or braked suddenly. The remaining cases
(55% of the total) managed to avoid the bag with
comparable manoeuvres, and they resulted in the following arithmetical means for side acceleration and steering wheel angle sums:
22
Volvo Saab
original degraded original degraded
Side acceleration 6.9 7.3 6.4 7.0
(m/sz)
Steering wheel angle 652 704 459 546sum (0)
The variation around the means was large. Scores
depended on how early the driver noticed the obstacle, in which direction he swerved and where on the track he was driving beforehe saw the obstacle. Statistical
tests (independent t-test 5% level, Ferguson 1966) showed that although the relatively large differences between the means, they were not significant, except
for the steering wheel angle for the Saab. However,
due to the inaccuracy of the means (because the above variation) no definite conclusions concerning the effect of the degradations can be drawn.
Ratings of handling qualities
After each test session the driver was asked to rate
the handling and the safety of the driven car.
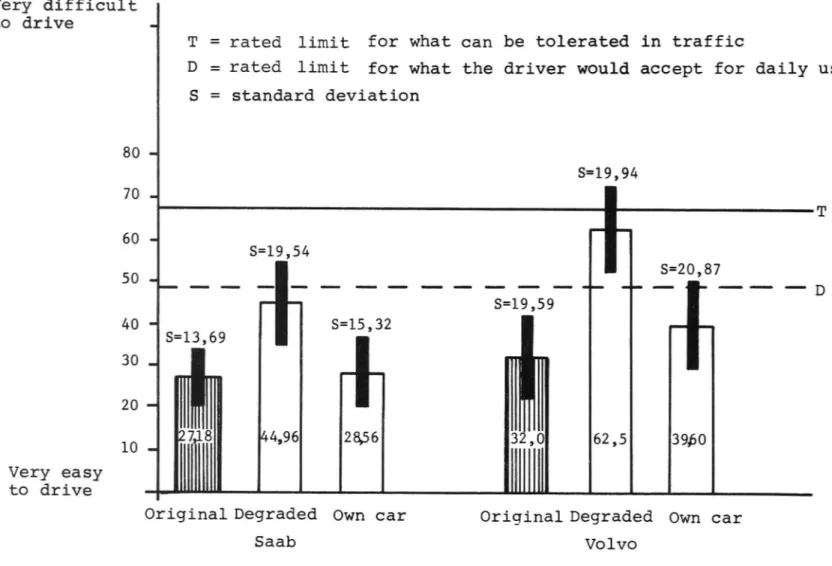
The degraded vehicles were rated to be considerably
worse than those in original condition and considerably worse than the drivers' own cars (see figure 8). For both the Saab and Volvo the differences between the ratings of the defective vehicle and the original
vehicle and between the ratings of the defective vehicle
and their own vehicle are significant (dependent t-test 5% level, Ferguson 1966). The degraded Saab was rated
V T I R E P O R T N O . 1 0 9 A Very difficult to drive
rated Jjnui; for what can be tolerated in traffic
rated ljh i: for what the driver would accept for daily use
II II [-1 Q standard deviation S: Very easy to drive
Original Degraded Own car Original Degraded Own car
Saab Volvo
Figure 8. Rating of handling qualities
24
to be at the end limit for what the driver would accept
for daily use but it was well within the traffic safety limit. The defective Volvo was, however, near the
traffic safety limit, and about half the subjects felt
that it would be dangerous in traffic. The ratings were very compatible with the ratings of the same vehicles in the previous test, (Arnberg and Nilsson 1976).
The free play in the steering of the Volvo was noticed by most subjects and this probably affected their
ratings. The defects on the Saab was somewhat harder to notice, as the tie rod end on only one front wheel had free play. Many of the drivers could not determine what was wrong with the Saab, but some thought that
the car's handling was "untrustworthy".
DISCUSSION
Evaluation of the method
The short pre warning time (0.8 1 second) during the lane change test made the driving task relatively
difficult and the drivers had to be very attentive when
driving past each pair of lights. The surprise level was not especially high, but even so it was considerably higher than on the marked-out lane change track used
in the earlier experiment (Arnberg and Nilsson 1976)
where drivers knew in advance exactly how they should drive. The short pre-warning time meant that the drivers did not have enough time to compensate for possibly
known defects in the car, as is the case in critical
traffic situations.
The dropped bag V s completely unexpected the first
time,5MMieven the second time most drivers were not
expecting it. The incident was experienced as very
25
realistic and many subjects felt that all car drivers should be exposed to such a situation so that they
could better judge risks in traffic and be aware of
their own driving limits.
The surprise was so great that afterwards many subjects had difficulty in describing how they had reacted and
how the car had handled. For this reason, many could not judge the handling characteristics of the car in this situation. However, speed, side acceleration and
steering wheel movements were recordedand these values
together with observation could provide a good
description of the incident. Those drivers who swerved
past the obstacle generally attained side accelerations
of the order of 0.6 - 0.8 9. These very high values can be compared to the values of 0.2 - 0.4 g which are normally seen in traffic (Bergman 1973, Arnberg 1976). It is, however possible that the high side acceleration values recorded at the drop of the bag partly were the result of the avoidance manoeuvre training that the drivers received on the lane change apparatus.
With-out this training, presumably lower side accelerations
may lunma been reached and more hits of the obstacle
would have ocCured.
Many previous investigations have emphasized the
difficulties of using average drivers in a test which
tries to evaluate vehicle handling. In the past, attempts have been made to minimize subject variability by
using well-trained test drivers or automatic steering. However, with such methods it can be difficult to determine if the test actually measures those aspects
of vehicle handling which are of importance in actual traffic. Because the interaction between driver and vehicle determines handling in traffic, it is essential that one studies the complete system. Both methods
have their justification and may be seen as
comple-menting each other.
26
In this test, the surprise incident (the rubber bag
drOpped in front of the car) simulated an actual critical traffic situation very well. The incident caused
different drivers to perform quite different manoeuvres.
Therefore, no accurate conclusions about the vehicles' handling could be drawn. The method can be said to have
high validity but low reliability. It should, however, be possible to increase the reliability by limiting
the road situation a bit more. Care should,however, be
taken so that the realism of the situation is not
reduced. The method could be used to good advantage when studying vehicle handling, especially as a
comple-ment to totally reproducible methods of the "open loop"
type.
The method of lane change using lights as signals was shown to be relatively reliable but was perhaps a
little unrealistic because of the "unnatural" reason
for veering. The test showed, however, that by using many subjects and appropriate statistical methods, one
can measure and judge vehicle handling with accuracy.
Evaluation of the results
Free play in steering and wheel suspension unquestion ably alters the handling of a car, although the
investigations conducted so far indicate that the
tested degradations have not been sufficient to appreci-ably lower the drivers ability to manoeuvre the vehicle. During normal driving, free play forces the driver to make more steering wheel movements and path corrections. The previous test (Arnberg and Nilsson 1976) has, how-ever, shown that car drivers with average driving skill can compensate quite well for free play even during long driving periods.
27
Free play in tie-rod ends and in the bushings of the
wheel suspension can give undesired steering effects when braking. The effects vary depending on the car's
chassis design and on which component that has free play. The path deviations are normally small, but a
previously conducted investigation (Nordstrom & Roland 1976) demonstrated that assymetric play in the bushings of live rear axles can produce considerable path
deviations during braking. Generally the driver can
compensate for such path deviations with the steering wheel, but a slanted position of the rear axle can give
such a big steering effect during braking that special attention should be given to the rear axle bushings at annual car inspections.
In critical situations, requiring an extreme avoidance
manoeuvre, the driver is the dominant factor in the
driver-vehicle system. In none of the tested driving situations it could be shown that free play in steering and wheel suspensions seriously affected the driver's possibilities of manoeuvring the vehicle safely. Even so, many drivers rated the defective vehicles to be appreciably more difficult to handle than the original vehicles, and the defective Volvo was in many cases
judged to be unsafe in traffic. Free play in the steering
gave the drivers in uneasy feeling, but their ratings
indicate that they overemphasized the importance of free play with regard to traffic safety. The reason
for this might be that drivers noticed that they had to work harder to compensate for free play, and that they possibly felt that free play of this magnitude
sould not be approved at a car inspection.
Previous studies have shown that vehicle type (for
example an over-steering vehicle compared to an
under-steering vehicle) has a greater influence on perfor-mance than marginal worsening of handling caused by degradation of an individual vehicle. Another example
28
of this is that the 150 "play" in the steering of the
modified Volvo is almost regarded as "normal" play in
some American cars.
Applicable limits for acceptable free play in steering
and wheel suspension components are consequently diffi
cult to specify on the_basis of impaired handling qualities. The limit values should instead be based primarily on the risk of failure of single components
(e.g. separation of ball joints). Degraded components, such as bushings, steering gear etc, where little or no risk of failure exists, should not be rejected on the grounds of decreasing traffic safety. However, at the car inspection, consideration must be made of the fact that when wear and tear reach certain levels, their
progress becomes accelerated and therefore much can happen in the period between two inspections.
When judging free play, economic considerations can
also become important. For example free play in
stee-ring and wheel suspension can be the cause of increased
tyre wear, so that even repairs which do not have
importance for traffic safety can be worthwhile as
they may reduce the total running cost for the car
owner .
The judgement of free play at the mandatory periodic vehicle inspection in Sweden is based mainly on the above criterion, and therefore, very small amounts of
play are accepted in ball joints. Greater free play
can be tolerated in parts where no risk of failure exists, especially so in older cars which have a short
expected life left. In such cases, the change of expensive parts, if not necessary for traffic safety reasons, cannot be justified on economic grounds for either the owner or for society. The current study
supports these criterion.
29
It is essential to point out that the degradations
discussed in the current study, simulated the results of normal wear, i.e. free play in ball joints up to
a few millimeters, free play in bushings up to a centimeter and free play in the steering up to about
15 - 200 at the steering wheel. Free play greater than
this is normally the result of some component failure
and this can immediately be considered as unsafe in
traffic, partly because the information from the vehicle
and the road that is normally transmitted to the driver through the steering wheel decreases significantly.
The current study has been carried out as a complement to the previous American studies in the same field. Only
a very limited number of vehicles has been tested with
modifications to only a few of the components which,
because of wear, could affect handling. The effects of
combinations of several components with free play or
combinations of free play components and other factors, such as defective shock absorbers, oversteering due to heavy load etc, have not been studied. However, the
results of the performed tests are similar to the
results reported in the American studies.
For safety reasons, the test drives were carried out
at relatively low speeds (6O - 70 km/h). It is known
that changes in the vehicle's driving dynamics often become more evident at high speeds, and thus it would
be desirable to test the effect of for example, steering free play at high speed. Practical driving tests are,
however, risky and therefore difficult to conduct with subjects, but such investigations could possibly be conducted to advantage in a driving simulator.
In conclusion, with the exception of the bushings for rear axles, the results do not give any reason for
changing the principles that are used today when judging
free play in steering and wheel suspension at the perio dic technical inspection of passenger cars in Sweden.
30
LITERATURE REFERENCES
Aldman, B, Thorngren, L, Larsson, S: Technical analysis
of road accidents in Uppsala county 1960-1971.
VTI Report no 50, 1974. (Only in Swedish)
Arnberg, PW: Vehicle speed and side accelerations before and after surface treatment of gravel roads. An
experimental study. VTI Report no 112, 1976. (Only in Swedish)
Arnberg, PW, Nilsson, A:-Performance of the
driver-vehicle system affected by degradations, - a
literature survey. VTI Internal Report nr 245,
1976. (Only in Swedish)
Arnberg, PW, Nilsson, A: Performance of the
driver-vehicle system affectedby degradations in steering and wheel suspension components. VTI Report nr 86, 1976. (Only in Swedish)
Bergman, W: Measurement and subjective evaluation of
vehicle handling. SAE, 1973.
Bieber, R A: The measurement of drivers' performance in stressful driving situations. Federal Highway
Administration, 1973.
Fancher, P S et al: Limit handling performance as
influenced by degradation of steering and suSpen-sion systems. Michigan University, 1972.
Nordstrom, O, Roland, M: Brake defects and assymetric
brake force distribution affecting stability and handling during braking. VTI Report no 93, 1976.
(Only in Swedish)
Treat, J R, Stansifer, R L: Vehicular problems as accident causes - an overview of available infor-mation. SAE, 1977.