J
Ö N K Ö P I N GI
N T E R N A T I O N A LB
U S I N E S SS
C H O O LJÖNKÖPING UNIVERSITY
Layered Basket Option Hedging
Currency risk management for multinational corporations
- Sandvik AB -
Master Thesis in Corporate Finance
Authors: Gustav Carlsson & Robin Ericsson Tutors: Andreas Stephan & Louise Nordström Jönköping May 2012
Acknowledgement
This thesis would not have been possible without the guidance and help of several individuals who in one way or another contributed and extended their valuable assistance in the preparation and completion of this study.
First and foremost, we wish to express our gratitude to the personnel at Sandvik Financial Services, and above all, to Thomas Hamberg for taking an interest in us and making this study possible.
We would also like to thank our tutors Andreas Stephan and Louise Nordström, for giving us support and guidelines throughout this thesis.
Last but not least, we want to offer our sincerest gratitude to our fellow students for all the feedback received during this study.
Gustav Carlsson Robin Ericsson
Abstract
Master Thesis within Business Administration Title: Layered Basket Option Hedging Authors: Gustav Carlsson & Robin Ericsson Tutors: Andreas Stephan & Louise Nordström
Date: Jönköping May 2012
Key words: Currency risk, Hedging, Options, Basket, Forwards, Diversification Background: In an increasingly globalized environment, corporations perform transactions across borders on a day-to-day basis. As multinational corporations expand their businesses the number of currencies in their operations increases. The consequence of operating with several currencies is the risk associated with currency fluctuations. Sandvik AB is a worldwide corporation where activities are conducted through representation in more than 130 countries. Currency exposures are controlled through risk management where financial derivatives are applied to protect the corporation from potential losses caused by fluctuations. Sandvik AB recently implemented a hedging strategy entitled
Layered Basket Option hedging. The strategy is a combination of a layered- and a basket option
approach to maximize the effect of the hedge. There is a limited amount of previous research regarding Layered Basket Option hedging and Sandvik AB is the first corporation to actively practice this strategy.
Purpose: The purpose is to investigate and provide information about how currency risk most effectively is
hedged for the multinational corporation Sandvik AB. Furthermore, we want to evaluate if Sandvik’s recently implemented hedging strategy, Layered Basket Option hedging, is the best-suited strategy for them and if there are any improvements to be made. This thesis will further investigate the importance of currency hedging for multinational corporations, which are dependent on reporting to their stakeholders. Hopefully, this thesis will also facilitate the communication of Sandvik’s currency strategies throughout the organization and make it more comprehensible.
Method: Exchange rates on daily basis for the period 2002-2012 were collected from Bank of Canada and Reuters database. The collected data was thereafter used as a basis to perform calculations to determine if Layered Basket Option hedging is the optimal solution for Sandvik AB.
Conclusion: The results of this study highlight the benefits from applying a Layered Basket Option hedging strategy and the strategy succeeds to reduce the volatility caused by currency fluctuation. The results indicate that the combination of a layered- and a basket
option approach successfully creates a suitable strategy for Sandvik AB.
Furthermore, this thesis has recognized that there exists room for improvement by actively allocating currencies according to their weights and correlations to fully exploit the effects from the strategy.
Definitions
Correlations
A statistical measure determining how assets or currencies move together. Currency peg
Refers to a fixed relationship between currencies Derivatives
Financial instruments used to hedge risks. Options and forwards are examples of derivatives.
Exotic option
An option that differs from vanilla option in the form of underlying assets or payoff. A basket option is a form of exotic option.
Exposure
Refers to the risks associated of operating with different currencies. Layered hedging
Hedges with the same expiry date are entered at regular intervals. Risk free rate
The rate of return with zero risk, where government bonds are an indication of the risk free rate.
Rolling hedging
To continuously create hedges between regular intervals with different execution dates. Spot rate
The current price of an asset or currency Strike price
The price at which an instrument can be exercised. Time to maturity
The time until a financial contract expires. Value at Risk (VaR)
The magnitude of adverse outcomes that occur with a specified probability in a specific time interval.
Vanilla option
Is a call or put option with standardized terms and no unusual features. Weight
The amount of a single currency in a basket proportionally to other currencies. The weight can both be positive and negative.
Table of Contents
1
Introduction ... 1
1.1 Background... 1 1.2 Sandvik AB ... 2 1.3 Problem discussion ... 3 1.4 Purpose ... 4 1.5 Research questions ... 4 1.6 Delimitations ... 42
Theoretical Framework... 5
2.1 Hedging currency risk ... 5
2.2 Options ... 5
2.3 Black-Scholes ... 6
2.4 Basket options ... 7
2.5 Minimum variance portfolio (MVP) ... 8
2.6 Systematic & non-systematic risk ... 8
2.7 Layered hedging ... 9
2.7.1 Layered vs. Rolling ... 10
2.8 Layered Basket Option Hedging ... 10
2.9 Forward contracts ... 11
2.10 Alternative methods ... 11
2.10.1 Value at Risk (VaR) ... 12
2.10.2 Futures contracts ... 13 2.10.3 Currency swaps ... 13
3
Method ... 14
3.1 Research approach ... 14 3.2 Research design ... 15 3.3 Secondary data ... 15 3.4 Primary data ... 163.5 Materials used in the financial analysis ... 17
3.6 Method for developing a financial analysis ... 17
3.6.1 Correlation ... 18
3.6.2 Standard deviation ... 18
3.6.3 Risk free rate ... 18
3.6.4 Weights ... 18
3.6.5 Minimum variance Portfolio ... 19
3.6.6 Black-Scholes ... 20
3.7 Assumptions ... 20
3.8 The layered hedging approach ... 21
3.9 The effects of applying a basket ... 21
3.10 Alternative hedging strategies ... 22
3.11 Improved baskets... 22
3.12 Manipulation of variables to realize the actual effect of changes ... 22
3.13 Criticism of theories and models ... 23
4
Empirical Findings ... 25
4.1 Sandvik’s hedging purposes ... 25
4.2 Standard deviation ... 25
4.3 The MVP approach ... 26
4.4 The premium using Black-Scholes ... 26
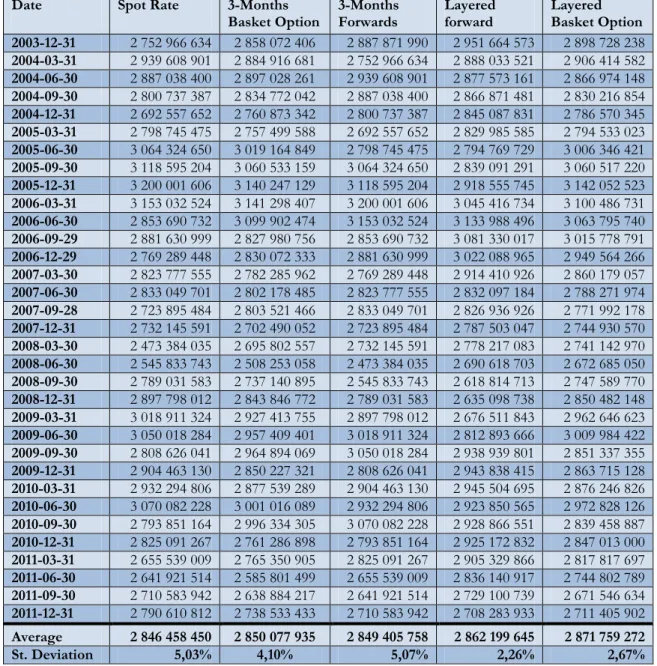
4.5 The total result of the hedging strategies ... 27
4.6 The results of the Layered Basket Option ... 29
4.7 The results of the Layered Forward ... 30
4.8 Manipulated baskets ... 30
4.9 The effects of applying a basket ... 31
4.10 Improved baskets – Divided Layered Basket ... 31
5
Analysis ... 34
5.1 Incentives to hedge ... 34
5.2 The Layered approach ... 34
5.3 The Basket approach ... 35
5.4 The Layered Forward approach ... 36
5.5 The Layered Basket Option approach ... 37
5.6 Improvements ... 39
6
Concluding Remarks ... 41
6.1 Conclusions ... 41
6.2 Discussion and further studies ... 42
7
List of References ... 43
8
Appendices ... 47
8.1 Appendix 1-10 Basket Variance, Weights and Premiums 2003-2012 ... 47
8.2 Appendix 11-20 – Correlation 2003-2012 ... 57
List of figures
Figure 1, Black-Scholes Diagram ... 7
Figure 2, Layered hedging ... 10
Figure 3, Rolling hedging ... 10
Figure 4, Standard Deviation ... 25
Figure 5, Basket Standard Deviation ... 26
Figure 6, Premium ... 27
Figure 7, Result from hedging strategies ... 29
Figure 8, Layered Basket Option vs. Spot Rate ... 29
Figure 9, Layered Forward vs. Spot Rate ... 30
Figure 10, Layered Forward ... 37
Figure 11, Layered Forward vs. Layered Basket ... 38
List of tables
Table 1, Johnson & Lidbark, Diversification effect ... 8Table 2, Basket of currencies ... 17
Table 3, Result from hedging strategies ... 28
Table 4, Manipulated Baskets ... 30
Table 5, Diversification improvements ... 31
Table 6, Improved baskets ... 32
Table 7, Improved baskets ... 33
Table 8, Outcome of strategies ... 34
Table 9, Diversification 2003 Q3 & 2011 Q3 ... 35
Table 10, Spot vs. Layered Basket Option ... 38
Table 11, Premium reduction ... 40
Table 12, Reduction in diversification effect ... 40
Chapter 1 G.Carlsson & R.Ericsson Introduction
1
Introduction
This first chapter will introduce the concept to risk management in a global market. It will further be narrowed down to the problem that the Swedish multinational enterprise, Sandvik AB, is facing and the model developed to solve this.
The world has accelerated towards a more globalized environment during recent decades. Cities have transformed from success to failure, where corporations move production from its origin to areas with cheaper labour and production (Schifferes, 2007). Simultaneously, restrictions are shifting in more beneficial directions for global businesses. Tolls, quotas and transportation costs are being reduced, making it cheaper to import and export (Reiter & Jönsson, 2002). However, the financial volatility is increasing around the world, where countries such as Greece, Portugal and Ireland are all jeopardous markets for businesses to enter (Barth, Li, & Prabgavivadhana, 2011). The financial volatility is resulting in fluctuating currencies, which make transactions between countries a vital phase (IMF, 2011). The risk of being a multinational corporation is growing and hedging becomes increasingly fundamental for border-crossing organizations (Lind, Polak, & Robertson, 2011).
Foreign currency management is a crucial procedure for corporations that act on the global market. An organization needs to discover and analyze their foreign exchange exposure. Exposure means, that some segment of the organization is affected by exchange rate fluctuations. The risk connected to exchange rate exposure depends on the potential degree of fluctuations in the currencies. Therefore, currency risks increase proportionally with the volatility in the foreign exchange rates. Due to the massive volume of currency constantly changing hands over a single global market the volatility has increased dramatically the recent years. Unpredictable rate changes may have an unfavorable effect on multinational corporations return and can be seen as the “cost of going offshore”. The cost of going offshore is a cost that a multinational corporation, such as Sandvik should minimize in order to be a competitive player on the global market. To hedge risk and decrease the volatility in the currency exchange rates is a strategy that should be considered by financial managers. Sandvik’s currency exposure is created because of the absence of predictability in the foreign exchange market (Shoup, 1998).
1.1
Background
The introduction of the Bretton-Woods system was the beginning for structured relationships between currencies. The world economy needed structure after World War II, and the Bretton-Woods agreement included guidelines and restrictions to help recompose the economy. The fundamental idea was to implement a fixed exchange-rate system, which was an important step for the currency market. After the Bretton-Woods was depleted in 1973, some minor phases passed before a floating system was introduced in the early 1990s (Reiter & Jönsson, 2002).
A floating exchange-rate system naturally leads to new risks for corporations. Multinational corporations face the risk of potential losses caused by currency fluctuations. There are
Chapter 1 G.Carlsson & R.Ericsson Introduction
several incentives in why organizations such as Sandvik AB need to implement a hedging strategy. The fundamental reason is to avoid additional losses because of currency fluctuations. In the last 20 years, financial derivatives have become an everyday routine (Brown & Toft, 2002). There is a wide range of hedging instruments, where each instrument has its own functions but similar purposes (Mahul, 2001).
The reason why Sandvik AB would apply hedging instruments is not only to avoid losses caused by unanticipated fluctuations, but also to satisfy their shareholders. An aggressive hedging strategy that is implemented solely to generate profits is more risky in comparison to other strategies. If large exposures are hedged completely through options, it will automatically result in large premiums. A hedging strategy is applied to eliminate the effects of currency fluctuations. That is, to neither make a profit or loss, but to aim at a precise and foreseeable result. Sandvik’s goal is to satisfy all stakeholders, where a strategy that meets the corporate’s and the shareholders’ expectations should be implemented (T, Hamberg, personal communication, 2012-01-12).
1.2 Sandvik AB
Sandvik was founded in Sandviken, Sweden, when Göran Göransson was the first in history to use a Bessemer process in steel production (Sandvik AB, 2012). A Bessemer process is an inexpensive process for mass-production of steel from molten pig iron (Wolf, 2001). Sandvik is active in 130 countries and have a total of 50.000 employees with a turnover of approximately 100 billion SEK. They are a high-technology engineering group divided into five different business areas, Sandvik Mining, Sandvik Machining Solutions, Sandvik Materials Technology, Sandvik Construction and Sandvik Venture (Sandvik AB, 2011).
Sandvik possess an exclusive potential of knowledge within materials technology and provide their customers with expertise about work processes. They always strive to become market leaders within the areas they operate in. The world is their market and transactions across borders occur constantly (Sandvik AB, 2011). Customers are given the option to pay in their own currency and that leads to currency exposures. Sandvik is exposed in several currencies, where their exposure depends on the distribution between production and sales. In present time, Sandvik AB has 10-15 billion SEK exposed to currency risks and they only hedge a part of this outstanding exposure. Their goal is not solely to make a profit, but to reduce the volatility. The goal is to aim at an accurate result, with no unexpected outcomes. The CEO should not have to explain to the shareholders why a result suddenly differs from the predicted (T, Hamberg, personal communication, 2012-01-12).
Layered Basket Options is a hedging strategy developed by the CitiFX Corporate Solutions Group (CSG), a bank with a global perspective where Sandvik AB is the optimal customer to implement this strategy. Because of Sandvik’s diversified foreign exchange portfolio they demand a hedging strategy that reduces the volatility in their currency exposure but at the same time is flexible enough to take advantage of potential positive movements in their exposed currencies. The Layered Basket Option hedging model is according to CSG said to
Chapter 1 G.Carlsson & R.Ericsson Introduction
be the best solution to meet these requirements. The Layered Basket Option hedging strategy is a combination of a layered and a basket option approach. The layered approach divides larger hedges into several smaller hedges with different expiration dates to smoothen the fluctuations. Instead of applying a static hedge where there is only one expiration date, the multiple expiration dates allows for peaks and downs to cancel out each other to further reduce the volatility. The basket option approach takes advantage of the imperfect correlations. By hedging all currencies through a basket option a diversification effect is created. These two approaches combined create the Layered Basket Option hedging (Johnson & Lidbark, 2009).
1.3 Problem discussion
Sandvik AB is exposed to currency risks and risk management strategies are applied to control the risks. The currency exposure increases as the corporation continues to grow and the risks associated with currency exposures have a larger impact on the result. According to Thomas Hamberg, Head of Corporate Finance, the intention of applying a hedging strategy is not only to avoid losses and maximize the profit. Sandvik AB relies on their investors and it is of importance to satisfy the shareholders demands. Therefore, to find and implement a hedging strategy that eliminates the effects from currency fluctuations is desired. Sandvik AB aims to apply hedging instruments to reach a foreseeable result, where currency movements do not generate unexpected outcomes. There is a limited amount of previous research regarding Layered Basket Option hedging. The strategy was recently developed and Sandvik AB was the first corporation to fully implement the strategy. This results in obscurities in how Layered Basket Option hedging stands in relation to other hedging instruments and how effective the strategy is. We strive to clarify the concept and make it more comprehensible to Sandvik AB and the reader. The model involves complexity, both in a mathematical and a practical way. The combination of a layered- and basket option approach needs to be explained in a pedagogical and detailed procedure to demonstrate why Layered Basket Option hedging is a suitable strategy for Sandvik AB. The lack of previous studies makes it difficult to determine the prime approach in how to perform the premium calculations. Therefore, the chosen mathematical approach needs to be carefully studied to attain an accurate result.
The rising demand for suitable hedging strategies will lead to an investigation to conclude if a Layered Basket Option hedging strategy is an interesting and suitable approach for multination corporations and Sandvik AB.
Chapter 1 G.Carlsson & R.Ericsson Introduction
1.4 Purpose
The purpose is to investigate and provide information about how currency risk most effectively is hedged for the multinational corporation Sandvik AB. Furthermore, we want to evaluate if Sandvik’s recently implemented hedging strategy, Layered Basket Option hedging, is the best-suited strategy for them and if there are any improvements to be made. This thesis will further investigate the importance of currency hedging for multinational corporations, which are dependent on reporting to their stakeholders. Hopefully, this thesis will also facilitate the communication of Sandvik’s currency strategies throughout the organization and make it more comprehensible.
1.5 Research questions
The problem with currency risk exposure has been recognized in Sandvik AB and has provided us with three relevant questions to be investigated in this thesis.
- Is Layered Basket Option Hedging the optimal hedging strategy for Sandvik AB? - How will other hedging strategies affect Sandvik’s currency risk management? - Is there a superior strategy for hedging currency risk exposure?
1.6 Delimitations
A comprehensive understanding about currency risk management for multinational corporations is essential to present a relevant result about the investigated hedging model. There exist many hedging strategies within the currency risk management framework. We have decided to investigate and focus on the most common strategies and also those strategies that are relevant according to the goals and ambitions for the Sandvik Corporation. Furthermore, the Layered Basket Option hedging model had to be broken down into two parts, the layered approach and the basket option strategy, and investigated separately to later be merged in our calculations. The effectiveness of the hedge will be evaluated and compared with other strategies to obtain conclusions regarding if there are improvements to be made for Sandvik’s present currency risk management.
When evaluating the investigated hedging strategy several approaches may be conducted. Approaches such as a Monte Carlo simulation had to be discarded due to its complexity and others strategies was rejected early due to the fact that Sandvik is exposed to negative weights. We choose to evaluate the strategies through a portfolio theory since several underlying currencies are investigated and transparency is fundamental for the communication within the organization.
Chapter 2 G.Carlsson & R.Ericsson Theoretical Framework
2
Theoretical Framework
This chapter will present and explain the necessary theories and models to answer the different problems associated with currency risk management. Further this chapter will provide the reader with sufficient material to understand the concepts and how the problems at hand may be solved.
2.1 Hedging currency risk
Techniques for hedging currency risk involve the use of different financial derivatives, which protect corporations from the fluctuations in the foreign exchange rates. Some of the most widely used derivatives or techniques if organizations do not want to trade at a spot rate, is forward contracts, futures contracts, options and currency swaps (Jorion, 2005).
2.2 Options
Options are securities that give the holder right to exchange an asset against a decided premium. An option is a right to either buy (call option) or sell an asset (put option). It is also subject to several conditions, which span over a specified period of time. The underlying asset of an option is often common stocks but could be any kind of assets such as currencies or commodities (Black & Scholes, 1973). There are several subcategories linked to the concept of options. Firstly the financial instrument is divided into vanilla
options (or standard options) and exotic options. Vanilla options are the most common type of
options. The holder of a vanilla option owns the right to buy or sell an underlying asset for a certain price called exercise- or strike price. The exercise of this right must occur within a pre-determined time called time to maturity or time to expiration. The conditions connected to this expiration time would further divide vanilla options into different kinds of options. A European option allows the holder to only exercise the right at the maturity date. Contrary to the European, the American option implies that the holder owns the right to exercise this security at any moment within the time to maturity (Zhang, 1995).
According to Zhang (1995), exotic options are a direct or indirect extension of vanilla options. If vanilla options are categorized as the first generation of options, exotic options could be seen as the second generation. An exotic option is a non-standard option that differs in some aspect from the vanilla option. There are different kinds of exotic options but if it differs in at least one aspect from the rules of a vanilla option, it should be categorized as an exotic option. One example of an exotic option that will be further investigated is the basket option. Options may further be categorized in terms of “moneyness”. An option could, depending on its strike and spot price, either be “at the money” (ATM), “out of the money” (OTM) or “in the money” (ITM). When a put option is ITM it refers to the spot price being below the strike price and the option in this case has an intrinsic or time value. Contrary, the put option is OTM when the spot price is above the strike price and the value of the option is subsequently equal to nothing. A put option that is ATM has only a time value and no intrinsic value, since the strike price is equal to the spot price (Bakshi, Cao, & Chen, 1997).
Chapter 2 G.Carlsson & R.Ericsson Theoretical Framework
Hedging currency risk through put options is commenced when the risk encountered is a downward trend in the investigated currency. An example would be if a corporation wants to secure a certain currency from a downward trend but at the same time earn money if the currency increases in value. The corporation wants to secure an amount of USD to the SEK, it may then buy the right to sell the USD for a certain amount in SEK depending on the current exchange rate. This would be equal to buy an ATM-put option where the corporation hedge the risk from a weakening in the USD in comparison to the SEK but it will still benefit from a strengthening in the USD. This advantageous opportunity however, does come at cost; a premium has to be paid which is the risk a buyer of the put option has to consider (Wong, 2003).
2.3 Black-Scholes
There are several methods for valuating options, where one of the most widely used is the model developed by Fischer Black and Myron Scholes.
There are many factors that influence the price of an option, where the value of the underlying asset is an important factor that determines the price. If the price of the asset were much lower than the exercise price of a call option, the value of that option would be close to nothing. However, if the price of the underlying asset were much higher than the exercise price the value of that call option would automatically be high. The time to maturity of the option is a crucial determinant for the value of the option, since the forecasting and probability that the desired strike price would be fulfilled changes as the maturity date approaches. Normally the value of the option declines as the maturity date approaches. Fluctuations and volatility influence the risk that the different parties take on and therefore also affect the valuation of the option (Black & Scholes, 1973).
A diagram illustrated by Black and Scholes (1973) (see figure 1) shows the properties between the call option’s value and the underlying asset price (i.e. stock price). Line A represents the maximum value of the option with an exercise price of $20, this because the value of an option cannot exceed the stock price. Line B represents the minimum value since the option value cannot be negative or smaller than the stock price minus the exercise price. The remaining lines, T1, T2 and T3 symbolize the value of the option for successively
shorter time to maturity. Notice that the value of the option is more volatile than the stock price since it is concave upward sloping. This proves that the closer to the maturity date, the percentage change in the option value is larger than the change in the stock price (Black & Scholes, 1973).
Chapter 2 G.Carlsson & R.Ericsson Theoretical Framework
Figure 1, Black-Scholes Diagram
The mathematical approach of this formula, where the necessary variables are included will be presented in the next chapter together with the methodological approach.
2.4 Basket options
The value of a basket option depends on the average value of the underlying assets over a specific period (Turnball and Wakemann, 1991). The basket consists of different weights of each currency depending on the distribution of exposure between the currencies (Johnson & Lidbark, 2009). The overall cost is normally lower if currencies are hedged through a basket option compared to individual vanilla options. The reduction is explained by imperfect correlation between currencies (Hakala and Wystrup, 2008). It implies that currencies react differently given external circumstances (Madan, 2009). An example is if oil-prices are rising, currencies can respond differently, where some currencies increase and others decrease in value. By including currencies that behave differently, it is possible to reduce the risks and thereafter the premium.
As illustrated by Johnson and Lidbark (2009), the diversification effect reduces the volatility for the basket in comparison to the individually hedged vanilla options (see table 1). The exposed amounts are shown in the second column, while the third column illustrates the amount exposed to risks in relation to regular market movements. The last column displays the individual volatility for each currency. When the basket’s total value-at-risk is compared to the total value-at-risk of the individually hedged currencies there is an improvement by 37%. It is explained by the reduction in volatility, where the average volatility between the currencies equals 14% and the basket’s volatility equals 9%.
Stock Price Option Price
Chapter 2 G.Carlsson & R.Ericsson Theoretical Framework
Currency Pair (EUR) VaR, 95% Volatility
USD 10 000 000 2 024 154 14% GBP 10 000 000 1 878 531 13% CHF 10 000 000 962 102 6% JPY 10 000 000 2 550 430 18% SEK 10 000 000 1 709 819 11% CAD 10 000 000 1 947 290 13% ZAR 10 000 000 2 755 853 19% INR 10 000 000 4 211 665 17% BRL 10 000 000 2 663 688 19% CNY 10 000 000 2 136 119 15% Total Basket 100 000 000 13 299 226 9% Tot. Individual 21 039 652 Difference 7 740 426 Diversification 37%
Table 1, Johnson & Lidbark, Diversification effect
One of the ideas behind constructing a basket is to exploit the diversification effect. Diversification effect means to reduce the total risk by adding several assets to a portfolio or basket. Since different assets tend to move differently given external circumstances, the risk will be reduced when a new asset is added. The explanation is the underlying correlation between assets. When the correlation between currencies equals 1 the diversification effect is lost, hence it is the non-similarities between assets that lead to a reduction in risk. Therefore, it is of importance to ensure that the assets do not move identical given uncontrollable circumstances if the diversification effect will be captured (Chen, 2012).
2.5 Minimum variance portfolio (MVP)
Basket options make use of portfolio theory since the currencies are not perfectly correlated. If a basket of currencies is seen as a portfolio of assets, portfolio theory models can be applied to determine the volatility of a basket (Penza & Bansal, 2001).
A basket consists of several assets, where the assets contribute with different weights. The assets have different standard deviations and the correlation between the assets is widely spread. Harry Markowitz introduced a concept allowing investors to find the portfolio variance by combining all the underlying factors for all currencies (Markowitz, 1959). The correlation between the different assets can contribute to a risk reduction. If the correlation between the underlying assets is imperfect, the standard deviation will be reduced. The Minimum Variance Portfolio theory calculates the variance of a portfolio, based on the correlations, weights and standard deviations of the underlying assets (Schuck & Brown, 1997).
2.6 Systematic & non-systematic risk
Systematic and non-systematic risks, also known as non-diversifiable and diversifiable risks are common terms in portfolio management. Systematic risk cannot be diversified away while the non-systematic risk will nearly be eliminated with a larger portfolio due to the diversification power (Elton et al., 2009). Systematic risk is connected to the market and
Chapter 2 G.Carlsson & R.Ericsson Theoretical Framework
examples that correspond to this type of risks could be wars, inflations and other uncontrollable fluctuations in the market (Balvers, 2001).
A mathematical explanation of systematic and non-systematic risk may be derived if we look at the formula representing the risk of a portfolio presented by Elton et al. (2009) where N represent the number of underlying assets in the portfolio:
(∑ )
(1)
The non-diversifiable systematic risk is denoted by which entails that it is not related to the number of assets N and will not change since is constant. According to the formula above, it is shown that the non-systematic risk ( ) will approach to zero as N
goes to infinity (Elton et al., 2009).
2.7 Layered hedging
According to Hirigoyen (2003) a key concern for multinational corporations, which depend on reporting stable currency results, is to manage their foreign exchange risks. Extending and layering the hedge horizon to reduce the problem of forecasting accuracy several years ahead should solve the problem.
Companies’ goal is to reduce their year-on-year currency impact on their result due to the volatility in the exchange rates. This goal is not best reached with static hedging programs since a static hedge one year, is totally isolated from the following year. The most important aspect to achieve this goal is to discover the link between the aim of the corporation’s risk management and the layout of the hedging strategy. When the link has been detected, the best strategy to reduce the year-on-year volatility in exchange rate is, as mentioned before, to create longer hedging tenors. Forecasting errors and opportunity costs should be taken into consideration when extending the tenors since these kinds of negative outcomes tend to increase with a longer time horizon (Lidbark, 2006). A good strategy to implement when dealing with forecasting accuracy in a long tenor is to layer the hedge with several intervals to make room for adjustments along the period (Hirigoyen, 2003).
With a layered hedging program, hedges with the same expiry date are entered at regular intervals. In the model below (see figure 2), 25% of the exposure of the four upcoming quarters is hedged every quarter. With this strategy the hedging rate becomes an average of the previous tenors. In the example given, a moving average of hedging rates becomes available for four previous quarters. The year-on-year changes in the hedging rates are connected to the created moving average. Due to this connection the layered strategy creates smaller year-on-year changes compared to the volatility created by a spot strategy. Hedging with a layered program is rather used as an averaging tool than a delaying one, which is the result of several other hedging programs and strategies (Johnson & Lidbark, 2009).
Chapter 2 G.Carlsson & R.Ericsson Theoretical Framework
Figure 2, Layered hedging
2.7.1
Layered vs. RollingIn a rolling hedging program the hedges are entered at regular intervals but with different execution dates (see figure 3). This would generate the hedging rate of year-on-year changes to be driven by the spot rate. The rolling hedging strategy would delay the outcome of the hedge and push either the positive or negative effect further in the future (Johnson & Lidbark, 2009).
Figure 3, Rolling hedging
According to Johnson and Lidbark (2009) the layered hedging program is far more attractive than the rolling program if options are used as the hedging tool. This comes from the perspective of premium spending, since the average tenor for a regular 12-month rolling hedging program is 12 months, whereas the average tenor for a 12-month quarterly layered program is ((3+6+9+12)/4) 7.5 months. As mentioned before, the value of the options will decline as the maturity date approaches. When the value declines the price of the option must decline as well and the shorter average tenor will result in a lower premium (Black & Scholes, 1973).
2.8 Layered Basket Option Hedging
Sandvik and Citibank have developed a hedging model called Layered Basket Option hedging. The model is built on the concept of regularly buying options, which gives the right to sell a basket of currencies that reflects the corporate group’s currency exposure. The strategy implies that they combine two independent hedging models, the layered hedging procedure and the basket option approach, that both reduce the volatility and decrease the premium payments. The layered program possesses much more desirable risk characteristics as they reduce the year-on-year changes in effective hedging rates by spreading out execution over
Chapter 2 G.Carlsson & R.Ericsson Theoretical Framework
time and creating an averaging process. The volatility may be further reduced due to basket hedging. Instead of hedging each individual currency, a basket of several currencies is applied. This creates diversification power, due to correlations between currencies (Johnson & Lidbark, 2009).
Sandvik AB computes the exposure in foreign currency that they have realized in the past 12 months. The total sum of the different foreign currency exposures from the underlying companies all over the world is put together in one single basket. This basket contains of 18 different currencies with diverse amounts depending on the operations undertaken in that certain country. Sandvik is, either in a short or long position in a local currency, which implies that the basket will contain negative exposures in some currencies. The subsequent valuation process will result in a price for an ATM-basket put option of the underlying currencies with respectively three, six, nine and twelve months to maturity. This gives Sandvik an opportunity of negotiation and will make a closure with the bank that offers the lowest premiums (T, Hamberg, personal communication, 2012-01-12).
2.9 Forward contracts
A forward contract is a simple and efficient financial derivative applied to protect a corporation from currency fluctuations. A forward is an agreement between two parts, that is to either sell or buy an asset at a specific date in the future for a predetermined price. The two parties in the contract are presented by either two financial institutes or between a client and a financial institute. The parties take either a long or short position, which implies that the party that is going long agrees to buy the underlying asset for a certain price in the future. The other party will take a short position and is obligated to sell the underlying asset for the predetermined price on the agreed date in the future. This indicates that the two parts have different beliefs in the market they operate in or that at least one party is eager to hedge the risk of fluctuations in the underlying asset price. Since the forward contract is binding and there is no premium involved, the possible payout defaulted or received will represent the value or cost of this contract. This also implies that there is always one winner and one loser in this binding commitment (Hull, 2012).
According to Hull (2012) forward contracts can be used to hedge foreign currency risk. Assume that a corporation that is active on the global market wants to report its result in their domestic currency and wants to convert a basket of foreign currency to the domestic. The corporation may then take a short position in a forward contract and be safe from exchange fluctuations and sell the basket at a predetermined price for a sum in its domestic currency. This hedge is effective in terms of protecting a corporation from drops in foreign exchange rates but it will lose the opportunities from a strengthening in the foreign currency.
2.10 Alternative methods
Derivatives that may be used as a hedging tool but does not correspond to Sandvik’s hedging strategies will still enlighten the overall understanding of currency risk management. Furthermore, alternative valuation processes should be taken into
Chapter 2 G.Carlsson & R.Ericsson Theoretical Framework
consideration when valuating derivatives and performing an active currency risk management within a corporation.
2.10.1
Value at Risk (VaR)Value at risk is a version of the safety-first rules, where focus is concentrated on the size of adverse outcomes that occur with a specified probability in a specific time interval (Elton, Gruber, Brown, & Goetzmann, 2009). VaR measures the loss caused by regular market movements and losses beyond the “value at risk” only occur with a particular probability. Compared to other statistical risk-measuring concepts, the model generates a transparent result and increasing the general understanding and communication within organizations. It is an appropriate measurement for larger business, allowing members of the board to understand and realize the organizations risk exposures. Assume there is an asset with a VaR of 1000 SEK at a 95% confidence level. It implies that there is a 95% probability that the possible losses will not exceed 1000 SEK. Then there is only a 5% chance that the asset will drop more than 1000 SEK. The 95% confidence represents the normal movements in the market and the remaining 5% represents abnormal movements (Hopper, 1996). Value at risk is basically the value or price of a derivative, for example the value of a basket option.
There are three different approaches to Value at Risk, the Historical, Variance-Covariance and the Monte Carlo approach. The historical approach is based on historical changes in market-rates and prices. The data is then used to predict future outcomes to anticipate the value at risk as the loss exceeds a certain percentage (1, 5 or 10%) (Linsmeier & Pearson, 1996). The Variance-Covariance approach assumes that returns are normally distributed around a mean return of zero. There are only two factors applied when calculating Variance-Covariance method, the estimated standard deviation and the cut-off factor in the left tail of the distribution. These factors are then used to predict future outcomes based on today’s data (Hopper, 1996).
The Monte Carlo approach is a parametric method, which generates random changes in risk factors from estimated parametric distribution. The process is divided into two different steps. The first step involves a parametric stochastic process for all risk factors. It means that factors such as standard deviation can be derived from historical data. The second step is based on the first step, where random price paths are simulated from the different risk factors (Jorion, 2007). The simulated processes are realized using a pseudorandom generator, which is an instrument, built on an algorithm that generates possible outcomes. The Monte Carlo process is relatively similar to the historical process, but does not base future outcomes on sampled historical data (Linsmeier & Pearson, 1996). Since a basket option can involve many variables, a Monte Carlo simulation gives the most accurate result because of the number of possible outcomes generated from the process (Hakala & Wystrup, 2002). The disadvantage is that a Monte Carlo simulation is time-consuming (Hull, 2012). Assume there are ten different currencies in a basket. Then there are different risk factors connected to each individual currency and some currencies are affected by changes in one another A Monte Carlo approach randomly creates different
Chapter 2 G.Carlsson & R.Ericsson Theoretical Framework
price paths, allowing a business to realize the value-at-risk. The Monte Carlo approach is superior to other methods because of its flexibility and the ability to take a wide range of risks into account (Jorion, 2007).
2.10.2
Futures contractsSimilar to the forward contract, a futures contract is an arrangement between two parties to sell or buy an asset at a certain price at a predetermined time in the future. Any of the two parties does not necessarily have to be represented by a financial institute and unlike forward contracts the futures contracts are normally traded on an open exchange market. The underlying asset of a future includes a wide range of commodities and financial assets, where the financial asset includes Treasury bonds, stock indices and currencies. The price of a futures contract is determined by the laws of supply and demand and the exchange market provides mechanisms which ensure that the contract will be honored (Hull, 2003).
2.10.3
Currency swapsCurrency swaps are agreements between two parties to exchange one currency for another at a specific date. For the swap to be justified, a price is paid that corresponds to the difference in interest rates between the two currencies. The main purpose with currency swaps is to minimize currency exposures. Assume there is an exporting business that needs 10 million USD to make a payment today and they do not have any USD in their account. At the same time, they are expecting a payment of 10 million USD in three months. The business needs USD today, but they want to avoid exchanging money at two different occasions. The business then makes a currency swap, where they buy USD at the current rate and at the same time sells USD to be delivered in three months. This is done to avoid exchanging twice and to minimize the risk exposure (Shoup, 1998).
Chapter 3 G.Carlsson & R.Ericsson Method
3
Method
The following chapter will explain and examine the different methods applied in this thesis. We will further discuss and motivate the applied methods and provide the reader with insight into the research, as well as a credibility assessment.
3.1 Research approach
The purpose of this thesis is to evaluate a new hedging model for currency risk management in the multinational corporation Sandvik AB. Theories and models developed solely for this purpose had to be investigated. A key factor was to discover a relationship between the reality, which is the possible outcome of the hedge, and the existing theories for valuing the undertaken hedging methods. The reason to hedge currency risk is to protect the exposure in the foreign currency from negative fluctuations. By collecting daily historical data from several currencies, the hedging results may be investigated from different hedging models and theories. Personal contact with personnel at Sandvik Financial services was necessary to conduct reliable and relevant research within this specific subject.
Patel and Davidson (2003) states that the most central problem for a scientific research is to identify and connect theory to reality. Three key concepts when dealing with this problem are deduction, induction and abduction. The deductive approach allows a researcher to draw conclusions and obtain results through already proven existing theories. An inductive approach implies that the researcher formulates a theory based on the data collected and the analysis received from it. A combination of these two approaches would be the abduction approach. Two other expressions within business research are quantitative and
qualitative and are used to distinguish different data analysis processes and data collection
techniques. A qualitative approach implies that the techniques and analysis of the data and procedure is based on, or generates non-numerical data. A quantitative approach could be used as a synonym for data collection techniques and analysis that generates and is based on numerical data. The quantitative data analysis procedure predominately involve analyzing statistics and graphs, while in the qualitative manner the collection is mostly focused on interviews and the analysis of the data are achieved through conceptualization (Saunders, Lewis, & Thornhill, 2009).
According to Saunders, et al. (2009) the deductive approach involves testing theories rather than building them. A hypothesis about the relationship between several variables must be deduced. The hypothesis would due to the large amount of different currencies, involve the relationship between the correlation and the volatility of currencies. Furthermore, because of the framing of the investigated model, the relationship between the volatility and the hedging tenor should be of significant importance.
A collection of quantitative data, which is a characteristic of a deductive approach, was necessary to test this hypothesis between hedge tenors, correlation and volatility. The
Chapter 3 G.Carlsson & R.Ericsson Method
quantitative data collection contains daily historical exchange rates from 18 different currencies with the SEK as the base currency, nearly ten years back in time. The large numerical sample size would be sufficient to fulfill the deductive characteristic, called generalization. That is, a sufficient numerical sample size is necessary for generalizing a statistical behavior (Saunders, et al., 2009).
The procedure of evaluating the Layered Basket Option hedging clearly shows that we have undertaken mainly a deductive and quantitative approach. Statistical data has been central to conduct the subsequent calculations based on the theories of currency risk management. The personal contact with representatives from the Sandvik group has been a crucial part for us to succeed with our research and a qualitative approach should not be totally detracted.
3.2 Research design
There are three main research perspectives; exploratory, descriptive and explanatory (Saunders et al, 2009). We have applied a combination of an exploratory and an explanatory approach. Exploratory research means to achieve improved knowledge within a subject and to clarify dimensions that have not been fully explained. An exploratory study refers to exploring the unknown, and concludes if a study is worth pursuing. In an exploratory study the researcher must be willing to change direction if new findings are found (Saunders et al, 2009). Layered Basket Option hedging is a recently developed model. Due to this novelty, there is a lack of information within the subject. Information was gathered through articles provided from Citibank and interactions with our contact person at Sandvik Financial services, Thomas Hamberg. Explanatory research explains the relationships between variables to clarify a situation or a problem (Saunders et al., 2009). Layered Basket Option hedging differs from other strategies in the sense of the number of variables taken into consideration. For example, the imperfect correlation between assets helps explain why the basket volatility is being reduced in comparison to the average volatility between individually hedged currencies. In order to conduct this research we were dependent on secondary data, where daily exchange rates were the foundation of our collection.
3.3 Secondary data
Secondary data is a form of data that has been gathered through former studies (Saunders et al., 2009). The purpose of the previous studies is not necessarily the same as ours. It is important to realize the procedure of data gathering, to comprehend if the data was conducted in a biased or unbiased way (Befring & Andersson, 1994). The majority of the information was gathered through secondary data. Information in how multinational organizations manage their hedging strategies and how the model, Layered Basket Option hedging, stands in relation to other strategies were collected. There was a necessity to understand other hedging strategies to realize the unique aspects of the model. Deeper studies were derived from secondary data in the form of textbooks, academic articles, relevant newspaper articles and organizational articles.
Chapter 3 G.Carlsson & R.Ericsson Method
In order to complete our numerical section, other types of secondary data needed to be collected. Firstly, information regarding theories and models were gathered through textbooks and academic articles to get knowledge about theories such as Black Scholes, Value at Risk and portfolio theories. After we determined the best-suited approach, exchange rates on daily basis needed to be gathered. The data was collected through Bank of Canada and from Reuters' database.
3.4 Primary data
When the secondary data could no longer fully answer our research questions, we had to collect further relevant data for our research. This kind of data is equivalent to primary data and should be collected accordingly to our research questions (Ghauri & Grønhaug, 2005). According to Churchill (1999, p. 215), “Begin with secondary data, and only when the secondary
data are exhausted or show diminishing returns, proceed to primary data.”
The procedure stated above has been conducted through our research. Our primary data involved communication with personnel within the Sandvik group. The communication consisted of personal contact and mail conversations. We have been in contact with the Head of Corporate Finance and the CEO of Sandvik Treasury AB. The personal communication have been somewhat informal since we all strove for the same goal, which was to improve and evaluate the hedging strategy for Sandvik AB. Communication in form of mail conversations with personnel within the CitiFX Corporate Solutions Group, the developer of the model, was added to the primary data collected.
Chapter 3 G.Carlsson & R.Ericsson Method
3.5 Materials used in the financial analysis
Sandvik’s current situation regarding exposed currencies is reflected in their basket. We have chosen to work with a fixed basket to enable a comparison between periods. The exposed sums will be fixed in foreign currencies, while the SEK will vary since the spot rates fluctuate on a day-to-day basis. For example, a USD may be worth 7,00 SEK one day and 7,10 the day after. This implies, if our foreign currencies stand as fixed, the SEK will still vary because of currency fluctuations.
Currency Spot Exposure SEK Weight
USD 8,6957 497 200 000 4 323 478 261 36% AUD 4,8924 269 200 000 1 317 025 440 11% CAD 5,5036 26 800 000 147 495 872 1% CHF 6,2854 -373 200 000 -2 345 694 532 -19% CZK 0,2889 691 600 000 199 792 004 2% EUR 9,1158 22 800 000 207 839 562 2% GBP 13,9860 55 600 000 777 622 378 6% ZAR 1,0138 1 986 400 000 2 013 787 510 17% SGD 5,0125 -138 000 000 -691 729 323 -6% PLN 2,2701 180 400 000 409 534 620 3% NOK 1,2531 -306 000 000 -383 458 647 -3% KRW 0,0073 95 184 000 000 697 771 538 6% JPY 0,0732 7 868 800 000 576 063 721 5% CNY 1,0501 3 144 400 000 3 301 900 662 27% CPL 0,0121 67 610 800 000 816 018 078 7% INR 0,1813 -3 287 200 000 -595 929 363 -5% BRL 2,4558 133 200 000 327 111 984 3% RUB 0,2721 3 422 800 000 931 333 602 8% Total 12 029 963 366 100%
Table 2, Basket of currencies
The table above (see table 2) illustrates how a basket is structured according to Sandvik’s exposure. The “spot” column refers to the spot prices between a foreign currency and the SEK. The “Exposure” column represents the fixed amounts in foreign currencies that Sandvik is exposed in and the SEK column is the exposed sum represented in SEK. Some of the exposures are negative since Sandvik has a larger proportion of production than sales in some countries and need to make payments in foreign currencies. The last column demonstrates the basket’s distribution of currencies. The weights will vary between periods because of exchange rates fluctuations. The weights are calculated by dividing the exposed sum of a foreign currency represented in SEK, by the total exposed sum in SEK.
3.6 Method for developing a financial analysis
The instruments chosen in our investigation were a combination of the Minimum Variance Portfolio Theory and the Black-Scholes formula. The models will be used to calculate the volatility of the baskets and eventually the value of the basket options. The period investigated will be set to 10 years to achieve sufficient and realistic outcomes. The results will be compared to the outcomes of other hedging instruments to conclude if the Layered Basket Option hedging strategy is the appropriate alternative according to Sandviks strategies.
Chapter 3 G.Carlsson & R.Ericsson Method
3.6.1
CorrelationCorrelation refers to the relationship between two individual assets. Correlation is measured between +1 and -1, where a positive relationship indicates that assets move in the same direction given external circumstances, while a negative refers to the opposite (Aczel & Sounderpandian, 2009). We needed to calculate the pairwise correlation between all currencies in the baskets, which was a requirement to manage the latter calculations. The correlation has been based on historical spot rates and was calculated using an add-in function in Excel. Another alternative is to base the correlation on daily returns. After further research we concluded that an estimation based on spot rates would be preferred. The function created a table that illustrated the correlation between the basket’s currencies (see appendix 11-20). The procedure was repeated every third month, to continuously generate correlations based on historical data for the last year. In total, 37 different correlation tables were compiled.
3.6.2
Standard deviationStandard deviation is a statistical measurement and explains how much a data set varies from its mean. A high standard deviation refers to a dataset widely spread around the mean. It is a measure of risk, where a high standard deviation is an indication of a risky asset and a low standard deviation the opposite (Ramos, Staking, Calle, Beato, O'Shea, & Carrasco, 2000).
The minimum variance portfolio calculations required a standard deviation for each currency involved. The standard deviations of the currencies were calculated and based on daily returns on our collected dataset. The minimum variance portfolio requires annual standard deviation, which was solved by multiplying the daily standard deviation by √ . The square root sign is necessary because standard deviation is the square root of the variance. As mentioned in the correlation section, the same procedure needed to be done for standard deviation, where each standard deviation was calculated 37 times.
3.6.3
Risk free rateThe Black-Scholes formula requires a risk free rate, which in our case was based on historical data. The data was based on the period 2002-2012 and was collected from The Central Bureau of Statistics. We approximated the risk free rate to 4,5%, which was used throughout our calculations (The Central Bureau of Statistics, 2012). The risk free rate was also approximated based on several countries risk free rates, since the basket consists of eighteen different currencies. The risk free rate was set as constant to increase the transparency for Sandvik AB. This indicates that changes in the basket variance can be located in a more effective way.
3.6.4
WeightsThe currencies are represented in both negative and positive weights, and it is important to ensure that the currencies in total correspond to 100% of the basket. A consistently on-going problem throughout this thesis has been to manage the negative weights. If one
Chapter 3 G.Carlsson & R.Ericsson Method
currency equals -20%, the remaining currencies should represent 120%. The reason why there are negatively weighted currencies is because of Sandvik’s currency exposure. To clarify this, if each currency were to be hedged individually, there would be both put- and call options. Therefore, the basket will contain both positive and negative weights, but still be classified as a basket put option.
3.6.5
Minimum variance PortfolioThe Minimum Variance Portfolio is an approach to calculate the basket variance based on several variables.
∑ ∑ ∑
(2)
The formula above illustrates how to calculate the variance of a basket. The X’s represents the weights of the different assets, denotes the standard deviation of an individual asset and is the correlation between two currencies (Elton, Gruber, Brown and Goetzmann,
2009).
An example that illustrates the concept is provided:
Asset 1 Assets 2
Weight: 50% Weight: 50% Correlation: 0,3
Standard Deviation: 30% Standard Deviation: 20% Avg. Std. = 25% Basket Variance
√
The basket standard deviation was calculated to approximately 20% which demonstrates the effect of diversifying risks by including more assets to a portfolio since the average standard deviation between the two assets equal 25%. A larger amount of assets will most likely reduce the basket variance in relation to the average variance between each asset from an individual perspective (Yunker & Melkumian, 2013). The individual risks approach to zero as the number of currencies goes to infinity, which refers to a non-systematic risk. (Elton et al, 2009).
Sandvik’s basket consists of 18 currencies and it is necessary to use a matrix to compute the variance. If the calculations were performed manually it would be too complex and time-consuming.
[ ] [
] [ ] (3)
Chapter 3 G.Carlsson & R.Ericsson Method
The matrix calculates the basket variance and is a conversion of the numerical version of the portfolio variance formula (see formula 2).
3.6.6
Black-ScholesThe most widely used formula or method when calculating the value of an option is the Black-Scholes formula. The theory developed by Black and Scholes (1973), where the value of an option depends on the time to maturity, the volatility and the underlying asset price of an option can be derived from a mathematical formula. The valuation formula for a European call option is as follows:
(4)
Where w(x,t) stands for the value of the option, the x is the price of the underlying asset and c is indicating the exercise price. The letter r stands for the interest rate, which is also known as the “risk free rate”, and (t*- t) denotes the time to maturity. The N(d1) and N(d2)
represent the areas under a standard normal distribution table, which is calculated as follows:
⁄ ( √ )
(5)
⁄ ( √ )
(6)
The standard deviation denotes the letter v in the formula above. This is equivalent to the volatility and implies the risk of the option. The value of a European put option can be derived from the associated call option since they both must be exercised solely at the exercise date. Subsequently the value of the put option is computed from the formula:
(7)
Where u(x,t) denotes the value of the European put option (Black & Scholes, 1973).
The underlying asset price in this formula is denoted by the exposed sum in foreign currencies that Sandvik is realizing. Sandvik’s currency risk management program involves buying basket put options. The formula developed by Black-Scholes will compose the foundation of our calculated premium when evaluating the Layered Basket Option hedging model.
3.7 Assumptions
There are several assumptions to take into consideration regarding modern portfolio theory. Assumptions appear to be unrealistic since models and formulas used in finance are providing a researcher with expected values. However, a few assumptions have a greater impact on this subject than others (Elton et al, 2009). The correlation between assets is assumed to be fixed. In reality, the correlation between assets is constantly changing (Kritzman and Thomas, 2004). Since the correlation between our currencies is one of the
Chapter 3 G.Carlsson & R.Ericsson Method
key variables when determining the basket variance, this assumption is fundamental for this thesis.
Another assumption that had to be considered was transaction costs. A transaction cost is referred to as a cost incurred in making a transaction or an exchange (McDowell, Thom, Frank, & Bernanke, 2006). An example is when a person is selling or buying stocks and has to pay a fee to a broker. In our case only the premium is taken into consideration and other transaction costs has been ignored. The last assumption we had to consider was to ensure that the collected data was normally distributed. Normal distribution means that most of your data is gathered around a mean and the distribution follows a bell-shaped curve (Aczel & Sounderpandian, 2009).
3.8 The layered hedging approach
A layered approach is conducted when performing the hedging strategy and the time to maturity (t*- t) is therefore three, six, nine and twelve months respectively. This obliges us to further divide the basket into four options with equal exposure and calculate the value respectively with the different hedge tenors. These different values, where the option with three months has the lowest value and the one with twelve has the highest and are summarized to attain a total value of an ATM-basket put options. The summarized value obtained by using the Black-Scholes formula is the premium of the basket option (see formulas 4-7).
3.9 The effects of applying a basket
A basket of 18 currencies have been used throughout our examined period. When the currencies are placed in a basket, a diversification effect is created. If the currencies were hedged individually, the effect would disappear. There is a possibility that the basket’s variance eventuates higher than the average variance between the individual currencies. Currencies with large weights in combination with high correlations and standard deviations can result in a higher basket variance. We have calculated the effects of diversification throughout our investigated time-period. The reason why this is performed is to conclude whether a basket is consistently the best alternative.
∑ (8)
The X represents the amount in one currency and denotes for that currency’s standard deviation. The symbolizes the confidence interval and is set to 95% (Linsmeier and Pearson, 1996).
Chapter 3 G.Carlsson & R.Ericsson Method
3.10 Alternative hedging strategies
Besides calculating the outcomes when a Layered Basket Option hedging strategy has been used, the results from other strategies have been calculated as a comparison.
Spot Rates – The spot rate indicates that no hedging strategy is applied, and the corporation instead relies on the spot rates.
3-month Forwards – We have computed the outcome if forward contracts with an expiry date in three months were used as Sandvik’s hedging strategy.
Layered Forwards – A combination between two strategies, where forward contracts with different expiration dates were used. This strategy is similar to the Layered Basket Option hedging but the options have been swapped for forward contracts.
3-month Basket Options – This strategy demonstrates the outcome if the layered approach was excluded from the Layered Basket Option hedging strategy. Basket options with an expiration date in three month have been tested as Sandvik’s hedging strategy.
3.11 Improved baskets
Instead of having a basket consisting of 18 different currencies we have tried to reduce the basket’s variance by dividing the large basket into several smaller baskets. The correlation has been the benchmark when the new baskets have been constructed. Baskets with optimal structure have been searched for, where the correlation and weights have been strategically examined and assembled to reach a lower total variance. We have examined certain quarters in order to establish an improved currency distribution between baskets.
3.12 Manipulation of variables to realize the actual effect of changes
We have performed a simulation where the underlying variables in the Minimum Variance Portfolio formula have been manipulated. The correlation has varied between different periods, and it has been difficult to grasp the actual outcomes caused by changes in the correlation. The correlation was reduced by 10 percent. This implies that if two currencies have a correlation of 0,4 it will be changed to 0,36, while if the correlation between to currencies equals -0,6 it will be shifted to -0,66. The currencies standard deviation has been relatively consistent throughout the examined time-period. Each currencies standard deviation was reduced by 10 percent to understand the relationship between the basket variance and the underlying currencies standard deviation. That is, to realize with what percent the variance will change after a 10 percent change in the standard deviation. The purpose is to simplify the searches for improved baskets. If we understand why baskets behave in different ways, it will simplify our restructuring of a basket to reach a more desired outcome.