http://www.diva-portal.org
Postprint
This is the accepted version of a paper published in Acta Obstetricia et Gynecologica Scandinavica. This paper has been peer-reviewed but does not include the final publisher proof-corrections or journal pagination.
Citation for the original published paper (version of record): Ulfsdottir, H., Saltvedt, S., Georgsson, S. (2018) Waterbirth in Sweden - a comparative study
Acta Obstetricia et Gynecologica Scandinavica, 97(3): 341-348 https://doi.org/10.1111/aogs.13286
Access to the published version may require subscription. N.B. When citing this work, cite the original published paper.
This is the peer reviewed version of the following article: [Ulfsdottir, H., Saltvedt, S., & Georgsson, S. (2018). Waterbirth in Sweden: A comparative study. Acta Obstetricia et Gynecologica Scandinavica, 97(3), 341-348.], which has been published in final form at [10.1111/aogs.13286]. This article may be used for non-commercial purposes in accordance with Wiley Terms and Conditions for Use of Self-Archived Versions.
Permanent link to this version:
1
Waterbirth in Sweden - a comparative study
Running headline: Waterbirth in Sweden
Hanna Ulfsdottir1,2, Sissel Saltvedt3 and Susanne Georgsson2,4
1Department of Clinical Science and Education, Karolinska Institute, Stockholm,
2Sophiahemmet University, Stockholm, Sweden, 3Department of Women's and Children's
Health (KBH), Karolinska Institute, Stockholm,4Department of Clinical Science Intervention and Technology, Karolinska Institute, Stockholm Sweden,
Corresponding author:
Hanna Ulfsdottir
Sophiahemmet Högskola, Lindstedtsvägen 8, PO Box 5605,SE-114 86 Stockholm, Sweden. Email: hanna.ulfsdottir@shh.se
Conflict of interest statement
2
Abstract
Introduction: The literature describes advantages for mothers giving birth in water, but
waterbirth is controversial in Sweden and has not been offered at hospitals until recently. This study aimed to describe and compare the characteristics and outcome of waterbirths with spontaneous vaginal births at the same clinics. Material and methods: A retrospective cohort study was conducted on all waterbirths at two maternity units in Sweden from March 2014 to November 2015 (n=306), and a consecutively selected comparison group of 306 women having conventional spontaneous vaginal births. Logistic regression was used to analyze the primary outcome; second-degree perineal tears. Results: Women giving birth in water had a lower risk of second-degree perineal tears (adj. OR 0.6 [95% CI 0.4-0.9]). Their labor was shorter (6:03 hrs. vs 7:52 hrs.) and there were significantly less interventions than in the comparison group; amniotomy (13.7% vs. 35.3%), internal cardiotocography (11.1% vs.56.8%), and augmentation with oxytocin (5.2% vs.31.3%). There were no differences in Apgar scores or admissions to neonatal intensive care unit. The experience of childbirth, measured with a numeric rating scale, was higher in the waterbirth group indicating a more positive birth experience. Three newborns born in water had an umbilical cord avulsion.
Conclusions: In this low-risk population, waterbirth is associated with positive effects on
perineal tears, the frequency of interventions, the duration of labor and women’s birth experience. Midwives handling waterbirth should be aware of the risk of umbilical cord avulsion.
Keywords
birth; water immersion; perineal tears; waterbirth; experience of childbirth
Abbreviations
CTG cardiotocography
NICU neonatal intensive care unit NRS numeric rating scale
NWBG non waterbirth group
3
Key message
Waterbirth is associated with a lower frequency of perineal tears as well as fewer
interventions and a more positive birth experience than conventional spontaneous vaginal births.
Introduction
Waterbirth is associated with positive effects for the woman, such as, relaxation, pain relief and buoyancy effects facilitating mobility and a sense of control which lead to a positive birth experience (1, 2). Randomized controlled studies with immersion in water substantially during the first stage of labor, showed less need for anesthesia and a shorter duration of first stage of labor (1). A review, including mostly observational retrospective studies containing more than 31,000 waterbirths, noted no increased risk for either maternal infections or postpartum hemorrhage at waterbirth (3).
The incidence of perineal tears in waterbirth are contradictive and perineal protection by hands is used to varying degrees in water (4). A review of 38 studies containing 31,453 waterbirths concluded that waterbirth was associated with a higher incidence of intact perineum, and if lacerations occurred in water, they were less severe than in conventional births (3), whereas a recent retrospective cohort study, including 6,521 waterbirths and 10,290 conventional births, comparing any perineal laceration with no laceration, found increased lacerations in waterbirth (5). Another study calculating risk factors for sphincter ruptures, containing16,920 births, found an increased risk for the 298 (1.9%) waterbirths included (6). A second-degree tear, involving the perineal muscles and the rectovaginal fascia, may lead to consequences, such as, prolapse of pelvic organs in the long-term (7), rectocele (8) and affect sexual functioning (9).
The safety of the newborn is disputed (10), although differences in Apgar scores, infections or other neonatal complications have not been reported in studies comparing waterbirths with other low-risk births (3, 11, 12). However, case reports with an adverse outcome for the
4
newborn following waterbirth have been presented (13, 14). Additionally, umbilical cord avulsion is more frequent in waterbirth than in conventional birth (3).
In Sweden, almost all births take place at hospitals, although maternity care is provided to a large extent autonomously by midwives. There are no freestanding Birth Centers and the care is medically oriented with a frequent use of interventions (15, 16). Until recently, planned waterbirths have only been found among the 70-75 home-births/year. Waterbirth is provided to low-risk women worldwide, but has not been an option in Swedish hospitals the past decades until a new birth clinic was established in Stockholm in 2014. This made it possible, for the first time, to describe and compare the characteristics and outcome of waterbirth with that of conventional birth in a Swedish context, with the primary outcome of a second-degree perineal tear.
Material and methods
A retrospective cohort study design was chosen to be able to include all waterbirths during the period of time. The participants were recruited from March 2014 - November 2015 from the two clinics in Sweden that offered waterbirth during this time frame. The comparison group was selected consecutively with the next coming conventional spontaneous vaginal birth with the same parity at the same clinic. There are no national guidelines for waterbirth in Sweden. The guidelines at the clinics present in this study admitted women with previous caesarean section, as well as prelabor rupture of the membranes > 18 h and or induction if
uncomplicated pregnancy. As a previous vaginal birth affect the incidence of perineal tears and this was the primary outcome, women with cesarean section and no previous vaginal birth was classified as primiparas in both groups.
The conditions differed in some respects between the two clinics, both situated in Stockholm. The recently established clinic, where the majority of the women in the study gave birth (93%, n=284+284), was a clinic with approximately 3,300 births per year. The care at this clinic was woman-centered with a majority of low risk pregnancies and non-admission of high-risk pregnancies. Monitoring with cardiotocography (CTG) in water was possible, external as well as internal which enabled the woman to remain bathing for as long as she wished if labor was normal. This clinic had corner tubs in every room, which allowed the possibility to move and change position. The other clinic, where a minority of the women
5
gave birth (7%, n=22+22), was a modified in-hospital birth center with the same medical guidelines as standard care. At this clinic, there were 1,400 low-risk births per year. There was no possibility of CTG monitoring in water and CTG had to be registered every second hour according to clinic guidelines. This restricted water immersion time. The smaller clinic had bath tubs of a domestic model which reduced the possibility for the woman to change position. Both clinics had continuous support during active labor and offered waterbirth only to low-risk women according to clinical guidelines. Both clinics offered nitrous oxide in the bath.
Body mass index was categorized according to the World Health Organization (17). The duration of the first stage of labor was measured from established contractions until fully dilated cervix. The duration of the second stage was divided into two parts; the passive second stage - from fully dilated cervix until the time for pushing, and the active second stage, from pushing until birth. Total time of labor was counted from established contractions until birth. Dystocia of labor was registered according to Swedish national guidelines; when passing action line with three hours delay from alert line (18). Information about lacerations in the vagina and perineum was based on the classification in the birth records with degrees of perineal tears (I-IV) (19). Admission to a neonatal intensive care unit (NICU) and a weight reduction >10% of the birthweight which is considered as limit for acceptable weight reduction without taking action according to Swedish guidelines, were registered during postnatal stay or at the revisit to hospital.
A numerical rating scale (NRS) was used to measure the experience of childbirth. The woman rated her overall experience of the birth, with 0 signifying the worst imaginable experience and 10 the best imaginable experience. The rating was made before discharge from hospital.
Statistical analyses
A power calculation was performed for the primary outcome - second-degree perineal tear. To detect a difference of ±10 percentage points from 27 % in the rate of second-degree tears, we needed 576 (decrease)/722 (increase) women to reach 80% power with a two-sided
significance level of 5%. Comparative analyses were performed with Fisher’s exact tests for categorical variables and t-tests for continuous parametric variables. Crude and adjusted odds
6
ratio (OR) with a 95% confidence interval were analyzed for the primary outcome, second-degree tear and waterbirth/non waterbirth. When analyzing, the second-degrees of perineal tears were merged as ≤1 and ≥2. These composite variables were made as a third- or fourth-degree tear also entails a second-degree tear. Variables significantly associated with perineal tears in the univariable analysis, as well as known risk factors for perineal tears; head circumference (>36cm), augmentation with oxytocin and a longer (>45 min and >60 min) active second stage were entered into the logistic regression along with waterbirth/non waterbirth to adjust for these confounders. Head circumference, and not birthweight, was chosen as there was a difference in head circumference between the two groups. Missing data were reported for each variable when the number was less than 306. The data were entered and analyzed in the data program SPSS 24 for Windows, version 22 (SPSS Inc., Chicago).
Ethical approval
The Regional Ethical Review Board in Stockholm approved the study (DNR 2014/2077-31, 2016/718-32).
Results
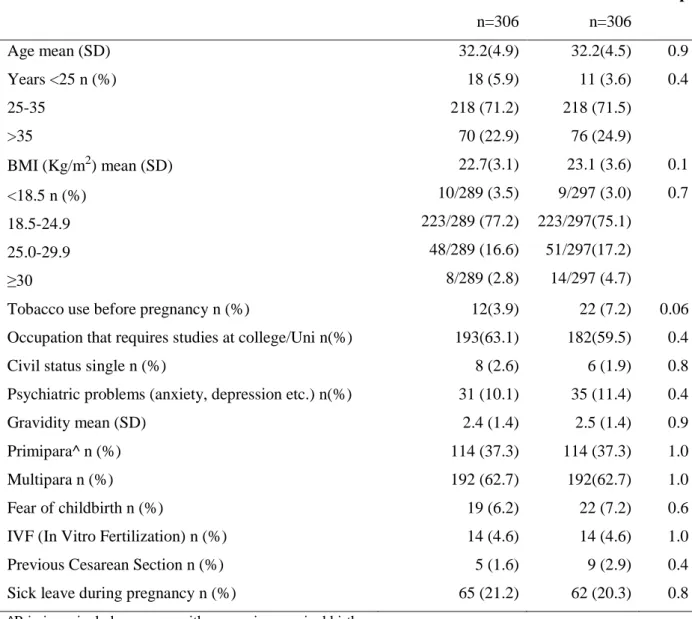
During the study period 306 women gave birth in water, 114 (37.3%) were primiparas, and 192 (62.7%) were multiparas defined as having at least one previous vaginal birth. The same numbers and proportions are valid for the comparison group. There were no significant differences in background characteristics or in obstetric data between the groups (Table 1). Eleven (3.6%) of the women in the waterbirth group (WBG) had a note in the antenatal records that they wished to give birth in water. No severe diagnoses that would have excluded a waterbirth were detected in the comparison group.
Interventions and characteristics of the births are described in Table 2. Induction of labor occurred to the same extent in both groups, with the most frequent indications being
postmaturity and prelabor rupture of the membranes. In the WBG, the majority was induced by oxytocin infusion although prostaglandins also occurred. Augmentation with oxytocin in the WBG was used both prior to and during immersion. There were significantly more women in the non waterbirth group (NWBG) who had an, amniotomy, while significantly more
7
women in the WBG delivered a baby with intact membranes at birth. Epidural or spinal anesthesia were used by 107 (34%) of the women in the NWBG and were not an option in the WBG. Intravenous antibiotics were administrated according to Swedish guidelines to 18 women (5.9%) in the WBG and 31 women (11.1%) in the NWBG with the indications prelabor rupture of the membranes (>18 hours), or known group B streptococcus (GBS) colonization in urine.
Of the women in the NWBG, 103 (33.6%) immersed in water some time during the first stage of labor but left the tub before birth. The birth positions were not stated in the WBG, as the box intended for stating birth position was used to specify the waterbirth. The most common birth positions in the NWBG were kneeling, 77 (25.2%), followed by birth seat, 66 (21.6%), sitting, 52 (17%), on the side, 50 (16.4%) and on all fours 29 (9.5%).
In the WBG, the mean dilatation of the cervix when immersing was 6.7 cm and the mean duration of time in the bath was 2:13 hrs:min (min-max 0:04-13:13 SD2:09).
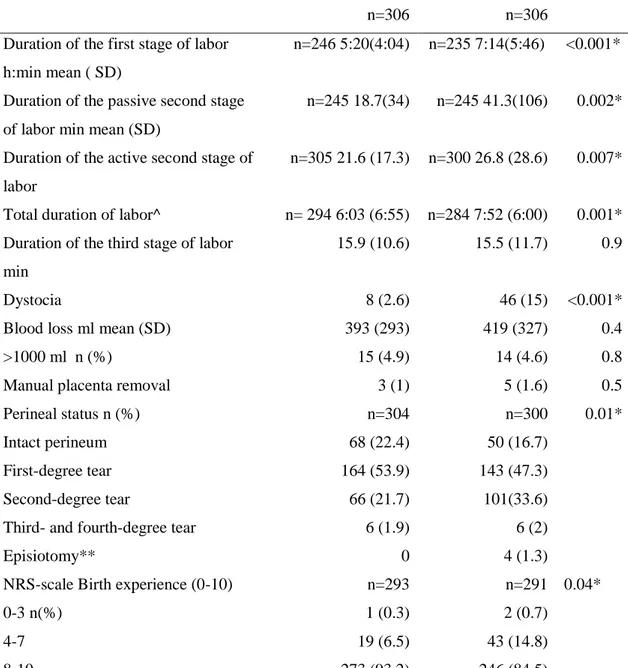
There was a significant difference in the frequency of second-degree perineal tears (21.7% vs 33.6 %). The duration of labor was significantly shorter in the WBG and the frequency of labor dystocia was significantly higher in the NWBG as were the interventions amniotomy and use of oxytocin (Table 3). The total numbers of births were oxytocin were used was 96. When subtracting the numbers of inductions (31) and/or diagnoses with labor dystocia (46) from the numbers of births where oxytocin was used, there is an overuse of oxytocin in 22 births in the NWBG, as three women had both induced labor and labor dystocia (Table 2 and 3). In the WBG, there were 19 women who did not have augmentation with oxytocin after doing the same subtraction. Three women with induced labor had labor dystocia in the
NWBG, while none of the women with induced labor in the WBG had labor dystocia. Table 4 shows the crude and adjusted odds ratio for second-degree tears in the WBG compared with the NWBG.
The NRS-score of birth experience from 0 (worst imaginable) to 10 (best imaginable) was divided into groups and showed that women giving birth in water had a significantly more positive birth experience than the comparison group (Table 3).
In Table 5, the neonatal characteristics and outcome are described. One newborn in the WBG, and two in the NWBG had an Apgar score < 7 in 5 minutes and one newborn in the NWBG had an Apgar Score < 7 in 10 minutes. The diagnoses for admission to NICU were, WBG vs.
8
NWBG, jaundice 3 vs. 7, asphyxia or respiratory distress 3 vs. 6 and sepsis 0 vs. 3. Further diagnoses were hypoglycemia, congenital heart defects, feeding problems, fever, congenital anemia and hyponatremia.
Three newborns had an umbilical cord avulsion at birth in the WBG and none in the
comparison group. None of these neonates required blood transfusion or admission to NICU.
Discussion
The main findings in this cohort study of waterbirths were the lower rate of second degree perineal tears, fewer interventions, a more positive birth experience and a shorter duration of labor in the WBG. Three umbilical cord avulsions occurred in the WBG.
A reasonable explanation to the lower frequency of second-degree perineal tear in the WBG is the positive effect of warmth in the perineum, leading to vasodilatation and increased blood supply, as previously described in randomized controlled studies, when warm compresses or warm packs in perineum were used in conventional births (20). Moreover, the midwives´ management of the second stage in waterbirth is often described as more ‘wait and see’ and “non-directive”, with spontaneous pushing and slower delivery as consequences (4), which together with relaxation could have a protective effect. Another conceivable hypothesis could be the buoyancy effect which reduce the weight of the baby when the shoulders are delivered. There was insufficient documentation regarding how perineal protection was performed. The frequency of second-degree tears, according to the classification by the Royal College of Obstetricians and Gynaecologists (19), varies from 20-44% in previous studies (21-23). There is a risk of inaccuracy in diagnoses when relying on birth records, but as the births in the two groups were from the same clinics, one can presume that potential misdiagnoses are equally distributed in both groups. A reduction in episiotomy has been shown in several studies of waterbirth and is explained by the more ’wait and see’ approach (24, 25). Similarly, in this study, no episiotomies were performed in the WBG and four in the non-WBG.
Several interventions were used in waterbirths in the present study. Oxytocin for
augmentation of labor is used excessively in Sweden; 50-55% of all births with spontaneous onset are augmented, 20-35% of them without a labor dystocia diagnosis (16, 26). Labor dystocia was significantly more common in the NWBG (46 vs. 8), which could explain a
9
greater use of oxytocin in this group. However, the overuse of oxytocin in twenty-two births is not seen in the WBG. On the contrary, the use of oxytocin in the WBG is less than the sum of inductions and labor dystocia. This result of lesser use of oxytocin, together with the significantly lower frequency of amniotomies, internal CTG, in combination with a higher frequency of intact membranes, establishes that waterbirths are associated with fewer
interventions than conventional births (27). In other countries, women who choose waterbirth more often may be committed to a natural birth without medical interventions (4). However, in the present study, only 11 (3.6%) stated in advance that they wanted a waterbirth, an
indication that this sample probably differs from previous studies, and the women´s attitude to birth may be fairly similar in both groups. The guidelines for CTG-monitoring in Sweden commonly include a 20-30 minute registration every second or third hour, in contrast to NICE´s (National Institute for Health Care Excellence in UK) guidelines (2017) of not recommending CTG to low-risk births (28). This study shows that waterbirth is compatible with the Swedish guidelines.
In this study, the duration of both the first and second stage was shorter in waterbirth than in non-water birth. The distinction between first and second stage in labor is unreliable as it depends on occasions and frequency of vaginal examinations. However, the total time of labor is reliable and equally assessed in both groups. The higher frequency of labor dystocia in the NWBG indicates a selection of women diagnosed with dystocia, and is one explanation of the longer duration of labor in this group. One third of the women who did not give birth in water, immersed in water at some time during labor. It is unknown whether these women had an intention to give birth in water and were interrupted bathing due to complications or of own free will. However, there were no women in the NWBG who were rapidly evacuated from the tub due to acute medical complications. Previous studies have shown a shorter duration of labor in waterbirth.
There were no significant differences in Apgar scores and a non-significant difference in the number of neonates admitted to NICU (19 NWBG vs. 9 WBG). Any difference in this aspect is reasonably explained by a selection of more complicated births in the NWBG, as more neonates had meconium stained amniotic fluid (41 vs. 15) and more women had labor dystocia in this group. In a meta-analysis, including 39,302 births, some evidence for higher Apgar scores and higher umbilical cord pH-values was found among babies born in water compared to conventional low-risk births, which could have the same explanation (12). The absence of epidural anesthesia (EDA) in the WBG could benefit the neonate as EDA have
10
been associated with a higher transmission to NICU and higher risk for resuscitation in low risk births with spontaneous onset (29). Three umbilical cord avulsions occurred in this study. As shown in previous studies, there is an increased risk of umbilical cord avulsions in
waterbirth, mostly occurring when the baby is brought to the surface (3) From a midwifery perspective, it is of great importance to be aware of this risk, as it could have devastating consequences. If discovered and the cord is clamped immediately, the risk of complications is minimized (3).
The birth experience was rated higher in the WBG. This is in line with previous studies, and the more positive experience is related to the water helping the woman to be relaxed, feel safe and in control (1, 2).
The data collection is reliable and includes several parameters. The records were thoroughly scrutinized by one of the authors (HU) and the study included all births that occurred in water during the period of data collection. With the intention to find an equitable comparison group with the low-risk WBG, the next spontaneous vaginal births with the same parity was
consecutively selected from the electronic database at the same clinics. There were no differences in the background characteristics between the waterbirth and the comparison group, but as no randomization was performed, there might be a risk for selection bias. It cannot be ruled out that women in the NWBG had medical reasons for discontinuing, or not being offered waterbirth. Generalizations to the Swedish population should be made with caution as the two clinics included in the study both were city hospitals with a higher
educated, older and well-off group of women with a lower body mass index than the national average in Sweden (30).
Waterbirth had a protective effect regarding second-degree tears and was associated with fewer interventions, shorter duration of labor as well as a more positive birth experience compared with conventional spontaneous vaginal births. Waterbirth did not increase the number of admissions to NICU and no differences in Apgar scores were detected. Attention should be paid to the risk of umbilical cord avulsion at waterbirths.
Acknowledgement
The authors would like to thank PhD Hans Jernbert Peterson at the Department of Clinical Science and Education at Karolinska Institutet for help and input in statistical matters.
11
Funding
This study was supported by a grant from Sophiahemmet Foundation for Clinical Research.
References
1.Cluett ER, Burns E. Immersion in water in labour and birth. Cochrane Database Syst Rev. 2009(2):CD000111.
2.Richmond H. Women's experience of waterbirth. Pract Midwife. 2003;6(3):26-31.
3.Nutter E, Meyer S, Shaw-Battista J, Marowitz A. Waterbirth: an integrative analysis of peer-reviewed literature. J Midwifery Womens Health. 2014;59(3):286-319.
4.Garland D. Revisiting Waterbirth: An attitude to care. United Kingdom: palgrave Mc Millan; 2010. 5.Bovbjerg ML, Cheyney M, Everson C. Maternal and Newborn Outcomes Following Waterbirth: The Midwives Alliance of North America Statistics Project, 2004 to 2009 Cohort. J Midwifery Womens Health. 2016;61(1):11-20.
6.McPherson KC, Beggs AD, Sultan AH, Thakar R. Can the risk of obstetric anal sphincter injuries (OASIs) be predicted using a risk-scoring system? BMC Res Notes. 2014;7:471.
7.Tegerstedt G, Miedel A, Maehle-Schmidt M, Nyren O, Hammarstrom M. Obstetric risk factors for symptomatic prolapse: a population-based approach. Am J Obstet Gynecol. 2006;194(1):75-81. 8.Mustain WC. Functional Disorders: Rectocele. Clin Colon Rectal Surg. 2017;30(1):63-75. 9.Signorello LB, Harlow BL, Chekos AK, Repke JT. Postpartum sexual functioning and its relationship to perineal trauma: a retrospective cohort study of primiparous women. Am J Obstet Gynecol. 2001;184(5):881-8; discussion 8-90.
10.ACOG/AAP. ACOG Committee Opinion no. 594: Immersion in water during labor and delivery. Obstet Gynecol. 2014;123(4):912-5.
11.Davies R, Davis D, Pearce M, Wong N. The effect of waterbirth on neonatal mortality and morbidity: a systematic review and meta-analysis. JBI Database System Rev Implement Rep. 2015;13(10):180-231.
12.Taylor H, Kleine I, Bewley S, Loucaides E, Sutcliffe A. Neonatal outcomes of waterbirth: a systematic review and meta-analysis. Arch Dis Child Fetal Neonatal Ed. 2016;101(4):F357-65. 13.Collins SL, Afshar B, Walker JT, Aird H, Naik F, Parry-Ford F, et al. Heated birthing pools as a source of Legionnaires' disease. Epidemiol Infect. 2015:1-7.
14.Mammas IN, Thiagarajan P. Water aspiration syndrome at birth - report of two cases. J Matern Fetal Neonatal Med. 2009;22(4):365-7.
15.Sandin-Bojo AK, Kvist LJ. Care in labor: a Swedish survey using the Bologna Score. Birth. 2008;35(4):321-8.
12 16.Selin L, Almstrom E, Wallin G, Berg M. Use and abuse of oxytocin for augmentation of labor. Acta Obstet Gynecol Scand. 2009;88(12):1352-7.
17.WHO. Obesity: preventing and managing the global epidemic. Report of a WHO consultation. Geneva: World helath Organization; 2000.
18.Cooperation of National Medical Indications. Report 2008-130-7. In: Welfare NBoHa, editor. Sweden2011.
19.Royal College of Obstetricians and Gynaecolgists . Green-top Guideline., Stat. No 29. (2007). 20.Aasheim V, Nilsen AB, Lukasse M, Reinar LM. Perineal techniques during the second stage of labour for reducing perineal trauma. Cochrane Database Syst Rev. 2011(12):CD006672.
21.Albers LL, Sedler KD, Bedrick EJ, Teaf D, Peralta P. Factors related to genital tract trauma in normal spontaneous vaginal births. Birth. 2006;33(2):94-100.
22.Samuelsson E, Ladfors L, Lindblom BG, Hagberg H. A prospective observational study on tears during vaginal delivery: occurrences and risk factors. Acta Obstet Gynecol Scand. 2002;81(1):44-9. 23.Smith LA, Price N, Simonite V, Burns EE. Incidence of and risk factors for perineal trauma: a prospective observational study. BMC Pregnancy Childbirth. 2013;13:59.
24.Bodner K, Bodner-Adler B, Wierrani F, Mayerhofer K, Fousek C, Niedermayr A, et al. Effects of water birth on maternal and neonatal outcomes. Wien Klin Wochenschr. 2002;114(10-11):391-5. 25.Menakaya U, Albayati S, Vella E, Fenwick J, Angstetra D. A retrospective comparison of water birth and conventional vaginal birth among women deemed to be low risk in a secondary level hospital in Australia. Women Birth. 2013;26(2):114-8.
26.Svardby K, Nordstrom L, Sellstrom E. Primiparas with or without oxytocin augmentation: a prospective descriptive study. J Clin Nurs. 2007;16(1):179-84.
27.Cluett ER, Pickering RM, Getliffe K, St George Saunders NJ. Randomised controlled trial of labouring in water compared with standard of augmentation for management of dystocia in first stage of labour. BMJ (Clinical research ed). 2004;328(7435):314.
28.NICE guidelines NIfHCE. Intrapartum care for healthy women and babies. 2017.
29.Herrera-Gomez A, Garcia-Martinez O, Ramos-Torrecillas J, De Luna-Bertos E, Ruiz C, Ocana-Peinado FM. Retrospective study of the association between epidural analgesia during labour and complications for the newborn. Midwifery. 2015;31(6):613-6.
30.The Swedish Medical Birth Register: Pregnancies, Deliveries and Newborn Infants 1973–2013, Assisted Reproduction, treatment 1991–2012. Sweden; 2014.
13 Legends
Table 1. Maternal characteristics.
Table 2. Interventions and characteristics of the births. Table 3. Birth outcome.
Table 4. Factors associated with second-degree perineal tears. Table 5. Neonatal characteristics and outcome.
Table 1. Maternal characteristics. Waterbirth n=306 Non WB n=306 p Age mean (SD) Years <25 n (%) 25-35 >35 32.2(4.9) 18 (5.9) 218 (71.2) 70 (22.9) 32.2(4.5) 11 (3.6) 218 (71.5) 76 (24.9) 0.9 0.4 BMI (Kg/m2) mean (SD) <18.5 n (%) 18.5-24.9 25.0-29.9 ≥30 22.7(3.1) 10/289 (3.5) 223/289 (77.2) 48/289 (16.6) 8/289 (2.8) 23.1 (3.6) 9/297 (3.0) 223/297(75.1) 51/297(17.2) 14/297 (4.7) 0.1 0.7
Tobacco use before pregnancy n (%) 12(3.9) 22 (7.2) 0.06 Occupation that requires studies at college/Uni n(%) 193(63.1) 182(59.5) 0.4 Civil status single n (%) 8 (2.6) 6 (1.9) 0.8 Psychiatric problems (anxiety, depression etc.) n(%) 31 (10.1) 35 (11.4) 0.4
Gravidity mean (SD) 2.4 (1.4) 2.5 (1.4) 0.9
Primipara^ n (%) 114 (37.3) 114 (37.3) 1.0
Multipara n (%) 192 (62.7) 192(62.7) 1.0
Fear of childbirth n (%) 19 (6.2) 22 (7.2) 0.6
IVF (In Vitro Fertilization) n (%) 14 (4.6) 14 (4.6) 1.0
Previous Cesarean Section n (%) 5 (1.6) 9 (2.9) 0.4
Sick leave during pregnancy n (%) 65 (21.2) 62 (20.3) 0.8
Table 2. Interventions and characteristics of the births Waterbirth n=306 n (%) Non WB n=306 n (%) p Gestational age 36+2-37+0 37+1-41+0 41+1-42+1 3 (1) 260 (85) 43 (14.1) 2 (0.7) 244 (79.7) 59 (19.3) 0.18 Induction of labor 25(8.2) 31(10.1) 0.4 Amniotomy 42(13.7) 108(35.3) <0.001*
Intact membranes at birth 13 (4.2) 1(0.3) 0.002*
Oxytocin iv 16 (5.2) 96(31.3) <0.001* Internal CTG 34 (11.1) 174 (56.8) <0.001* TNS (Transcutaneous Nerve Stimulation) 26 (8.4) 33 (10.8) 0.3 Nitrous oxide 180 (58.8) 228 (74.5) <0.001* Sterile water injections 19 (6.2) 21(6.8) 0.7 Acupuncture 39 (12.7) 41(13.4) 0.8 Occiput posterior 5 (1.6) 2(0.7) 0.2
Table 3. Birth outcome Waterbirth n=306 Non Waterbirth n=306 P
Duration of the first stage of labor h:min mean ( SD)
n=246 5:20(4:04) n=235 7:14(5:46) <0.001* Duration of the passive second stage
of labor min mean (SD)
n=245 18.7(34) n=245 41.3(106) 0.002*
Duration of the active second stage of labor
n=305 21.6 (17.3) n=300 26.8 (28.6) 0.007*
Total duration of labor^ n= 294 6:03 (6:55) n=284 7:52 (6:00) 0.001* Duration of the third stage of labor
min
15.9 (10.6) 15.5 (11.7) 0.9
Dystocia 8 (2.6) 46 (15) <0.001*
Blood loss ml mean (SD)
>1000 ml n (%) 393 (293) 15 (4.9) 419 (327) 14 (4.6) 0.4 0.8
Manual placenta removal 3 (1) 5 (1.6) 0.5
Perineal status n (%) Intact perineum
First-degree tear Second-degree tear
Third- and fourth-degree tear Episiotomy** n=304 68 (22.4) 164 (53.9) 66 (21.7) 6 (1.9) 0 n=300 50 (16.7) 143 (47.3) 101(33.6) 6 (2) 4 (1.3) 0.01*
NRS-scale Birth experience (0-10) 0-3 n(%) 4-7 8-10 n=293 1 (0.3) 19 (6.5) 273 (93.2) n=291 2 (0.7) 43 (14.8) 246 (84.5) 0.04*
Table 4. Factors associated with second-degree perineal tears.
n=604
(8 missing data of perineal tears)
Second-degree tear or more n (%) OR (95% CI) Adjusted^ OR (95% CI)
Non waterbirth 300 (33.0) Ref
Waterbirth 304 (21.7) 0.6 (0.4-0.8)* 0.6 (0.4-0.9)* Head circumference ≤36cm 498 (28.5) Ref
>36cm 106 (35.8) 1.4 (0.9-2.1) 1.3 (0.8-2.1) Oxytocin
No 494 (27.3) Ref
Yes 110 (40.9) 1.9 (1.2-2.9)* 1.3 (0.8-2.1) Pushing ≤45min (n=597) 526 (26.8) Ref
Pushing 46-60 42 (47.6) 2.5 (1.4-4.7)* 2.6 (1.4-5.0)* Pushing >60min 29 (55.2) 3.4 (1.6-7.2)* 2.8 (1.3-6.1)*
Table 5. Neonatal characteristics and outcome WB n=306 Non WB n =306 p Girl n (%) Boy n (%) 151 (49.3) 155 (50.7) 140 (45.8) 166 (54.2) 0.4 Apgar score<7 in 5 minutes n (%) 1(0.3) 2 (0.7) 1.0 Weight (gram) mean (SD) 3566 (419.7) 3621 (418.7) 0.1 Length (cm) mean (SD) 50.5 (1.7) 50.9 (1.8) 0.02* Head circumference (cm) mean (SD) 34.9 (1.3) 35.2 (1.3) 0.02* Head circumference >36 cm n (%) 44 (14.4) 63 (20.6) 0.06 Meconium in amniotic fluid n (%) 15 (4.9) 41 (13.4) <0.001* Temperature ≤ 36 C Temperature ≥37.5 13/287 (4.5) 19/287 (6.6) 9/287 (3.1) 16/287 (5.6) 0.4 0.6
Umbilical cord avulsion n (%) 3 (1) 0 0.8
NICU admission n (%) 9 (2.9) 19 (6.2) 0.08
Weight reduction >10% 13 (4.2) 18 (5.9) 0.3
Breastfeeding within first two hours postpartum n (%) None Attempt Sucked Breastfed correctly n=302 9 (3.0) 23 (7.6) 79 (26.2) 191 (63.2) n=301 15 (5.0) 35 (11.6) 63 (26.2) 188 (62.5) 0.1