Master of Science Thesis
KTH School of Industrial Engineering and Management Energy Technology EGI-2013-030MSC
Division of Energy and Climate studies SE-100 44 STOCKHOLM
Energy need assessment and preferential
choice survey of rural people in Bangladesh
-2-
Master of Science Thesis EGI 2013-030MSC
Energy need assessment and preferential
choice survey of rural people in
Bangladesh
Hassan Ahmed Approved Date Examiner Semida Silveira Supervisor Brijesh Mainali-3-
Abstract
This study is a part of a poly generation project which will use animal waste or agricultural waste to produce biogas and will provide cooking gas, electricity and arsenic free clean water for drinking in rural areas of Bangladesh. The study mainly analyzes the cooking and lighting energy demand of households across different income groups in a village named “Pani Para” in the Faridpur district in Bangladesh and also looks at the potential of biogas in the village. It has been done by adopting case study method and conducting a survey in the village using a questionnaire.
Fuel mix across different income groups for meeting their cooking and lighting energy needs have also been studied along with socio-economic situation of the villagers and their preferences to change their current cooking fuel utilization patterns. Various scenarios like variation in fuel consumption patterns, priority of income expenditure and access to fuel with income level have been examined. The study also focuses to analyze the awareness of the villagers about biogas technology and their willingness to contribute for the poly generation project along with the willingness of households to pay for embracing change in current cooking and lighting fuels. Biomass potential i.e. cow dung and agricultural waste is also calculated in the surveyed village along with the production of biogas from the available biomass resources. The scenarios to provide the cooking gas, electricity and clean water through biogas poly generation project from the available resources are also investigated.
Analysis reveals that the total energy consumption (cooking and lighting) increases with the increase in the income level among the households. Average household cooking and lighting energy demand by low, medium and high income groups is 8492 kWh/yr, 9789 kWh/yr and 14806 kWh/yr respectively. Cooking energy demand and agricultural waste consumption also show an increasing trend with the increase in land holding size. Among the income expenditure priorities food is one of the most important priorities and energy being less important due to availability of biomass at little or no cost. Awareness of biogas technology among the households and willingness to contribute for the poly generation plant shows an increasing trend with the increase in education level. The study shows that there is a positive response of the villagers for being willing to embrace the change in the current cooking patterns as well as welcoming new technologies that could support such a change.
It was found that the cow dung resource in the village is not enough to produce sufficient biogas for the poly generation project. With the incorporation of the agricultural waste with the cow dung, biogas production comes quite close to requirement of the poly generation plant but however could not suffice it completely due to the lack of raw material in the studied village. In that case the scenario of providing electricity and clean water to all the villagers and providing all the three facilities to the 2/3rd of
households is investigated. 1/3rd of the low income households then could meet their cooking demands
by provision of improved cooking stoves as cooking gas could not be provided to them due to limited feedstock. The study shows that despite of the fact that cooking and lighting energy needs increase with income but there is not much variation in the fuel mix and almost everyone in the village rely on biomass to meet their energy demand. It is because there is very limited access to the modern fuel for cooking and no electricity access in the village, so the households have to rely on the traditional fuels.
Keywords: Traditional biomass fuels, energy demand, biogas poly generation, Grameen Shakti, co-generation, cooking and lighting energy.
-4-
Acknowledgements
I would like to thank Allah almighty for his countless blessings and help at every instant of my life.
I want to thank my supervisor Brijesh Mainali for his help and guidance since the start of the thesis. He has always been there to extend his cooperation in every respect during the course of my work. I have felt very comfortable in asking questions and discussing all the issues I had, and found him very helpful at all times of need.
I am grateful to Nasrin Akter who helped me throughout the thesis work. I appreciate her contributions in translation of questionnaire and interpretation during the survey and for being extremely patient to my never ending extremely bothering questions. I would like to extend my gratitude to Nasrin and her family for their hospitality and help during my stay in Bangladesh. I thank Grameen Shakti and all the people who assisted us during the survey task in Bangladesh.
This study is also done as a minor field study under the MFS program from KTH funded by SIDA through KTH. The purpose of MFS program is to conduct research studies in developing countries to understand the problems and issues of the developing countries. I would like to thank KTH for rendering me eligible for the SIDA’s scholarship for Minor field studies, without the scholarship this study would not have been materialized.
At the end I would like to thank my family who has always backed me up during the difficult times and always prayed for my success. I want to thanks all my friends in Pakistan and Sweden for their encouragement and support especially Abhinav Goyal, Umer Khalid Awan, Ankit Singhal and Kushal Lokhande for their guidance and companionship which made this journey smooth and so memorable.
-5- Table of Contents Abstract ... 3 Acknowledgements ... 4 List of Figures ... 7 List of Tables ... 7 Executive Summary: ... 8 1 Introduction ... 10 1.1 Background: ... 10 1.2 Objectives: ... 10 1.3 Methodology: ... 10 2 Theoretical Framework: ... 12 2.1 Introduction: ... 12
2.2 Rural energy and services background: ... 13
2.2.1 Energy access in developing countries: ... 13
2.3 Energy situation in Bangladesh: ... 13
2.3.1 Traditional biomass for cooking: ... 14
2.3.2 Lighting in rural Bangladesh: ... 14
2.3.3 Clean drinking water: ... 14
2.3.4 Biogas situation: ... 14
3 Data collection tools: ... 15
3.1 Questionnaire: ... 15
3.2 Household Survey: ... 15
4 Sample characteristics: ... 17
4.1 General Information of Village: ... 17
4.2 Educational status: ... 17
4.3 Household income and income groups: ... 18
4.4 Income source: ... 19
4.5 Ranking Of Expenditure: ... 20
4.6 Access to fuel: ... 21
4.7 Willingness to change: ... 22
4.8 Cooking stoves: ... 23
4.9 Priority for electrical appliances: ... 24
4.10 Land assets: ... 25
4.11 Animal resources: ... 26
4.12 Willingness to pay: ... 27
4.13 Biogas and poly-generation project: ... 28
-6-
5.1 Cooking Energy Demand: ... 31
5.2 Lighting Energy Demand: ... 33
6 Biogas from poly-generation plant: ... 36
6.1 Total biogas demand: ... 36
7 Biomass resource calculation: ... 38
7.1 Cow dung potential: ... 38
7.2 Agricultural resource potential: ... 38
7.3 Biogas potential from available resources: ... 39
7.3.1 Biogas from cow dung: ... 39
7.3.2 Biogas from Co-generation: ... 40
7.4 Utilization of biogas for meeting households demands: ... 40
8 Conclusion: ... 42
8.1 Future work: ... 43
9 Bibliography ... 44
10 Appendix ... 46
-7-
List of Figures
:Figure 1: Primary source of income of households with income groups ... 20
Figure 2: Priorities of households for income expenditure with income groups ... 21
Figure 3: Opinion of households for access to fuel with income groups ... 22
Figure 4: Main reasons to change the current cooking pattern in the village ... 23
Figure 5: Main priorities of households for electrical appliances ... 24
Figure 6: Annual cooking energy and agricultural waste consumption per household with landholding size ... 25
Figure 7: Amount of money households willing to pay for lighting and cooking (taka/month) with average percentage of income it accounts for in each income group ... 27
Figure 8: Percentage of households familiar to biogas with education level of respondents ... 28
Figure 9: percentage of households willing to contribute in the project, with education level ... 29
Figure 10: Share of cooking and lighting energy in total energy consumption ... 30
Figure 11: Household energy demand by fuel (kWh/yr) ... 31
Figure 12: Share of biomass in cooking energy consumption ... 32
Figure 13: Share of different resources in lighting energy demand ... 33
Figure 14: Variation of cooking and lighting energy demand with income groups ... 34
Figure 15: Variation in the consumption of cooking and lighting energy fuels (kWh/yr) with income groups ... 35
List of Tables
: Table 1: General information of households in the village ... 17Table 2: Education level of the respondents ... 18
Table 3: Income groups and average income of the groups ... 19
Table 4: Primary and secondary income sources of the households ... 19
Table 5: Priority of households in the use of cooking stoves ... 24
Table 6: Categories of households with respect to ownership of land ... 25
Table 7: Animal resources in the village and percentage of owners ... 26
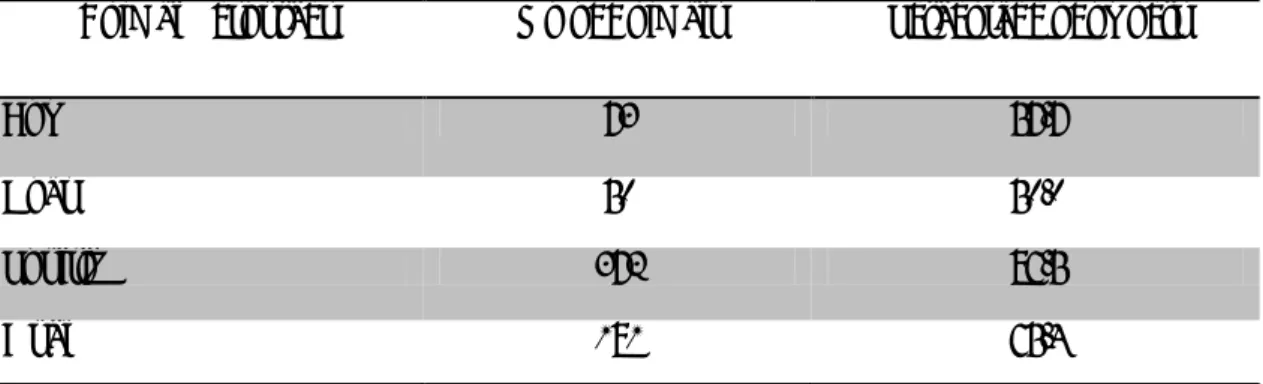
Table 8: Existing final and useful cooking energy demand of the village ... 36
Table 9: Calculation of total biogas demand of the village ... 37
Table 10: Cow dung potential in the village ... 38
Table 11: Agriculture residue potential calculation ... 39
-8-
Executive Summary
In the world today the rural areas of developing nations face the problems of poverty, lack of access to the modern and efficient fuels and serious health issues. Due to lack of access to electricity and efficient fuels for cooking people have to rely on the biomass and traditional cooking techniques which are not only inefficient but also poses serious threats to the health of women and children. Dearth of access to modern fuels results in poor life standard and deteriorating health effects in the rural regions of the developing world. Properly addressing energy issues could make rural population more productive and would make them able to play a vital role in the prosperity of the country.
Bangladesh is one of the poorest countries of the world which is facing the similar problems. It has huge population of 142 million with a high population density. Bangladesh has around 80 percent of the population living in villages and the rest 20 percent in urban areas (Asaduzzaman et al, 2010). The country’s rural population also faces the problem of income poverty as well as energy poverty. Around 45 percent of the rural population is income poor and 58 percent is energy poor which is the demand based measurement of energy poverty (Barnes et al, 2010). In rural areas of Bangladesh people mostly rely on biomass to meet their cooking energy need. The main biomass resources include fuel wood, agricultural waste, tree leaves and branches and cow dung (Jashimuddin et al, 2006). Due to the inefficiency of cooking stoves utilized in rural areas the useful energy for cooking is low. The common appliances used for lighting in majority of the rural areas in the country are kerosene lamps (hurricane and kupi) (Asaduzzaman et al, 2010). Another alarming issue in the rural Bangladesh is arsenic contamination in drinking water. Around 92 percent of the rural districts in Bangladesh are affected by the arsenic contamination in water (Biswas, 2010).
The study serves as a part of biogas based poly generation project utilizing cow dung or agricultural waste to produce biogas that would provide the services of cooking gas, electricity and clean drinking water in rural Bangladesh. The main goals of the study are to investigate cooking and lighting energy demands of a village in Bangladesh. Household energy utilization patterns, socio economic situation of the people in the village and attributes as well as preferences for current energy utilization patterns are studied. The study also focuses on examining the willingness of the rural households to pay for the services of cooking gas and lighting and towards the contribution for the poly generation project. Another key question that the study sheds light on is to find out the biomass potential in the village i.e. cow dung and agricultural waste to calculate the amount of biogas that could be produced from the available resources in the village. The study is carried out by conducting a household survey in a village named “Pani Para” in Faridpur district of Bangladesh. Household survey is done using a questionnaire containing all the queries addressing to the goals of the study. Survey is conducted by personally visiting the households in the village and asking questions to retrieve the required information. The survey covered 52 households in the village containing 261 inhabitants. Gathered information from the village was then formulated to get the required results using Microsoft excel followed by the analysis of the results.
It is found in the study that majority of the households in the village are associated with agriculture. Around 35 percent of the households have agriculture as their main source of income. Working as a daily labor is the second major source of income in the village which covers 25 percent of the households. Most of the low income households are working as labor and high income households are associated with agriculture. All the people who are daily labor work in the agricultural fields, so majority of the households are directly or indirectly associated with agriculture. Analyzing the income expenditure with income groups reveals that food is the main priority of households for income expenditure among low medium and high income groups. It is noted that spending on energy is not one of their main priorities because of the availability of fuel at very little or no cost. Similar trend of low priority is observed for education which is also evident from the poor educational status of the village as more than 50 percent of the respondents revealed to have no schooling of any kind.
-9-
The surveyed village is quite poor with no provision of electricity and lack of access to modern fuels for cooking as well. Only fuels at their disposal are traditional biomass for cooking and mainly kerosene for lighting. The perception to get hold of the fuel easily in the village increases with increase in the income level in the village. The reason for such an increasing trend is because in the high income group the people own cattle as well as they have more land and the higher income group households are mostly associated with agriculture. So for the households with the higher income group, it is comparatively easier to have access to the fuel rather than the medium and higher income group. Around 94 percent of the households use traditional mud stoves, 2 percent use improved cooking stoves and 4 percent use biogas stoves. Survey shows that around 92 percent of the households are willing to change their current ways of cooking. Majority of the households are willing to change their current ways of cooking due to smoke, collection time and safety with high level of smoke being the most important reason. Among the priorities for the electrical appliances, light bulb is by far the main priority for electrical appliance because of the current use of kerosene lamps with poor quality of light which also have serious health impacts due to inhale of black carbon.
Cooking and lighting energy demand shows an increasing trend among the different income groups. Average household cooking and lighting energy demand among the households in the surveyed village is 39967 MJ/yr. Average energy demand among low, medium and high income groups is 30571 MJ/yr, 35240 MJ/yr and 53302 MJ/yr respectively. As cooking and lighting energy increase with income but there is not much variation in the fuel mix and almost everyone in the village rely on biomass to meet their energy demand. It is because there is very limited access to the modern fuel for cooking and no electricity access in the village, so the households have to rely on the traditional fuels. Cooking energy demand and agricultural waste consumption also show an increasing trend with the increase in land holding size. The amount of money households willing to pay is increasing with increase in income level which means that the households with high monthly income are willing to spend more than the households with low income. Study shows that majority of the respondents are willing to contribute for the poly generation plant but there is an increasing trend of this willingness with the increase in education level. Awareness about the biogas technology is also greater in the educated group than the non educated group of respondents.
The total Biogas demand of the village is calculated to be 56981.53 (m3/yr) but the total biogas potential from co generation of cow dung and agricultural waste is 55443 m3/yr. There is deficit in the production of biogas due to the lack of resources in the village. The biogas production from the available resources can be utilized to provide electricity and clean water to all the villagers with cooking gas to only 2/3rd of
households. As the clean drinking water and electricity will be supplied to all the households so the low income 1/3rd of the households should be provided with improved cooking stoves to meet their cooking
demand as biogas is not enough to provide them with cooking gas.
It is concluded that there is higher energy demand with increasing income level as well as landholding size. At present there is lack of availability of reliable access to modern fuels and thus villagers have inefficient utilization pattern mainly dominated by traditional fuels. However the households are willing to change their current cooking and lighting energy utilization patterns as well as they are willing to pay for such a change depending upon their income. The response of the villagers for contributing to the biogas based poly generation plant is quite positive. Despite the lack of feedstock in the surveyed village, the available resources can still be used to provide majority of the households with all the services generated by poly generation project.
-10-
1 Introduction
1.1 Background
Access to efficient and modern energy is extremely crucial for the developing nations to counter the economic and health issues and at the same time with the productive use of energy increase the economic growth and life standard of the deprived people. A well performing energy system can provide these people with income generating opportunities as well as to escape them from the awful impacts of poverty. Unfortunately this has not been made possible due to financial issues, lack of resources, effective energy policies and energy systems in the developing nations.
Dependency of the people on traditional biomass for catering their cooking and lighting energy demands in the developing nations still prevails especially in rural areas. Poverty, lack of availability of modern energy and lack of education are the main causes of this phenomenon. Abundant use of biomass for meeting the demands also brings the scarcity of these resources like fuel wood. Another detriment side of utilizing biomass in inefficient way is higher consumption of energy than usually required with disastrous health effects due to smoke. Access to modern and clean energy like electricity and efficient cooking technologies to the rural areas in developing world not only provide improved and healthy life style but would also help in reducing harmful environmental effects. Efforts on the all levels are required to counter this situation with effective projects and policies on government level as well as awareness of the uneducated masses in the rural developing world.
1.2 Objectives
In developing countries like Bangladesh where a promising number of rural people do not have access to electricity and fuel to meet their cooking energy demand, main dependency is on biomass. So the energy access to rural population is of paramount importance as the inefficient use of biomass for cooking is imposing serious health issues. Apart from the health effects from biomass burning for cooking, another main health problem arises from arsenic contaminated water for drinking.
Considering the facts the main objectives of the study are to analyze the cooking and lighting energy demand of the rural households in a village in Bangladesh. Further it provides a clear picture of the type of fuels utilized in the village for meeting their cooking and lighting needs. Data gathered for the purpose of the study and the results of the study itself are going to be used for the biogas poly generation project in rural Bangladesh being carried out at KTH. It is also intended to figure out the socio economic situation of the villagers and their preferences to change their current cooking fuel utilization patterns as well as their preferences for the technology. It was also meant to shed light on the biogas potential in the village as well as the to see the extent to which this biogas potential can be utilized to provide the services (cooking gas , electricity and clean water) to the households through the poly generation project.
1.3 Methodology
The thesis work has been carried out in following four phases: • Literature Review
• Questionnaire Design
• Field Survey and Data gathering • Data Analysis and interpretation
-11-
The literature review part is done by gathering the information of the energy situation of Bangladesh and other developing countries as well as the information regarding the biogas plants and drinking water situation in Bangladesh. Literature review has been done in perspective to the questions of research in place for the project requirements to understand the previous work done in this field and to understand the energy situation of the country.
Questionnaire was designed focusing on the data required for the project from the field keeping in mind the social and traditional values of the country followed by translation of questionnaire in the local language i.e. Bengali. The questionnaire is also sent to the local partners for their input and also pre-tested in some houses in a nearby village in Dhaka before going to the actual field.
Data required for the thesis work in line to the objectives of the study and poly generation project has been gathered during the field survey using the designed questionnaire with the help of a fellow master thesis student and local partner NGO Grameen Shakti.
After the data collection the data has been converted into excel sheets to get the required results. The results have been generated using excel followed by the analysis of the results.
-12-
2 Theoretical Framework
2.1 Introduction
In the developing nations the access to the modern energy and fuel for cooking as well as lighting is indispensible and it is a key for improving life standard of the people. Many people have studied the factors affecting energy access as well as the patterns of energy use in the developing countries. There are many attributes that influence the consumption pattern of the households and have an effect on their preferences to change to modern and clean technologies. (Pachauri, 2004) studied the variation in the total household energy requirement with different attributes like socio economic condition, geographical location and family size. Household income level has been indicated as most important factor in the variation of energy requirement and according to the study the energy requirement in the rural households increase with the increase in income level. Similar increase in rural household final energy consumption with increasing income is observed by (Mainali et al, 2012) for the case of China with major dependency on biomass and coal. The study by (Tuan & Lefevre, 1996) for Vietnam also indicate income to be a prominent factor for deciding the quantity and patterns of energy use and found and increase in the use of electricity and decrease in residue use with increase in income.
Patterns of domestic energy use in rural and semi urban areas of Bangladesh are analyzed by (Miah et al, 2011). It is investigated that 100 percent of the households in the studied rural areas use different types of biomass. It is also revealed that the electricity consumption in the rural areas increased with the increase in income level and the consumption of biomass decreases. The study also indicates that households with better literacy rate show a positive response for choosing efficient energy carriers. The use of firewood among the biomass resources is most preferred by the households in the developing world. Similar results have been discussed about the preference of biomass consumption by (Jashimuddin et al, 2006). (Miah et al, 2011) also stated that the dependency of households on leaves and twigs is increasing due to firewood crises.
Lack of access to the modern fuel for cooking and electricity has been an important factor of the dependency of people on traditional resources. The use of modern fuels and LPG have been increased in the South Asian countries more rapidly as compared to the rural areas of Bangladesh, where the dependency still prevails on fuel wood, dung crop residue and tree leaves. This consumption pattern is stated by (Asaduzzaman et al, 2010). (Mainali et al, 2012) investigates that among the key attributes like age, gender, income, education etc that determine the fuel choice in the household, fuel price and cost of technology also play a deciding role for the people to adopt new and modern technologies. The study regarding household energy demand in rural and urban areas of Vietnam studied by (Tuan & Lefevre, 1996) reveals that the preference of the consumers to adopt modern fuels depend on their convenience and availability of the fuels. It is also stated that the income is also an important factor among households for the substitution to modern and clean energy.
(Tonooka et al, 2006) studied the number of stoves owned by the households and stove types in rural households in the fringes of Xian city. It also investigated the purpose of use of the different type of stoves e.g. cooking and space heating as well as ownership of the electrical appliances in rural area. The study also shed light on the association of the households with different occupations and the variance of income level with respect to area.
-13-
2.2 Rural energy and services background
2.2.1 Energy access in developing countries
In developing countries, energy plays an important role in the contribution to the social and economic improvements as well as in sustainable development. In the world today around 1.4 billion people do not have access to electricity and 85 percent of them live in the rural areas. Around 2.7 billion people use traditional biomass for cooking. Most of these deprived people are inhabitants of Sub-Saharan Africa, India and other Asian countries (Kaygusuz, 2011).
Electricity access and dependency of the population on traditional biomass in big developing countries in Asia is studied by (Rehman et al, 2012) . According to the study, 95 percent of the world’s energy poor are in Asia ad Sub-Saharan Africa. Out of the total electricity deprived population in Asia, almost 80 percent live in the 5 big developing countries India, China, Bangladesh, Indonesia and Pakistan. Furthermore, 86 percent of the biomass dependent population of Asia lives in these five countries.
Lack of energy access impedes the social and economic development. Sufficient access to clean and modern energy provides the opportunities for improving life standard, contributions in income level by increasing business opportunities and reducing environment impacts. On the other hand deprivation to energy access imposes serious social, economical and health effects. Due to the blunt use of traditional biomass for cooking in the developing countries almost 1.3 million women and children die prematurely every year due to exposure to indoor air pollution. (Kaygusuz, 2011)
Energy access in rural areas of developing countries incorporating renewable energy resources and utilizing indigenous resources is potential option which has been explored and implemented in many countries. Many people have also studied numerous renewable energy options for particular regions. In the study regarding renewable energy for rural electrification, (Gurung et al, 2011) have analyzed micro hydro power plants as a potential option for Nepal and further studied the benefits gained by the area after the implementation of environment friendly technology. (Mainali & Silveira, 2010) studied financial aspects of off grid rural electrification technologies i.e. micro hydro and solar home systems in Nepal. The paper investigates subsidies, equity and credit system for these renewable technologies in Nepal. Impacts and effectiveness of the subsidies provided for dissemination of these technologies are analyzed in the study.
There is immense resource potential in various developing countries that could be exploited but there are certain barriers in every region which impedes the process. (Ahlborg & Hammar, 2012) discussed the drivers and barriers for rural electrification for the case of Tanzania and Mozambique. According to the study drivers in such efforts are local initiatives by industries and political ambitions based of increased demands. On the other hand there are barriers like difficulties in planning, donor dependencies for such projects, lack of interest by private sector as well as technical issues.
2.3 Energy situation in Bangladesh
Bangladesh is one of the poorest countries of the world. It has huge population of 142 million with a high population density (Asian Development Bank, 2011). The gross national income per capita in Bangladesh is 770 dollars which is among the low income countries (The World Bank, 2011). Total primary energy supply of the country is 0.18 toe per capita (International Energy agency, 2009). In the report of World Bank, (Asaduzzaman et al, 2010) it is stated that Bangladesh has around 80 percent of the population living in villages and the rest 20 percent in urban areas. The country’s rural population also faces the problem of income poverty as well as energy poverty. Around 45 percent of the rural population is
-14-
income poor and 58 percent is energy poor which is the demand based measurement of energy poverty. (Barnes et al, 2010)
2.3.1 Traditional biomass for cooking
According to (Jashimuddin et al, 2006) people mostly rely on biomass to meet their cooking energy need in rural areas of Bangladesh. The main biomass resources include fuel wood, agricultural waste, tree leaves and branches and cow dung. Agricultural residue consists of rice husk and straw, bagasse, jute sticks etc. Biomass constitutes the major portion of the cooking energy. Fuel wood comprises of 44 percent and agricultural residue 39 percent of the total biomass cooking energy used. Due to the inefficiency of the cooking stoves utilized in the rural areas the useful energy for cooking is low. Per capita energy consumption in the rural households in Bangladesh is 8.9 GJ, which has considerably grown over the past few years. (Asaduzzaman et al, 2010)
2.3.2 Lighting in rural Bangladesh
Nearly 2/3 of the rural villages are not electrified so kerosene is the main fuel used for lighting. However the people in electrified villages use electricity for meeting their lighting needs as well as for small business and other activities. In electrified villages main appliances are incandescent bulbs and fluorescent tubes. The common household appliances for lighting in non electrified rural Bangladesh are kerosene lamps (hurricane and kupi). Kerosene lamps utilized for lighting energy are less efficient and have a poor light quality. (Asaduzzaman et al, 2010)
2.3.3 Clean drinking water
Clean drinking water is another very important basic need for human existence which is not very common in rural Bangladesh. One of the main problems in rural Bangladesh regarding clean drinking water is the arsenic contamination. Rural inhabitants are the main victims of the arsenic contaminated water as 92 percent of the rural districts of Bangladesh have arsenic contaminants in water (Biswas, 2010). In the study further analyzed the use of renewable resources like biogas, solar and human energy for pumping clean drinking water from deep tube wells through submersible and reciprocating pumps. It is further proposed that electricity from biogas plants has a potential to be used for pumping clean water from submersible pumps.
2.3.4 Biogas situation
Beside other renewable energy technologies biogas is also an encouraging option in rural Bangladesh. Grameen Shakti, LGED, RSF and other organizations are installing domestic biogas and commercial plants with the help of IDCOL, SNV, KFW and GIZ. International NGO’s are mostly involved in providing funding and technical support and the local organization like Grameen Shakti and LGED are working on dissemination of the technology in rural Bangladesh. BCSIR, Grameen Shakti and LGED and have already installed 22000, 8000 and 2500 biogas plants respectively, throughout the country. (Mainali, 2012). Most of the biogas plants installed by these organizations are domestic and community based biogas plants are very few and far between. (Islam et al, 2006) studied that moderate and large size poultry based biogas plants are more economically viable and there is a huge potential for community based biogas plants in Bangladesh. Domestic and community based biogas plants could play a very important role in providing healthier and environment friendly cooking options in the rural areas of Bangladesh.
-15-
3 Data collection tools
3.1 Questionnaire
In the first phase of the thesis work the most important task was to formulate a comprehensive questionnaire which contains all the important questions addressing to the purpose of study. The intent was to make the questions as simple and straight forward as possible to make it easier for the people to answer. While designing the questionnaire it was kept in mind that people might have limited understanding and low educational background. The questionnaire contains a mix of different types of questions e.g. it contains direct question to know specific figures like monthly income, amount of fuel wood utilized per month, knowledge about the biogas technology. It also comprises of questions which could give the preferences and ranking about the information required e.g. ranking of the main income sources, priority of the income expenditure, ranking of the reasons to change the current fuel types etc. Depending on the required data for the purpose of study, different type of information was needed. So the flow of the questions was set in a way that all the related questions regarding the one specific parameter are together. As the information was required regarding the household occupation, monthly income and priority of income expenditure, so all these related questions were kept in order. However at a few places the order has also been modified to make it convenient for the respondent.
The questionnaire evolved during the pre survey period of the study and passed through number of filtration steps. The questions added in the questionnaire were examined and modified number of times to match the requirement of the project, social and traditional values of the area as well as expected understanding of the respondents. First the questionnaire was prepared in English and then with the help of another fellow master’s thesis student Ms Nasrin Akter (Bangladeshi native) it was converted to the local language i.e. Bengali.
3.2 Household Survey
The data collection part of the study has been done through a household survey done in a village in Bangladesh.
As the poly generation project is in the research phase and to find out the feasibility of the project in the rural areas of Bangladesh is of prime importance at this stage. Main outcomes of the poly generation technology are cooking gas, electricity and arsenic free drinking water for the villagers, so a village selection criterion for survey was considered. The main selection criteria were that the village should not have the grid electricity and it must have been affected with arsenic contaminated water so the exact situation of the area and the inhabitants could be known. A village named Pani para in the Faridpur district of Bangladesh was selected for the survey with the help of Grameen Shakti (A local NGO in Bangladesh)
The main goal was to survey all levels of households in the village from very low income household to the rich households to have a comprehensive picture of the income level of households and their consumption patterns. The sample size surveyed in the village is 52 households, in July 2012 which covers most of the existing households of the village.
Grameen Shakti (NGO of Bangladesh) is the local partner of KTH in biogas poly generation project. Grameen Shakti has a huge network throughout Bangladesh up to the Uppazilla level and they have conducted number of renewable energy projects in Bangladesh for rural development. Solar home systems, improved cooking stoves and domestic biogas plants are main renewable energy areas where Grameen Shakti has implemented projects in the rural areas of the country. Due to their grass root level network in the rural areas, they had most of the required information regarding the villages which are arsenic contaminated and have not been electrified yet. With their guidance and help the above mentioned
-16-
village was selected for the survey purpose. The branch office of Grameen Shakti was located in Alfadanga the Uppuzilla located in the Faridpur district which is 6 - 7 kilometers from the Pani Para village.
The survey was carried out by asking the questions to the respondents from each house from the prepared questionnaire. The questions were asked in the local language by our fellow student and survey partner who happened to be Bengali herself who was helped and supported at every step by myself. The people of the branch office of Grameen Shakti were briefed before our arrival in the village. They informed the villagers about our arrival and the purpose of our work. This helped us a lot in the process and saved a lot of time, as number of villagers would assemble at one place every day for the interview.
-17- 4 Sample characteristics
4.1 General Information of Village
The surveyed village named “Pani para” is situated in Alfa danga uppuzilla in Faridpur district of Bangladesh. It is a small village 6-7 kilometers from the Alfa danga uppuzilla. Alfa danga is the only main town close to the village. A small single lane brick road connects the village to Alfa danga. Main means of transport are the cycle van or the auto rikshaw. The village “Pani para” is not electrified yet, but the Alfa danga has the access to electricity with load shedding of 2 to 4 hours every day.
The houses in the village are in the form of clusters with 5 to 10 houses per cluster. Total households surveyed in the village are 52. The total number of the inhabitants in the households surveyed is 261 with average family size of 5 persons per household. Surprisingly during the survey the number of male respondents was found to be equal to the number of female respondents, which is quite unlikely in a country like Bangladesh, which is a male dominated society and women are reluctant to talk to the outsiders. One possible reason for this could be the presence of female colleague in our survey team who is originally from Bangladesh. This made quite easy for us to interact even with the females and capture the female respondent’s perception in the survey. Secondly the presence of local personnel of the organization Grameen Shakti throughout the survey period also made the survey effective. All the villagers were already acquainted with them, so it assisted in reducing the communication gap. It is also a positive aspect for the survey because women are the one who are responsible for the cooking, so being the end user they have a better idea about the amount of cooking fuel is consumed. The overall detail of the households in the village is given in the table below:
Table 1: General information of households in the village
Description Values
No of Households 52
Average family size 5 persons/household
Percentage of male respondents 50% Percentage of female respondents 50%
4.2 Educational status
Table 2 shows the educational status of the respondents interviewed during the survey. More than 50 percent of the respondents are not educated in the village which shows the poor literacy condition in the village. The educational condition of the people is important to know as educational people tend to be more open to adopting the new technologies provided the monetary condition is good enough.
-18- Table 2: Education level of the respondents
Education Level No of respondents Percentage
Illiterate 27 51.9
Primary (1-5) 9 17.3
High School (6-10) 15 28.8
College/University 1 1.9
Total 52 100.0
In our survey the number of illiterate respondents is more than the national statistics value. As per Ministry and Planning of Bangladesh the literacy rate is 57.53 percent and in this village it is 48 percent of the total respondents (Statistics, 2010). Even from the educational statistics of Asian Development Bank from the data of 2009, it is found that the adult literacy rate is 55.9 percent (ADB, 2012) which is again on the higher side from our survey statistics. According to (Asaduzzaman et al, 2010) the percentage of people without schooling is 54.6 percent for the Dhaka region which is more comparable to our figures as our village is also in the Dhaka region. However by the above comparison it is evident that the overall educational situation of the villagers is quite poor.
4.3 Household income and income groups
Most of the households in the village have very low monthly income which indicates the poor economic situation of the village. From all the households surveyed in the village the range of monthly income per household is found from minimum 2500 taka/month to maximum 65000 taka/month. Around 86 percent of the households have less per capita income than the national GNI per capita one given by World Bank for the year 2011 which is 770 USD (Bank, 2012) with conversion rate (1 USD = 81.12 BDT). It shows that the majority of the households in this village have low monthly income as per national statistics.
However a few households have better economic situation than the others but the number of those households is quite nominal as compared to the whole sample. So, for the purpose of analysis of different parameters and have a better picture of the variation of those parameters with income level, the whole sample is divided into three income groups named as low, medium and high income groups.
The low and medium income group comprises of 17 households each and the high income group consists of 18 households. This distribution is done to accommodate all the households in the sample. The detail of the income groups and the average monthly income of the households in particular group is shown in table 3:
-19-
Table 3: Income groups and average income of the groups
4.4 Income source
Bangladesh is an agricultural country with rice and jute being their main crops. During the survey, villagers were asked to identify their sources of income if they have more than one then rank them in the order of their importance. It can be seen in the table 4 that more than 50 percent of the household in the village have more than one source of income. Even the households who have earnings from a secondary income source, majority of them are associated with agriculture. That shows the importance of the agriculture as a major occupation in the village. Around 37 percent of the households have agriculture as their primary income source and around 23 percent of the households have agriculture as their secondary income source. The second main income source of the villagers is to working as labors. The percentage of households whose main income source is daily labor job is 25 percent of the whole sample. But the interesting thing to understand here is that the people who are labor are also indirectly associated with the agriculture. Because the entire daily labors in the village work in the agricultural fields of other people. Due to the lack of ponds and lakes in the village fishery is not very common occupation in the village, which however is one of the most important industries in the country. Table 4 shows the percentage of households in the surveyed sample with different occupations:
Table 4: Primary and secondary income sources of the households
Income Source Primary income source
(percentage of households) Secondary income source (percentage of households)
Agriculture 34.6 23.1
Fishery 0.0 5.8
Private Employee 9.6 7.7
Government Employee 1.9 0.0
Business/Self Employed 23.1 11.5
Remittance from abroad 5.8 1.9
Labor 25.0 1.9
Total 100.0 51.9
Income groups No. of households per income
group Average income (taka/month)
Low 17 4760
Medium 17 9000
-20- 0 10 20 30 40 50 60 70 80 90 100
Low Medium High
Pe rce nt ag e of Hoou se hol ds Income Groups Labour
Remittence from abroad Business/Self Employed Government Employee Private Employee Agriculture
Figure 1 describes the association of the percentage of households associated with different occupations in three income groups. The figure represents the primary and the most important income source of the households. It can be seen that in the low income group most of the people are labors and work in the agricultural fields. These people are poorly paid and approximately paid around 100 taka per day, which is quite a low remuneration. Percentage of people associated with agriculture increases with the increase in income level. About 50 percent of the households in the high income group have agriculture as their main income source. This is also due to the fact that the people in the high income group have more land so they could grow on their fields and could also hire people as labors to work in their fields.
4.5 Ranking Of Expenditure
There are economical, political and social issues involve in the failure of widespread dissemination of clean fuels (Goldemberg et al, 2004). Social attributes and behavioral pattern can affect the acceptance of the new technology. In order to understand the prevailing patterns of income expenditure and priorities of households for other attributes, villagers were asked in interviews to prioritize and rank their opinion regarding certain information. It will help in understanding the priority of the villagers for their income expenditure, their inclination towards a certain appliance depending upon their need etc.
To know the expenditure patterns of the households, respondents were asked to give the priority of their income expenditures. This helps us to find out the main areas where the villagers spend their income and by the priorities would indicate the things they render most important to spend their income on.
-21- 0 10 20 30 40 50 60 70 80 90 100 Lo w M edi um High Low M edi um High Low M edi um High
Priority 1 Priority 2 Priority 3
Pe rce nt ag e of hou se hol ds Business/Agriculture Energy Health Clothes Education Food
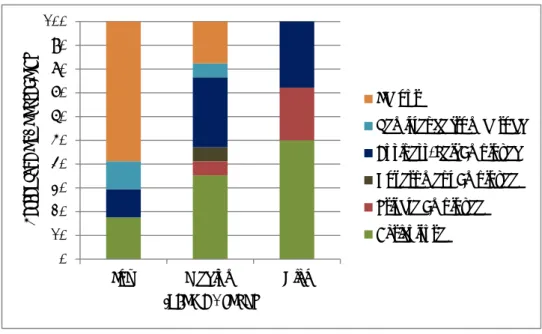
Figure 2 indicates the priority of income expenditures of the households in low, medium and high income groups. We can see that for majority of the households in all the three income groups, food leads the first priority for income expenditure. This is quite understandable because it is a poor village and most of the people are mainly concerned to feed their families. It is also a common practice in most of the developing countries because of poverty, and in some cases due to scarcity of food. For the people of the village, to furnish food for their families is always their main priority. Among the first priority in expenditure we can also see that around 10 percent of the households also spend on their business which is in most of the cases is agriculture. Due to the health problem some of the villagers also have to spend on the health issues.
As the education level in the village is not very high and spending on education is also not among their first priority, still a few households spend on the education of their children as their second and third priority but it does not make a substantial contribution. Another important thing to note here is that spending on energy is not the main priority of majority of the households. From the survey data and upon asking the villagers it is discovered that majority of the households either get the fuel for the cooking from their own resources like cattle and agricultural field or just collect it to fulfill their demand. Very few of the households in the village actually buy biomass. That is one of the main reasons that spending on the energy needs is not one of their major priorities. However for the lighting fuel everyone has to buy kerosene from the market and households who have solar PV installed do have to pay the installments. But still majority of the households consider food, health, clothes and education more important to spend their money on than energy.
4.6 Access to fuel
After asking the villagers, it was discovered that the inhabitants either have their own resources to get the cooking fuel or they collect it from others and small amount of households also buy a part of their cooking and lighting fuel from the market. To know the perspective of the villagers towards the convenience in getting the fuel, the respondents were asked to tell their stance regarding this issue.
-22- 0.0 20.0 40.0 60.0 80.0 100.0
Low Medium High
Pe rce nt ag e of hou se hol ds Income Groups
Access to fuel
Sometimes difficult Difficult EasyFigure 3 illustrates the opinion of villagers of all the households in the three income groups regarding their access to fuel in the village. The options provided to capture the degree of accessibility were (i) easy, (ii) difficult and (iii) sometimes difficult. As we can see in the figure 3 that more than 50 percent of the households in the low income group find it difficult or sometime difficult to get hold of the fuel in the village.
However the perception to get hold of the fuel easily in the village increases with increase in the income level in the village. The reason for such an increasing trend is because in the high income group the people own cattle as well as they have more land and in figure 1 we see that higher income group is mostly associated with agriculture. So for the households with the higher income group, it is comparatively easier to have access to the fuel rather than the medium and higher income group. It also has to deal with the collection of the biomass from the fields or the neighbors, because for the households with less number of old member and small kids, it is difficult to go and collect the biomass. But in the high income group, the issue of collection is not that big as they usually have to collect from their own fields and they mostly have cattle of their own.
It is found out from the survey that all the household use biomass for the cooking so it also shows that the access to modern fuel is very limited in the village. People from all income groups have to rely on biomass for cooking, so access to modern fuel is a problem in the village. . But among the available resources still the people with higher income have better access to fuel and enjoy more options than the people with lower income. Another study regarding Bangladesh by (Miah et al, 2011) also revealed that 100 percent of the households in the studied rural areas use various types of biomass.
4.7 Willingness to change
In order to understand the social behavior of villagers regarding the change in their current cooking patterns and ways of cooking in case a new technology is introduced which in our case is biogas poly generation technology. To prevent a biased answer, we tried to ask the question in an indifferent way, relating it to the problem villagers usually face with conventional cooking fuels and stoves.
From the figures obtained during the survey, around 92 percent of the households are willing to change their current ways of cooking. It also includes the percentage of the households in each income groups
-23- 2% 54% 20% 24% Cost of fuel Smoke level Safety
Huge collection time
who already have changed their current pattern by adopting biogas plants. We can see that majority of the households are willing to change their current ways of cooking due to smoke, collection time, safety etc. But there are also some households who are not willing to change. The reason of such a behavior depends on a couple of different reasons. Among the poor households people do not have enough to pay for improved cooking stoves or the lack of monetary and cattle resources for installing the biogas plant. Upon asking some households who are not willing to change have revealed that they do not feel any problem with the current ways of cooking being used so they do not see any reason to change. This could be because of the reason that they are unaware of the health problems caused by the exposure to smoke. Regarding the willingness of the households willing to change the current cooking patterns, respondent were also asked to point out the prime reason for them to embrace the change in current cooking fuels and the type of stoves they are using.
Figure 4 indicates percentage of the households with the main reasons to change the current cooking. This figure contains the percentage of the households who are willing to change and have not changed to biogas as their cooking fuel. The main reason that is obvious from the above graph for the households using the traditional ways of cooking is smoke level. Other main issues that are ranked first by the respondents for the major reason to change are the huge collection time, safety and cost of the fuel. It also shows that the households are aware and are facing the problems from direct burning of the biomass in the traditional stoves. It also demonstrates the concern of respondents about the safety issues that arise by the use of traditional stoves in their homes.
4.8 Cooking stoves
In this survey the type of cooking stoves used by the households was also investigated. Respondents were asked to tell the number of stoves they have in their houses and their priority in use for the particular type of stoves own by each household. It was discovered by the survey that there are few households that own more than one type of stoves. So the respondents were asked to identify their priority of stove use for cooking purpose.
Figure 4: Main reasons to change the current cooking pattern in the village
-24- 0 20 40 60 80 100 Priority 1 Priority 2 Percentage of households Light Bulb Tv Fan Refrigerator Water pump Irrigation Pump
Regarding the priority of stoves utilization among the households, it is seen that 94 percent of the households use traditional mud cooking stoves as their first priority. All these households do not have other options other than to use traditional mud stoves. The reason is that most of the households have monetary constraints to pay for the improved cooking stoves even when some of them want to buy the improved cooking stoves. Four percent of the households use biogas stoves and 2 percent use improved cooking stoves as their first priority. The detail of the households using the particular cooking stoves and their priority are summarized in table 5:
Table 5: Priority of households in the use of cooking stoves
Type of Stoves 1st priority for Households (Percentage) Traditional Mud 94
Improved 2
Biogas 4
4.9 Priority for electrical appliances
The nearest town Alfadanga has facility of electricity and the surveyed village which is not very far from the town still does not have been electrified yet. All the villagers were quite interested and enthusiastic in getting the electricity in their homes. It was found that most of the households prefer to have lighting in their homes. Currently kerosene is the major fuel used by the villagers and the villagers are not satisfied by the resource as the quality of light by the kerosene is very poor. It was asked the villagers to identify their priorities regarding the appliances they would like to have, in case the electricity would be provided in their village by the government or by any other project. The questions were asked without bias because of the reason that, the poly generation project is in the feasibility stage and we did not want to give any false hope to the villagers.
-25- 0 2000 4000 6000 8000 10000 12000 14000 16000 Land Less 0.04 - 0.6 0.7 - 6.5 Co okin g e ne rgy (kW h/ yr )
Landholdings of households (ha)
Cooking Ag Waste
Figure 5 shows the priorities of the households for electrical appliances. More than 80 percent of the households want to have electric lights in their homes as their first priority. Kerosene lamps are widely used in the village and few of the villagers also have solar PV for lighting. But upon asking the villagers, majority of the people expressed light bulb as the main electrical appliance they would like to have. Second priority of most of the villagers is to have an electrical fan, because of the hot and humid climate in Bangladesh. Television, water pump and irrigation pump are the other priorities of minority of households.
4.10
Land assets
As a part of the survey villagers were also asked to indicate about the land assets they own. As the overall income level of the households is low, we see a similar trend in the land ownership as well. Major households in the village either own very less or no land. Around 46 percent of the households in the village are land less. That is also the main reason that a lot of villagers work as labor because they do not have their own land to cultivate. But there are few households who take land on lease from other people to work and cultivate crops. For a clear understanding three groups are made depending upon the amount of land ownership. The detail of the groups and number of households falling in these groups are shown in table 6.
Table 6: Categories of households with respect to ownership of land
Land Quantity (ha) No. Of Households Percentage
Land Less 24 46
0.04 - 0.6 16 31
0.7 - 6.5 12 23
Total 52 100
In order to see the variations in cooking energy consumptions and agricultural waste consumption with the land holding size, the average values of cooking energy consumption as well as agricultural waste are plotted to see the trend of variation with respect to ownership of land.
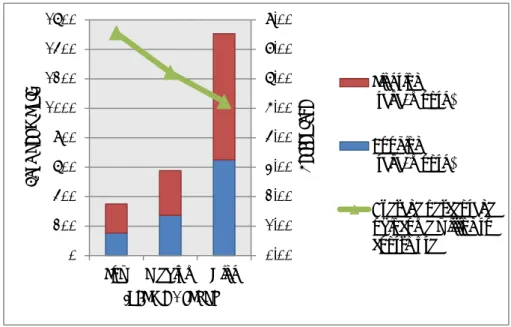
Figure 6: Annual cooking energy and agricultural waste consumption per household with landholding size
-26-
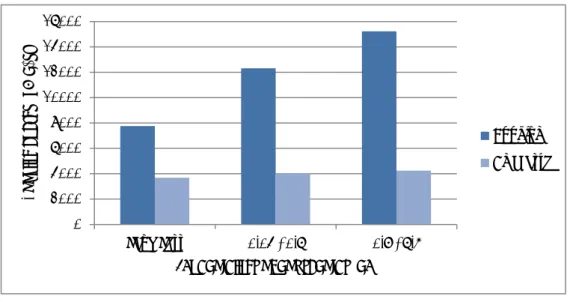
Figure 6 illustrates the variation in the cooking energy demand across the households in three different landholding groups. It shows that the cooking energy demand increases with the increase in the landholding size. The households with no land use the lowest cooking energy annually in comparison to the other two groups that own land. The figure shows a positive trend of the increase in the cooking energy consumption with increase in land assets. The reason of this trend is that the households who own large land have greater resources to earn more than people with less land ownership. Either these households use their land for cultivation or give their land on lease to other people for similar purpose, which allows them to earn more even when they are not directly linked with agriculture.
But another interesting thing to note is that the consumption of agricultural waste is increasing with increase in land size but the increase is not very huge. One can think that there should be a greater increase in consumption of agricultural waste with the increase in landholding size as they would have greater amount of waste at their disposal than the landless households. But possible reason for such a trend could be that households with greater land have greater earning and can afford other fuels as well. They could buy other fuels like wood or buy cattle at their home rather than spending more time in collecting agricultural waste from fields. That is why the variation in cooking energy among the groups is greater than that of agricultural waste consumption.
4.11
Animal resources
Amount of cattle owned by the households in the village is very important from the perspective of the poly generation project. As the poly generation plant will use the cow dung to produce the biogas for the cooking purpose, electricity generation and clean water production. That is why it was imperative to know the cattle resource in the village for the calculation of the dung.
In this regard again the village has proven to be quite poor and has lack of resource not only in cattle but as well as in poultry. Another important thing to note here is the number of households that own those animals. Only 58 percent of the households among the villagers own the total number of cows which are just 73 in number. Similar is the case with number of other animals in the village. The detail of number of animals and percentage of their ownership is shown in table 7.
Table 7: Animal resources in the village and percentage of owners
Animal Resources No of Animals Percentage of owners
Cow 73 57.7
Goat 50 50.0
Poultry 372 86.5
-27- 0.00 1.00 2.00 3.00 4.00 5.00 6.00 7.00 8.00 0 200 400 600 800 1000 1200 1400 1600
Low Medium High
Pe rce nt ag e Ta ka p er mon th Income Groups Lighting (taka/month) Cooking (taka/month) Average percentage of income willing to contribute
4.12
Willingness to pay
Respondents were also asked to indicate whether they are willing to pay for the cooking and lighting energy, if some project could supply cooking gas and electricity in the future. Majority of the households in the village were found interested in paying for both the utilities as the demand of cooking gas and electricity for lighting is quite evident in the village.
Among all the households around 88 percent of them were willing to pay for the cooking gas and around 90 percent of the households were found willing to pay for lighting. A few households in both the cases are not willing to pay anything because either they do not have enough money to pay for the facility and some have mentioned that they are already paying for solar PV so that they cannot pay any more.
However majority of the respondents have expressed interest in paying for the utilities and told the amount of money they could be able to pay per month. Figure 7 explains the average amount households could pay per month for lighting and cooking in taka in three income groups.
We can see that the amount of money households could pay is increasing with increase in income level which means that the households with high monthly income are willing to spend more than the households with low income. Another noticeable fact is that the households are willing to pay more for the lighting than cooking in all income groups. It could be because people require proper lighting facilities more than the cooking gas as the kerosene lamps they are currently using provides low quality and dim light.
Another interesting thing to note in figure 7 is that the average percentage of income that households are willing to pay for change in each group is decreasing with increase in income level. It is 7.5 percent in low income group, 6.2 percent in medium income group and 5.2 in high income group. It indicates that the households in low income group are willing to pay greater portion of their income than the medium income group and the same trend is observed between medium and high income group. The possible reason behind such a trend could be that the low income group constitutes of the extremely poor households and they have the least amount of resources at their disposal and they are desperately willing to adopt a technology that could give them better options for cooking and lighting. So they are willing to
Figure 7: Amount of money households willing to pay for lighting and cooking (taka/month) with average percentage of income it accounts for in each income group
-28- 0 10 20 30 40 50 60 70 80 90 100 Illiterate Educated Per cen ta ge Familiar to biogas technology
spend greater portion of their income however the amount is still less than what medium and high income groups are willing to pay. It is because of the fact that the households in medium and high income group can afford more as they have better income. Because of better access to the available resources due to better income the high income group is willing to pay less percentage of their income as compared to medium and low income groups.
4.13
Biogas and poly-generation project
As the poly generation project deals with the production of biogas with cow dung or in case of lack of resources, would utilize the agricultural resource. At this stage it is of prime importance to know the point of view of the local people regarding poly generation project, biogas and possibility of their contribution in the success of such a project in future. So the respondents were asked about their awareness of the biogas technology in the first place, to know if the local people do have an idea about the technology and how many of them have seen or heard about such a technology of gas production using animal waste, which can be used for cooking and other purposes.
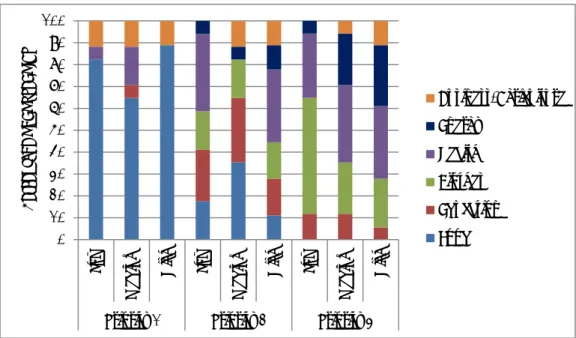
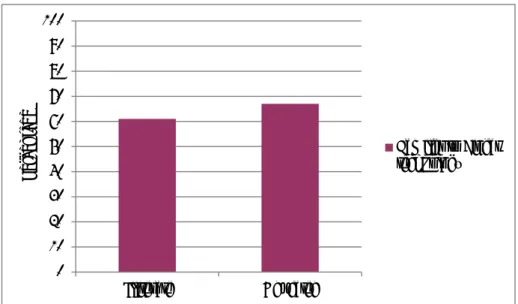
Figure 8 illustrates the awareness of the respondents regarding the biogas technology in groups with two different educational levels. Households are divided in two groups with no education in illiterate group and with some schooling to higher education in educated group. The figure implies that awareness about the biogas is increasing from the uneducated to the educated group. We still can see that the percentage of the respondents aware about the biogas technology is not that huge. One possible reason is that biogas technology is not very common in the village and the surrounding areas and the number of households with individual biogas plants in the village is quite less. So in a fair amount of cases during the survey, we had to explain the unaware respondents about the biogas technology and the project for them to understand and make it easier for them to answer the questions.
Another important question that the respondents were asked to answer about the contribution of the villagers for the project especially with the cow dung, as it is first priority raw material to produce biogas by the poly generation project. Sometimes we had to explain the respondents about the technology as well as the outcomes of the project in order to present a clear perspective in front of them. Then their willingness to contribute in such a project was inquired.
Figure 8: Percentage of households familiar to biogas with education level of respondents
-29- 0 10 20 30 40 50 60 70 80 90 100 Illiterate Educated Per cen ta ge Willing to contribute
In the above figure the willingness of the households for their contribution to provide dung in the plant is analyzed with the education level. It is quite promising that majority of the members is willing to contribute in biogas based project with the waste of their cattle. The graph indicates that a higher percentage of respondents are willing to contribute in the project with better education level. That means that the households with better education are more inclined to contribute in such a project with their resources, as they realize its importance more than the other uneducated group. Similar findings are stated by (Miah et al, 2011), that the households with better education level are more willing to change to the efficient energy carriers, which is the question addressed in their study regarding Bangladesh. But the impressive thing about the trend shown in graph is that significant number of households in both the groups is willing to contribute. Surprisingly, many households who currently do not own cows are also quite interested in the project and were willing to contribute as soon as they would have the cattle. The respondents who are not willing to contribute in both the groups either consider their current use to be more important or they were reluctant to have an additive responsibility.
Figure 9: percentage of households willing to contribute in the project, with education level
-30- 98% 2% Total cooking Energy Demand kWh Total Lighting Energy Demand kWh
5 Energy demand
The main source of cooking energy of rural households throughout the country is biomass. Since in other south Asian countries, LPG is also used for cooking and its use is increasing, but in Bangladesh most of the people in rural areas only rely on biomass for meeting their cooking energy demand. Nearly 70 percent of the energy used for lighting in rural Bangladesh comes from kerosene and 30 percent from electricity. However people prefer to use electricity in the electrified areas but almost 100 percent of the people in rural areas use kerosene for lighting. (Asaduzzaman et al, 2010).
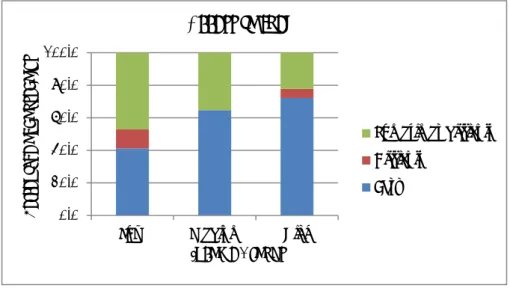
Considering the part of energy problems, biogas poly generation project focuses on the provision of cooking gas and electricity in the village. So the focal points of the energy demand calculation and analysis in the report are cooking energy and lighting demand. Out of the total energy used for cooking and lighting in the village, cooking energy by far dominates the energy demand. Figure 10 clearly illustrates that 98 percent of the energy demand in the village is for the cooking and lighting has a nominal share as in comparison.
To find out the total cooking and lighting energy demand was an imperative part of the survey. It was very important for the study and the project to know the amount of energy utilized by the villagers for cooking and lighting. It was a challenging part to know the correct amount of consumption of a particular type of fuel as most of the people do not pay any attention while cooking about the amount of biomass used. Secondly very few households buy fuel wood or cow dung on a monthly or yearly basis, as most of the people have their own resources or they collect. But as the kerosene is major fuel used for lighting and all the households buy kerosene from the market, so it was comparatively easier to calculate the lighting fuel consumption.
Figure 10: Share of cooking and lighting energy in total energy consumption