IT 15 041
Examensarbete 30 hp Juni 2015
Tool And Algorithms for Rapid
Source Term Prediction (RASTEP)
Based on Bayesian Belief Networks
Prerna Agrawal
Institutionen för informationsteknologi Department of Information Technology
Teknisk- naturvetenskaplig fakultet UTH-enheten Besöksadress: Ångströmlaboratoriet Lägerhyddsvägen 1 Hus 4, Plan 0 Postadress: Box 536 751 21 Uppsala Telefon: 018 – 471 30 03 Telefax: 018 – 471 30 00 Hemsida: http://www.teknat.uu.se/student Abstract
Tool And Algorithms for Rapid Source Term Prediction (RASTEP) Based on Bayesian Belief Networks
Prerna Agrawal
In case of an accident in a nuclear power plant (NPP), the fast and cor-rect
identification of the NPP state that would give a prediction of a possible radioactive release presents a major challenge to both nuclear power plants and regulators. Such prediction is important so that correct and timely decisions and measures are taken to mitigate accident consequences, such as evacuation of people from areas around the power plant.
Recent research work [2][3] proposes analyzing the NPP using the Bayesian Belief Network models as a solution to this problem. A BBN is a graphical model that represents any entity with a set of connected nodes. These nodes represent the random variables and the connections between the nodes represent the conditional dependencies between them [7]. However, the BBN models alone are not suitable for use in off-site locations under high stress conditions by people who are not experts.
Hence there arises a need for an interface that would –
- Be easy to operate by non-experts under high stress situations with incomplete knowledge of the plant state.
- Provide the more detailed information about the network that is not easy for users to read out from the BBN itself.
- Provide good graphical displays of the radioactive release predictions and other statistics of the network.
One such tool is developed as a part of this master thesis project. The contribution is twofold –
- Analyzing the user requirements, designing the architecture and development of the tool.
- Design and implementation of the algorithms for extracting additional information from the network which is not easy to read out while working directly with the BBN. This kind of information helps the user to take some decisions with entering the observations when the user is not a BBN expert. For instance, it helps the user to know which nodes are important to answer and which nodes can be left out. This also helps the user to interpret the intermediate state of the BBN model of the plant. The tool and the algorithms were evaluated by an expert user in order to assess them based on ease of use, value of the analysis output and the processing time. This project work was carried forward in collaboration with Swedish Radiation Safety Authority (SSM) [8]. SSM is already assessing the tool with the goal to obtain fast and independent predictions of radioactive releases based on plant observations.
Tryckt av: Reprocentralen ITC IT 15 041
Examinator: Justin Pearson Ämnesgranskare: Wang Yi Handledare: Pavel Krcal
CONTENTS
Abstract List of Figures List of Tables Abbreviations 1. INTRODUCTION ... 1 2. BACKGROUND ... 32.1 Bayesian Belief Network ...5
2.2 RASTEP Structure and interfaces ...6
2.3 Related Work...7
3. PROJECT OBJECTIVES ... 8
4. SOLUTION ... 10
4.1 Accident scenario specific aspects of a BBN ... 11
5. TOOL DESIGN AND REQUIREMENT SPECIFICATIONS ... 12
5.1 Projects in RASTEP ... 12 5.1.1 User Requirements ... 12 5.1.2 Implementation ... 13 5.2 Observation Entry ... 13 5.2.1 Display ... 14 5.2.2 Navigation ... 16
5.2.3 Action & initiating event scenario description ... 17
5.2.4 Registering one observation ... 17
5.3 Screen Dock ability ... 18
5.3.1 User Requirements ... 18
5.3.2 Implementation ... 18
5.4 Source Term Visualization ... 18
5.4.1 User Requirements ... 18
5.4.2 Implementation ... 19
5.5 Handling Case Files ... 20
5.5.1 User Requirements ... 20
5.5.2 Implementation ... 20
5.6 Worst Case Scenarios ... 21
5.6.1 User Requirements ... 21
5.6.2 Implementation ... 21
6. DEPLOYMENT ... 22
7. DESIGN OVERVIEW ... 23
7.1 Approach ... 23
7.3 Proposal for Architecture... 24
7.4 Use Case Model ... 25
7.5 Application Architecture ... 26
7.5.1 Presentation Layer ... 26
7.5.2 Business Object Layer ... 27
7.5.3 Data Access Layer ... 27
7.6 Database Architecture ... 28
8. ALGORITHMS ... 29
8.1 Identify Strong Contradiction and its Source ... 30
8.1.1 Implementation Steps ... 30
8.2 Identify Weak Contradiction and its Source ... 33
8.2.1 Implementation Steps ... 33
8.3 Calculate Network Determinism in Percentage ... 35
8.3.1 Implementation Steps ... 35
8.4 Calculate Network Severity in Percentage ... 37
8.4.1 Implementation Steps ... 37
8.5 Identify the nodes that have the least effect on network determinism & release severity ... 38
8.6 Identify next node that brings the network to the most deterministic state ... 39
8.7 Identify next two nodes for most severe release ... 41
9. EVALUATION OF ALGORITHMS ... 43
9.1 Identify Strong Contradiction (Parallel) ... 43
9.2 Identify Weak Contradiction (Parallel) ... 44
9.3 Calculate Network Determinism in Percentage (Parallel) ... 45
9.4 Calculate Network Severity in Percentage (Parallel) ... 46
9.5 Identify the nodes that have the least effect on network determinism & release severity ... 47
9.6 Identify next node that brings the network to the most deterministic state ... 48
9.7 Identify next two nodes for most severe release ... 49
10. CONCLUSION ... 52
LIST OF FIGURES
Figure 1: Example of a Bayesian Belief Network ...5
Figure 2: Scheme of the RASTEP tool ...6
Figure 3: List of observational nodes ... 15
Figure 4: Observation question with available answers ... 16
Figure 5: Source term predictions ... 16
Figure 6: Bar chart showing the source term visualization ... 20
Figure 7: Use Case Model for RASTEP ... 25
Figure 8: Three Layer Architecture ... 26
Figure 9: Database Diagram for RASTEP ... 28
Figure 10: Strong and weak contradiction algorithm ... 32
Figure 11: Implementation for the display of Network determinism in percentage ... 36
Figure 12: Nodes with least effect on Network determinism And release severity ... 38
Figure 13: Node (highlighted in yellow) that brings the network to most deterministic state ... 39
Figure 14: Message box showing the state for the highlighted node shown in Figure 13. This state for the node brings the network to the most deterministic state ... 40
Figure 15: The next two nodes that bring the network to most severe state. The nodes are highlighted in yellow and marked with the order 1 and 2 ... 41
Figure 16: The states for the two highlighted nodes (shown as highlighted in Figure 15) that bring the network to the most severe state ... 42
LIST OF TABLES
Table 1: Evaluation for Algorithm 1 ... 43Table 2: Evaluation for Algorithm 2, Impact on determinism ... 44
Table 3: Evaluation for Algorithm 2, usefulness of information ... 44
Table 4: Evaluation for Algorithm 3 ... 45
Table 5: Evaluation for Algorithm 4 ... 46
Table 6: Evaluation for Algorithm 5 ... 47
Table 7: Evaluation for Algorithm 6, usefulness of information ... 48
Table 8: Evaluation for Algorithm 6, processing time ... 48
Table 9: Evaluation for Algorithm 7, usefulness of information ... 49
ABBREVIATIONS
TMI Three Mile Island NPP Nuclear Power Plant SSM Swedish Safety Authority BBN Bayesian Belief Network RASTEP Rapid Source Term Prediction GUI Graphical User Interface CPT Conditional Probability Table
GRS Gesellschaft für Anlagen- und Reaktorsicherheit GmbH
SPRINT System For The Probabilistic Inference of Nuclear Power Plant Transient
STERPS Source Term Prediction Based On Plant Status LRC Lloyds’ Registers Consulting
Tool And Algorithms for RASTEP based on Bayesian Belief Networks
1
1. INTRODUCTION
The motivation behind the development of such a tool can be illustrated by one of the nuclear power plant accidents that took place in Pennsyl-vania on March 28, 1979, the Three Mile Island (TMI) Accident. The accident was rated 5 out of 7 on the International Nuclear Event Scale. The cause of the accident was one of the release valves that was left open mistakenly, which resulted in the reduced levels of the nuclear reac-tor coolant in the secondary system. This failure was compounded by the wrong judgement by the operator who mistakenly believed that there was excessive coolant and had manually overridden the manual emer-gency cooling system
In an accident scenario of a NPP, it is typically extremely difficult to find out the exact state of the plant. The emergency response teams face this huge challenge to predict the probability of the radioactive release before it occurs in reality. In the event of any nuclear emergency, it is crucial to implement an appropriate response in the early phase. This response depends on the prediction of the source term release in the plant. The source terms are defined as the amount and isotopic composition of a radioactive release from a nuclear reactor that represent a nuclear acci-dent [4]. We also add timing as a part of source term definition. This prediction is achieved by the assessment of the plant status and the asso-ciated source terms. Such predictions are useful for decisions about evacuation etc. [10].
An independent authority like SSM is interested to determine the plant state in order to predict radioactive releases. In a typical situation of an accident in a nuclear power plant, it is important to be able to predict the source term release as soon as possible. Standard safety analysis methods such as probabilistic safety analysis or deterministic safety analysis are typically executed offline and might take from hours to weeks of calcula-tion time. Thus it is crucial to have a decision support tool in case of an emergency. Currently, there are no suitable tools for non-expert use in a high-stress situation. A new method developed within the RASTEP pro-ject with SSM uses BBNs for this purpose [3][5]. This approach is suita-ble for a rapid and early detection of a source term release.
A software tool is required to enable non-experts to use BBNs in high-stress situations. This tool should provide an interface for entering
ob-Tool And Algorithms for RASTEP based on Bayesian Belief Networks
2
servations and reading out source term probabilities. It should also help with entering observations and interpreting results by smart algorithms. This thesis work aims at developing the tool and algorithms that extracts as much as possible relevant information from the Bayesian Belief Net-work (BBN) model and presents it in a well-understandable way to the users who evaluate this information and use it in further operation of RASTEP and interpretation of results. In the first step, this work was focused towards the Nuclear Plant models as the starting point, although his approach can be applied also to other areas than nuclear. The tool provides the user interface that is easy to understand and operate in the situations of stress and when the operator has limited expert understand-ing.
The major part of the thesis work includes the designing, development and evaluation of the algorithms in RASTEP that will provide the user with the relevant information from the BBN, while the user enters the observations. For instance, the user is given prompt alert when they are contradicting their own observations answered in the past. The user who is not very well known to the plant observations under the stress situa-tion is directed with the nodes that he should answer in order to get closer to a conclusion. Also, the tool can indicate to the user which ob-servations lead to the most severe radioactive releases.
Tool And Algorithms for RASTEP based on Bayesian Belief Networks
3
2. BACKGROUND
The basic aim is to develop and design the algorithms and the tool for rapid source term prediction (RASTEP) for practical use in severe acci-dent situations. This includes the design and implementation of the algo-rithms so as to extract the information from the network which is help-ful for the user who does not have complete knowledge/information of the plant. This also helps the user to know about the overall state of the plant. This information otherwise is impossible to comprehend when a user works directly on a Bayesian belief network. The RASTEP tool is designed and developed with the required interface and the graphical visualization of the source term release and the algorithm output values. RASTEP (Rapid Source Term Prediction) tool is used to make some initial predictions of the source term release on the event of an accident at a nuclear power plant. The tool would function on the basis of the state of the plant (entered in the form of observations by the user) [5]. The Bayesian belief network theory is the probabilistic based analysis that is used in situations where there is a lack of information of the char-acteristics that are contributing towards certain event. Bayes theorem is used for the calculations of the probabilities of such events. This ap-proach works on the fact that the beliefs (probabilities) of the contrib-uting factors are defined in the beginning and then updated later on, when more information is available on the advancement of the event [2]. The Bayesian network model for RASTEP is built on the logical rela-tionships (that are developed by nuclear engineering experts) between the different NPP parameters that are depicted by a graphical network. The BBN model is specific to a NPP and is developed on the plant spec-ifications and the documentation. Each node in the BBN represents a parameter/observable of the plant [2]. Apart from the structure of the network, the probabilities of each state are defined in the conditional probability table (CPT) for each node. The probabilities of an observa-tional node are updated on the progression of an accident (when the user enters an observation). The default probabilities of the nodes are defined in the model by the nuclear experts.
An observation is a statement about an aspect of the plant (pressure, temperature etc.) or about used/failed safety functions. The nodes in the
Tool And Algorithms for RASTEP based on Bayesian Belief Networks
4
BBN are characterized as observational and non-observational. Some of the non-observational nodes represent the source terms.
The observations entered by the user are the plant states that are ob-served on the event of the emergency. These are mapped to the observ-able nodes. When a user enters an observation, the probability of the respective node is set. The model is then recompiled to update the con-ditional probability tables (CPTs) and to obtain any possible source term release percentages.
Tool And Algorithms for RASTEP based on Bayesian Belief Networks
5
2.1 Bayesian Belief Network
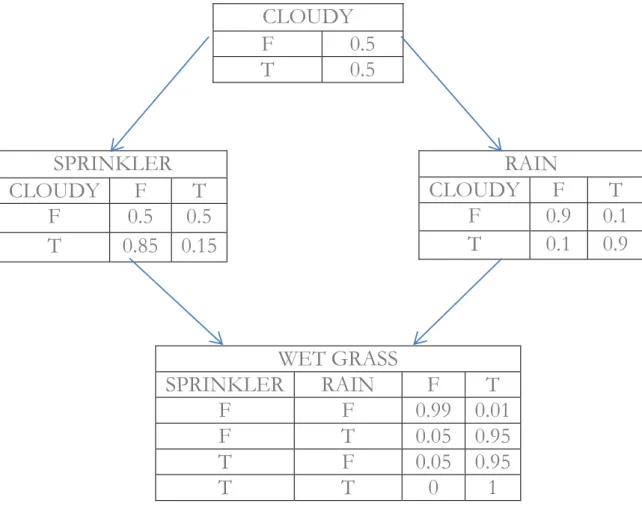
A Bayesian network is a graphical model that represents any entity with a set of connected nodes. These nodes represent the random variables. These could be categorized as observational or some unknown parame-ters. The connections between the nodes are the directed arcs that repre-sent the conditional dependencies between the nodes and define the parent and child node. If two nodes are not connected, that means that the nodes are conditionally independent. Each node has a probability function which takes the parent node variables as input and calculates the probability of the node variable. The probabilities of the observa-tional nodes are updated when the observation for that node is entered. As the observational nodes are answered, the whole network is recalcu-lated and the probabilities of all other nodes are updated [1]. Figure 1 is illustrating an example of a Bayesian network with the conditional prob-abilities of a wet grass, based on the fact if it is raining or the sprinkler is working.
Figure 1: Example of a Bayesian Belief Network
CLOUDY F 0.5 T 0.5 SPRINKLER CLOUDY F T F 0.5 0.5 T 0.85 0.15 RAIN CLOUDY F T F 0.9 0.1 T 0.1 0.9 WET GRASS SPRINKLER RAIN F T F F 0.99 0.01 F T 0.05 0.95 T F 0.05 0.95 T T 0 1
Tool And Algorithms for RASTEP based on Bayesian Belief Networks
6
2.2 RASTEP Structure and interfaces
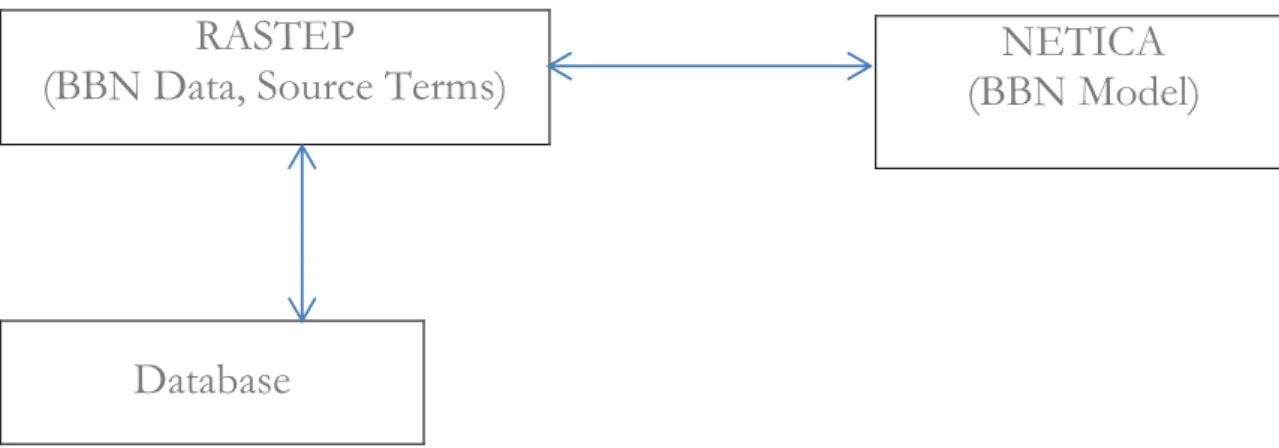
Any RASTEP model will work together with two fundamentally differ-ent differ-entities, a BBN model which is used to predict the plant states and release paths, and a source term mapping file used to define the source terms with height, composition, amount, and timing [3]. Input to the tool is in the form of observations that can be entered manually by an operator. The tool scheme is depicted in the Figure 2.
RASTEP
(BBN Data, Source Terms)
Figure 2: Scheme of the RASTEP tool
It is identified that RASTEP may have future possibilities of adding au-tomatic data transfer capabilities from the nuclear power plant.
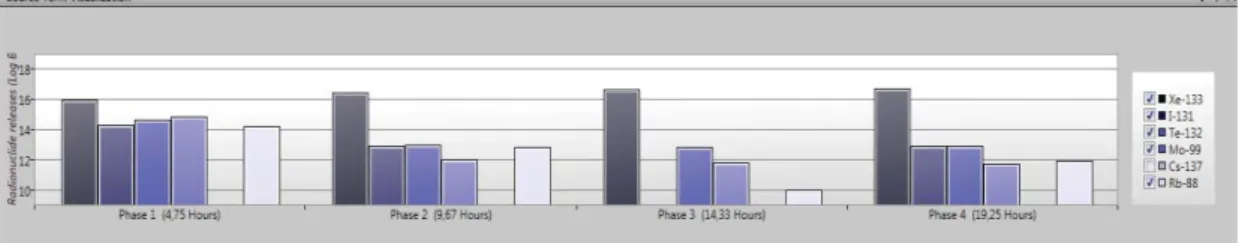
RASTEP interface provides the graphical depiction of the source term release. The release is distributed across 4 phases. When the user answers an observation question, the probabilities are reset for the states of the node and the model is recalculated. Hence with the answer for each ob-servation, the source term probabilities are recalculated. The phases and definitions of these source terms are mapped in the source term excel sheet (called source term mappings). Source term data are then used to generate the bar charts for the graphical representation of the source term release.
NETICA (BBN Model)
Tool And Algorithms for RASTEP based on Bayesian Belief Networks
7 2.3 Related Work
SPRINT
An interface called SPRINT (System for the Probabilistic Inference of Nuclear power plant Transients) was being used to relate predefined source terms to the corresponding end states in the BBN. SPRINT was developed within the European projects STERPS (Source Term
Predictions Based on Plant Status) and will be eventually replaced by this tool, i.e., RASTEP. The SPRINT interface presents questions for the users which gives the opportunity to the users to introduce findings into the network [2].
GRS: QPRO QUELLTERMPROGNOSE (GRS/ GERMANY)
GRS, Germany developed the EU project part of the original STERPS model. The model was further developed under the contract with the Ministry of Federal Government and the project was named as QPRO (QuelltermPROgnose, i.e., source term prognosis). This project resulted in a dedicated interface which was used for analysis and application of the assessment of off-site consequences [2].
Tool And Algorithms for RASTEP based on Bayesian Belief Networks
8
3. PROJECT OBJECTIVES
The goal of this project is to design and implement a tool for rapid source term prediction based on a BBN model that represents the nucle-ar power plant. The tool not only analyses the BBN model, but also pro-vides additional information for improved understanding of the
BBN/plant state based on the current knowledge (observations). Design, implementation and evaluation of algorithms which provide this infor-mation present a key objective of this project. The approach is chosen so as to facilitate the decision making in an emergency situation under high stress conditions when only incomplete or partly contradictive infor-mation is available.
The main project objectives are –
1. Develop a professional tool that can be used efficiently to interact with the BBN model, is user friendly to enable non-experts to work under high stress situations and has good graphical visualizations.
2. Coordinate with SSM on precise formulations of objectives. 3. Invent novel ways of bringing more information about so
far entered observations, current state and possible future accident evolutions to the users.
4. Implement algorithms which analyze the BBN in order to bring this information.
5. Evaluate these algorithms.
The development of the tool is carried out in accordance with profes-sional design and programming standards for the database and the Graphical User Interface (GUI). This design is developed with keeping the possible future enhancements to this thesis work in mind. This fu-ture work could include the automatic observation registration and the web based result presentation. One goal of the project is a functioning desktop application together with appropriate documentation.
The other major project objective is the design, implementation and evaluation of the algorithms that extract the information from the BBN model which helps the user with entering the observations. The evalua-tion of the algorithms is focused on the following aspects: efficiency
Tool And Algorithms for RASTEP based on Bayesian Belief Networks
9
(measured on supplied models), ease of use, value of the analysis output and the processing time (these criteria are evaluated in cooperation with experts from LRC or SSM). Proposing and evaluating of these analysis algorithms is the main research activity.
Tool And Algorithms for RASTEP based on Bayesian Belief Networks
10
4. SOLUTION
There were three key areas identified to resolve the problem areas men-tioned above:
1. Tool development:
The front end of the tool is developed using .NET framework for C#. This included the project development in Windows Presentation Foundation (WPF) to include the docking feature, and the customized bar and pie charts. The backend database was built on SQL Server database to interact with the C# appli-cation. SQL Server is a professional database server provided by Microsoft to efficiently store and handle large data. The BBN model built in Netica is imported by the C# application. The network is calculated by Netica, as the Netica commands are called in C# application using Netica C# API (Application Pro-graming Interface). Netica is a powerful tool provided by Norsys for building and working on the Bayesian networks [6].
2. Algorithms:
First, aspects of the BBN model relevant for RASTEP users were identified. Then, algorithms for evaluation of these aspects and their presentation in a well-understandable way to users were developed.
3. Evaluation:
The evaluation of the algorithms is carried out rigorously by one of the nuclear experts at Lloyds’ Registers Consulting to examine them on their efficiency, ease of use, value of the output generat-ed and the processing time. The results are well documentgenerat-ed and used as the basis of future work.
Tool And Algorithms for RASTEP based on Bayesian Belief Networks
11
4.1 Accident scenario specific aspects of a BBN
Certain observational states (answers entered by the users) could be wrong. This could be based on incomplete or incorrect information available, incomplete expert knowledge, wrong judgement etc. BBN models can work with a partially contradictory input, but these situations are identified by some of the algorithms. For example, one such algo-rithm identifies the contradictory answers and also notifies the level of contradiction.
The BBN model that represents the nuclear plant contains information that is difficult to read out when one is working directly on the model, e.g., the level of determinism and severity of the network. While working with a BBN model, it is important to know the deterministic level of the complete network. High determinism of the network will lead to strong-er predictions. Network detstrong-erminism is defined in the section 8.3. In the accident scenario, when the user is working on the tool to get some pre-dictions of the source terms, it will be very helpful if the user can see the severity of the plant in the form of a graphical display, especially when the user does not have a detailed knowledge of the nuclear power plant where the accident occurred. Plant severity is defined in section 8.4. It is also possible to know which node should be answered next in order to bring the network to the most deterministic state. Also it can be very useful to know which nodes are not very important to answer, especially when the user does not know the answers for many nodes in the net-work. It is also possible to know the next two nodes that will bring the network to the most severe state.
A detailed description of algorithms is in Section 8. Evaluation of these algorithms based on various criteria is presented in Section 9.
Tool And Algorithms for RASTEP based on Bayesian Belief Networks
12
5. TOOL DESIGN AND REQUIREMENT
SPECI-FICATIONS
This section details requirements on the RASTEP tool and describes the chosen design. Sources for requirements were the SPRINT tool, direct input from SSM and own ideas accepted by SSM. The design has been developed fully within the thesis work.
5.1 Projects in RASTEP
From users' perspective, the RASTEP tool works with projects contain-ing all important data.
5.1.1 User Requirements
A project in RASTEP is an OS file. This file would contain: 1. The BBN model
2. The Source term definitions and 3. The history of observations.
User can create and work on multiple projects. These projects can be copied to and used on multiple machines which have RASTEP installed. Once the user has created a project, he/she can enter the observations with a time stamp. These observations get stored in the project history with each entry.
A user can perform the following operations on RASTEP projects. 1. Create new project – The user is prompted to select the
BBN model and then the source term definitions.
2. Open Project – The user is required to choose an existing project file and open the project to start working.
3. Save Project – The user can save the current working pro-ject. For a new project, the user is prompted to select a lo-cation and a file name. Whereas for an existing project, it overwrites the current project.
4. Save As – The user is prompted to enter a location and a file name to save a new version of the project file.
5. Reset History – The user can remove all the history of the current project and start to enter the new observations.
Tool And Algorithms for RASTEP based on Bayesian Belief Networks
13 5.1.2 Implementation
This section describes the implementation details for the above set of requirements.
The RASTEP tool can be used to work with multiple projects. Each project file will be a zip file that contains the following files –
1. BBN model (DNE) file 2. Source Term file (excel) 3. SQL Database file (MDF)
Below is the implementation description for each of the project opera-tions -
1. Create new project – The user imports a new DNE model and the source term excel file. The RASTEP tool then creates a new SQL database for the new project.
2. Open Project – The user selects a project file to open. This project file is actually a zip file that contains the DNE file, the source term file and the database (MDF) file. The open project option would unzip the project file and create a working directory. At the same time the tool will attach the database MDF file to the SQL server. 3. Save Project – When the user saves the current project, the tool
would either create a new project file which is actually a zip file. Or if the user is working on an existing project, the updated version of the project (zip file) overwrites the current version. The generated zip file will contain the database (MDF) file, DNE file and source term file.
4. Save As – The updated project is saved as a new project (zip) file. 5. Reset History – When the user resets history, the tools will delete all
the observational history from the database file. 5.2 Observation Entry
The basic user interaction entity is an observation. We discuss the way in which observations are displayed, entered, navigated. The user is re-quired to input his knowledge about the plant states in the form of ob-servation entry in the tool.
Tool And Algorithms for RASTEP based on Bayesian Belief Networks
14 5.2.1 Display
This feature includes how the observation entry panel is displayed to the user.
5.2.1.1 User Requirements
¾ The user is shown a list of all observable nodes. Each node would contain –
1. The node name and a short description
2. An indication if the node has been answered or not 3. The answered state of the node if it has been answered ¾ Each node can be selected to see the observation question for the
node.
¾ Further the current observation question is displayed to the user where he/she can enter the observations for each observational node.
¾ User is provided with the summary of all the answered questions and their answers.
¾ The user can also see the source terms listed on the screen togeth-er with their current probabilities. It should be easy to see what the greatest risks are at each moment.
5.2.1.2 Implementation
The above user requirements are implemented as follows
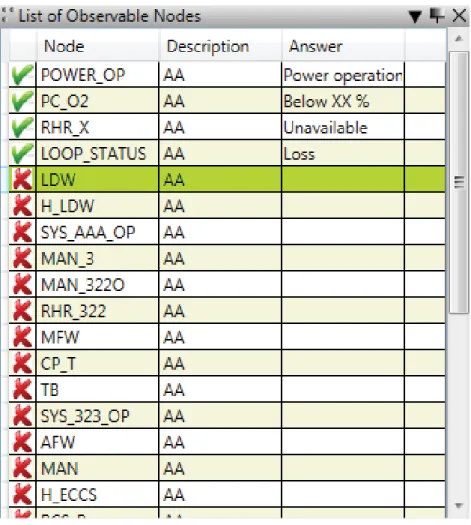
¾ The list of observable nodes are shown as a list view on the left of the screen
1. The node description is displayed as a text in front of the node name and a tool tip.
2. The indication if the node is answered or not, is shown as an icon in front of each node. It is a red cross icon for all unanswered node and a green check icon for each an-swered node shown in Figure 3.
Tool And Algorithms for RASTEP based on Bayesian Belief Networks
15
Figure 3: List of observational nodes
¾ Each node is color highlighted if the respective observational ques-tion is shown on the screen.
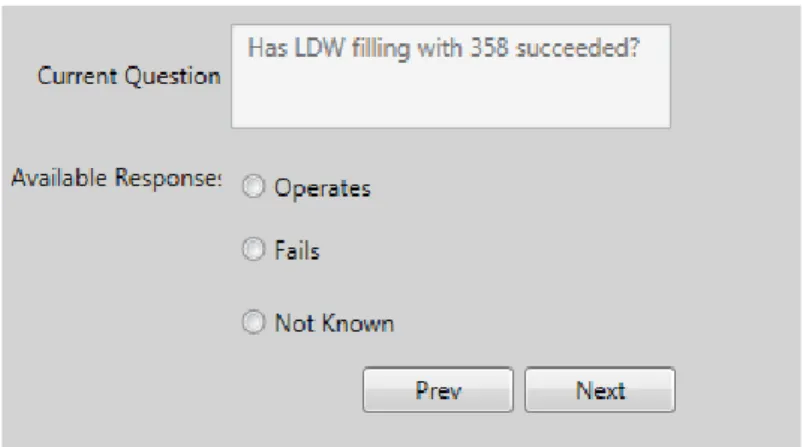
¾ The observation question for the selected node is displayed in a textbox in the center of the screen. The answers available for this question are shown as radio button list. Every question has a last option as 'not known'. These answers are nothing but the states of the node. Shown in Figure 4.
Tool And Algorithms for RASTEP based on Bayesian Belief Networks
16
Figure 4: Observation question with available answers
¾ The summary of all the answered questions is provided in a text box or a grid on the bottom of the screen
¾ The source terms are listed as a tree view on the right of the screen. Each of the parent tree nodes are the names of the com-partment in the power plant with the related source terms listed with their percentages as the child node. The tree can be collapsed or expanded. Also the child tree nodes are color coded for the var-ying percentages of the source terms. The lightest being for the least percentage and vice versa. The parent node is color coded with the brightest color code of the respective child nodes. Shown in Figure 5.
Figure 5: Source term predictions
5.2.2 Navigation
This feature describes about how the user navigates through various observations
Tool And Algorithms for RASTEP based on Bayesian Belief Networks
17 5.2.2.1 User Requirements
¾ The user shall be able to navigate back and forth with the ques-tions.
¾ It is possible that the user can select the nodes at random to an-swer.
¾ The revised source term predictions shall be reflected to the user on each observation registration
5.2.2.2 Implementation
¾ By default the first observational node is highlighted with the re-spective node question displayed on the screen. The user is pro-vided with a 'Next' and 'Prev' button options to navigate to imme-diate next or previous questions.
¾ The user can also select any unanswered node in the list at ran-dom. The respective node question is then be shown on the screen and the node is highlighted.
¾ As the user selects the answers for each question, the tree view (source terms) on the right of the screen gets refreshed with the updated source term percentages.
5.2.3 Action & initiating event scenario description
On the event of any accident in a power plant, the user aims at determin-ing the source term release predictions. This is carried forward by enter-ing the sequence of observations in the RASTEP tool. It is first required to enter the initiating event (start of the accident) date and time before any observation entry. The user shall then progress with entering the observations for each node.
5.2.4 Registering one observation
This feature includes how the observations are stored in the database for future use.
5.2.4.1 User Requirements
The user is required to enter the observations in the tool. This comprises of the observatory question for each observational node. On each obser-vation registration, the user shall be provided with the updated source
Tool And Algorithms for RASTEP based on Bayesian Belief Networks
18
term predictions. There will be two modes for observation entry which is explained in the next section.
x Physical Time Mode x Logical Time Mode
5.2.4.2 Implementation
When the user selects one of the available answers, the tool stores the observation entry to the database. The tool sets the belief of the respec-tive node to the answer and further recompiles the whole network to obtain the refreshed values of the source terms. If the user does not have an observation for a question, he/she can answer 'Not Known'. This would mean no change to the network or source terms on that entry.
5.3 Screen Dock ability
This feature includes the movability of the individual screens.
5.3.1 User Requirements
The tool should have the capability of dragging, resizing and docking multiple screens. It is required that the user should be able to drag and adjust each of the screen panel in this application.
5.3.2 Implementation
To implement the docking feature, Windows Presentation Foundation (WPF) project type is used. This helped in developing the enhanced user interaction features in this tool. A third party project “DockingLibrary” is included and referenced. This project has all the source code included hence it is possible to make modify the code.
5.4 Source Term Visualization
This feature includes the visualization techniques for the radioactive re-lease predictions.
5.4.1 User Requirements
¾ Once the user loads the Netica model by clicking on button “Load Model”, the user sees the observable nodes listed on the left panel on the screen.
Tool And Algorithms for RASTEP based on Bayesian Belief Networks
19
¾ Next the user loads the source term mappings excel file by clicking on the button “Load Source terms”. Then the user further sees the source terms with their respective percentages on the right panel on the screen.
¾ Source terms are categorized in the source term window based on their probability calculation–
Red – High Probability
Dark Pink – Medium Probability Light Pink – Low Probability Black – Zero Probability
¾ On click of each source term, it will be further possible to see a graphical view of the release of radionuclides in each phase, includ-ing the timinclud-ing (release phases) and the composition of the release in each phase (Bq per nuclide group). The list of radio nuclides are taken from the source term sheets in the excel file. Also the phases are captured dynamically for each source term in the excel sheet. ¾ When the user clicks on the source terms, the user should be able
to see the graphical view on the bottom panel on the screen. The user should be able to drag the panel as floating and resize it as de-sired.
¾ The user should be able to select one or many radionuclides at a time to be able to see only that radionuclide for all phases in the bar chart.
5.4.2 Implementation Bar Chart
Source terms are visualized by bar charts. The X axis of the graph con-tains the 4 phases. Each phase concon-tains the bar depiction for each nu-clide. Each nuclide has a color code representation. The color mappings are shown on the right of the screen. Y axis range is from log 109 to log
1019 Bq [9]. Further it can be possible to have the exact amount in TBq
displayed on the top of each bar. Bar chart implementation is shown in Figure 6.
Tool And Algorithms for RASTEP based on Bayesian Belief Networks
20
Figure 6: Bar chart showing the source term visualization
5.5 Handling Case Files
It is required to have the possibility of registering the observations
through a case file. This file contains the list of all nodes and the answers for some or all of the nodes. When this file is loaded in the tool, the re-spective nodes should be marked as answered and the network should be recompiled accordingly.
5.5.1 User Requirements
¾ After the user has loaded the model and the source term file, the user should see the option “Open Case File”, enabled in the file menu.
¾ Once clicked, the user will be displayed an open file dialog box. ¾ Once the user selects the case file, it will register all the answered
nodes and highlight them with the answer and the green icon on the left panel on the screen.
¾ This will also update the calculation of the source term percentages that are displayed on the right panel of the screen.
5.5.2 Implementation
The above set of requirements is implemented using the file dialog box. Once the user loads the case file, the answers are marked for the nodes and the network is recompiled.
This shall work in the same way as if the user has answered the observa-tions in the tool.
Tool And Algorithms for RASTEP based on Bayesian Belief Networks
21
5.6 Worst Case Scenarios
As a part of implementation of algorithms, It is required for the user to enter the worst case scenarios.
5.6.1 User Requirements
Once the user loads the BBN model and the source term file, the user is required to enter the worst case scenario for each node. Once this is completed then, all the nodes listed in the left panel are refreshed and marked as not answered. Then the user proceeds with entering the actual observations.
5.6.2 Implementation
This is implemented as per the requirement and once the user completes entering the worst case scenarios, the maximum severity of the network is calculated. This is further defined in the algorithms section.
Tool And Algorithms for RASTEP based on Bayesian Belief Networks
22
6. DEPLOYMENT
The client is provided with the installation package to install the
RASTEP tool and SQL Server. It is possible to provide the user with a sample project package. In this case the project package contains the DNE file, source term file and the database (MDF) file. To run the sam-ple project, the user should select the third option (Create New Project from existing database). This will ask the user to first select the MDF file, then DNE and source term files. Further this will load the sample project.
It is possible to open multiple instances of RASTEP on a single machine. However, only one project can be opened in an instance at a time. To open/create a new project in the same RASTEP instance the current project should be closed.
Tool And Algorithms for RASTEP based on Bayesian Belief Networks
23
7. DESIGN OVERVIEW
The tool is designed according to the above set of requirements; the front end (the graphical user interface and the Netica interaction) [6] is designed with a three layer architecture visual studio application. The backend (database) is designed in the SQL Server.
7.1 Approach
This section was created at the beginning of the requirement analysis and it has been extended in multiple phases over the course of the project -
x Requirements Phase - During the Requirements Phase, the initial version of this document was created, describing the candidate architecture to be validated in the System Design Phase.
x System Design Phase - During the System Design phase, the Evolutionary Prototype is created and this document was final-ized by establishing a sound architectural foundation for the Construction Phase.
x Construction Phase – During the Construction Phase, this doc-ument has not changed radically; it was mainly updated to reflect changes in interface definitions or after discovering any unex-pected implementation limitations.
7.2 Architectural goals & constraints
The overall architectural goal of the system is to provide a very user friendly tool. The tool design is divided into following sections:
1. Data level (how do we store data, how do we read/save data) 2. GUI design: how should the main window look, from which
building blocks should it consist. This has to take into account the following:
x Listing of the observable nodes
x Indication if a node has been answered or not x Registering observations
x Representing the time based history of observations x Navigating between the nodes
Tool And Algorithms for RASTEP based on Bayesian Belief Networks
24
x 'Sensitivity' results: how should we present the results of analyses that we run on the BBN
x Visualization of the source terms 3. Netica interface
The RASTEP tool can be used in the following ways –
x Import a BBN Netica model & the source term definition excel file
x Display a list of Nodes and the viewer options for the network 1. List View – Displays the list of the questions one after
other
2. Network view – Displays the graphical view of the nodes x Possibility for color code for the nodes
x User is able to enter the observations and a recalculation is per-formed
x The list of source terms is displayed. Also the impact visualiza-tion is performed as a graphical display
x The tool should be developed to be time dependent and will maintain an event history in future.
7.3 Proposal for Architecture
It is proposed to have, the three layer architecture, in the .NET applica-tion. This segregates the presentation layer (user interface), the business layer (the logical unit) and the data layer (the connections to the database and data handling). This builds the structure of the project in such a way that can be easily modified and enhanced in future and modularizes the complete project.
Tool And Algorithms for RASTEP based on Bayesian Belief Networks
25
7.4 Use Case Model
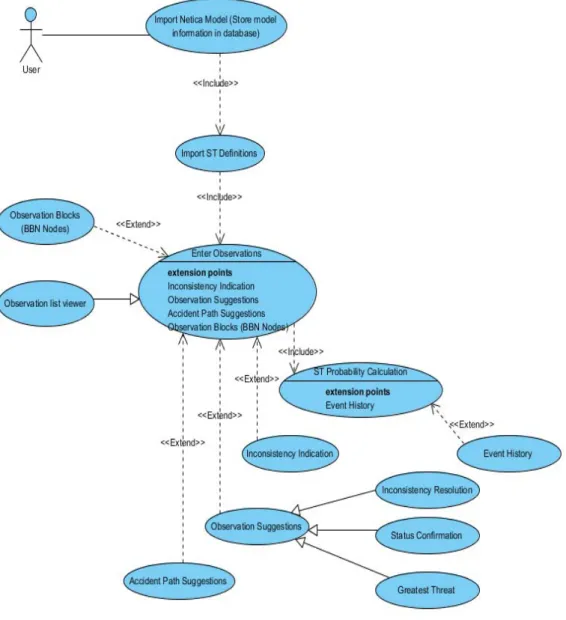
The functionaly of the tool is briefly described in the use case model shown in Figure 7.
The use cases –
1 – Import Netica Model 2 – Import ST definitions
shall be executed only once for a project lifetime. Once the project is created, the user can open the project and enter observations any number of times. The use case model is shown in Figure 7.
Tool And Algorithms for RASTEP based on Bayesian Belief Networks
26 7.5 Application Architecture
Application architecture gives the overview of the various components and their interactions in context of the whole system.
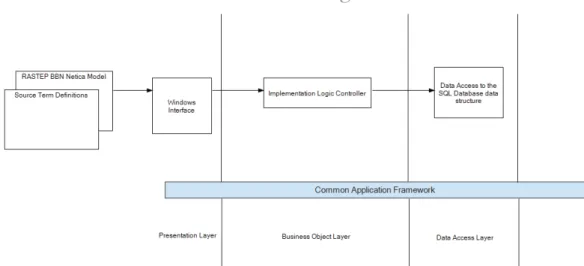
The RASTEP tool comprises of a layered architecture. The various lay-ers are implemented as different class files. The software is divided into three layers –
x Presentation Layer x Business Object Layer x Data Access Layer
The architecture structure is shown in Figure 8.
Figure 8: Three Layer Architecture
7.5.1 Presentation Layer
The presentation layer comprises of the functionalities of the windows application screen that interacts with the user. This includes the list of all nodes, the viewer options for observation list or observation blocks and the entering of the observations. Further after the computations, the screen displays the source term predictions and the graph. The presenta-tion layer interacts with the business layer to perform the execupresenta-tion and calculations.
Tool And Algorithms for RASTEP based on Bayesian Belief Networks
27 7.5.2 Business Object Layer
This layer consists of all the business logic and the calculations. This interacts with the Netica interface, executes the network and fetches the computation results. Further it makes some calculations for sensitivity analysis and the time dependency. The business layer interacts with the data access layer to retrieve and store the data information.
7.5.3 Data Access Layer
The data is stored in the SQL server tables. The business object layer interacts with the data access layer to fetch and store the data. The con-nections are made to the SQL Server database and the data is fetched using stored procedures. These procedures are defined in the database.
Tool And Algorithms for RASTEP based on Bayesian Belief Networks
28
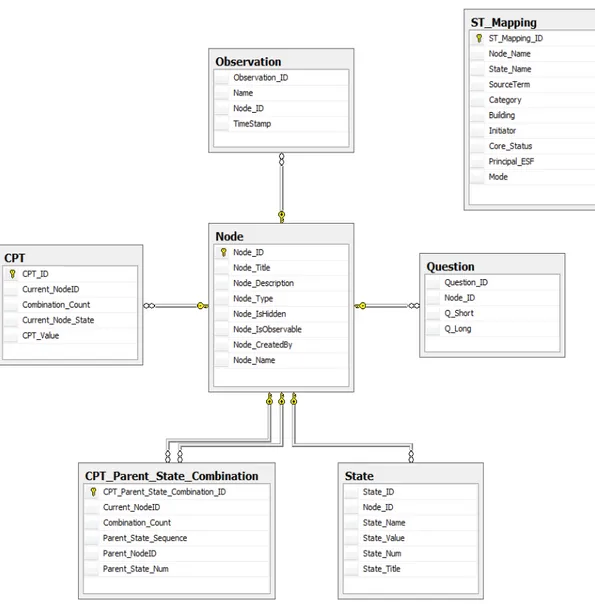
7.6 Database Architecture
The RASTEP tool uses the SQL Server database. The structure of the tables and their relationship is shown in Figure 9.
Storing the observation history is one of the requirements that have been identified as the future work on this tool. This is not the part of this the-sis. The database has been designed such that it can be further modified for such enhancements.
Tool And Algorithms for RASTEP based on Bayesian Belief Networks
29
8. ALGORITHMS
Algorithms were developed and implemented to extract information from the BBN models which will help the user to enter the observations when the user does not have complete information/knowledge about the plant. These algorithms will also help the user to assess the overall state of the network. This information is not forthrightly obvious while working with the BBN model.
Below are listed the algorithms that are implemented to run in parallel as the observations are entered by the user –
1. Identify Strong Contradiction 2. Identify Weak Contradiction
3. Calculate Network Determinism in percentage 4. Calculate Network Severity in percentage
Below are listed the algorithms that are implemented to run specifically when they are invoked –
5. Identify the nodes that have the least effect on network deter-minism & release severity (less than 0.025 % in both cases)
6. Identify next node that brings the network to most deterministic state
Tool And Algorithms for RASTEP based on Bayesian Belief Networks
30
Following is the detailed description of these algorithms -
8.1 Identify Strong Contradiction and its Source
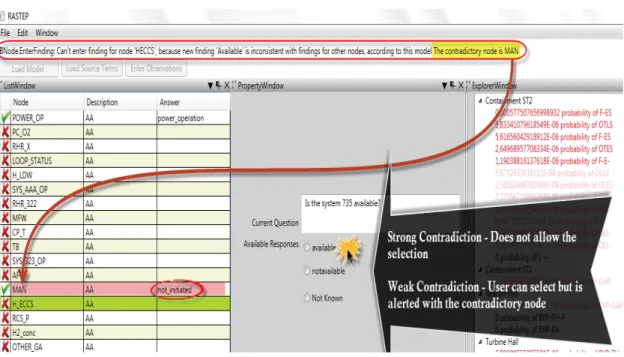
The BBN model comprises of number of interrelated nodes each with its own conditional probability table that defines the belief percentage of each state of the node. Registering an observation for one node can have varied impact on the belief percentages of other nodes in the network. Once the user starts entering the observations, the tool should be able to identify if there are any contradictory observation entries in the past, and which node and observations result in this contradiction. For example, if there are two nodes with the questions as:
1 – If system A has been manually activated? 2 – If system A is available?
If the system A has not been manually activated, then it cannot be avail-able.
This algorithm identifies such nodes and prevents the user from entering contradictory answers. There could be many other such examples of nodes that are contradictory and it might not be very obvious to imply the contradictions just by looking at the available information in Netica.
In the standard deterministic Boolean logic, the answer for a node can be either yes or no. We call such type of contradictions as 100% contradic-tion A node can also have less than 100% contradiccontradic-tion.
This algorithm would focus on 100% contradiction where the user is not allowed to make an observation entry which has such kind of contradic-tion. For the node entries with lesser contradiction, we have defined the next algorithm as “Identify Weak Contradiction”.
8.1.1 Implementation Steps
The implementation comprised of compiling the Bayesian network on each observation entry. The term "Compiling the Bayesian network" means the recalculation of the Bayesian network in terms of the belief percentage of each node. As soon as the user enters a finding for a node, before actually registering that finding in the network, the following steps are performed –
Tool And Algorithms for RASTEP based on Bayesian Belief Networks
31
Recall that there is always an additional answer option ‘Not known’, which users can select when they are not sure of the observation for a node.
1. Run the algorithm only if the existing belief (belief before the user
entered the current finding) of the current node for selected find-ing is = 0 (the selected findfind-ing for the node has a strong contra-diction). Further on, we refer to this node as ‘current node’.
2. Next, find which answered node resulted in this contradiction. Iterate through all previously answered nodes (further on, we refer to each of the answered nodes as ‘this answered node’).
{
If the selected finding for this answered node is not ‘Not known’
1. Retract (remove) the finding for this answered node
2. Get the belief of the current node for the selected finding 3. If this belief is not = 0
This would mean that the contradiction in current node is the result of the finding entered for this unanswered node.
4. Alert the user with this answered node details as the source for cur-rent (strong) contradiction.
5. Enter the previously selected finding for this answered node. }
This algorithm will find if the existing belief of the current node for the selected finding was zero. And further find the previously answered node that is the cause for this contradiction.
The functioning of this algorithm is illustrated in Figure 10. The screen shot of the tool is taken and made self-describing by the means of ar-rows and highlights.
Tool And Algorithms for RASTEP based on Bayesian Belief Networks
32
Tool And Algorithms for RASTEP based on Bayesian Belief Networks
33
8.2 Identify Weak Contradiction and its Source
This algorithm identifies if the current node comprises of any weak diction in the network and if so then it finds the source for such contra-diction. By weak contradiction, it is meant that the existing belief of the
current node for the selected observation is less than 20%.
8.2.1 Implementation Steps
The implementation is carried out by compiling the Bayesian network on each observation entry.
As soon as the user enters a finding for a node, before registering the finding in the network, the following steps are performed –
1. Run the algorithm only if the existing belief of the current node for selected finding is < 0.2 (the selected finding for the node had a weak contradiction before the user entered this finding)
2. Next find which answered node resulted in this contradiction Iterate through each of the previously answered nodes
{
If the selected finding for this node is not 'unknown' 1. Retract (remove) the finding for this answered node
2. Get the belief of the current node for the selected finding 3. If this belief > 0.2
This would mean that the weak contradiction in the current
node is the result of the finding entered for this answered node.
4. Alert the user with this answered node details as the source for cur-rent (weak) contradiction.
5. Enter the previously selected finding for this answered node. }
This algorithm will find if the existing belief of the current node for the selected finding was less than a threshold (0.2 in this case). And further find the previously answered node that is the cause for this contradic-tion.
Tool And Algorithms for RASTEP based on Bayesian Belief Networks
34
The functioning of this algorithm is illustrated in Figure 10. The screen shot of the tool is taken and made self-describing by the means of ar-rows and highlights.
Tool And Algorithms for RASTEP based on Bayesian Belief Networks
35
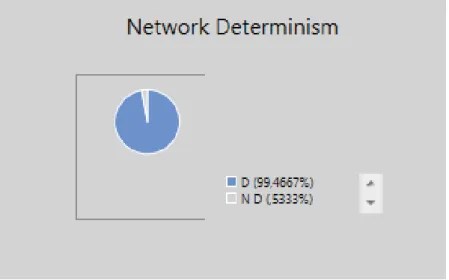
8.3 Calculate Network Determinism in Percentage
While working with a probabilistic BBN model, it is important to know the deterministic level of the nodes and the complete network. High determinism of the network will lead to stronger predictions.
This algorithm calculates the determinism percentage of the network. The minimum is 0 and maximum is the number of nodes. The percent-age of determinism is shown as the pie chart display. The chart is fixed to show the zero level as 80%. The percentage beyond 80% is represent-ed graphically. The exact percentage number can be seen in the legend. The network determinism is calculated by adding up all the node deter-minism values. The node deterdeter-minism is calculated by subtracting the minimum probability out of the maximum probability of all states (also referred as findings) of the node. Such that, for any node that is already answered, the node determinism value is 1. Since the probability for the selected finding for the node will be 1 and the remaining findings (states) of that node will have probability 0. Hence when all the nodes are an-swered, the network determinism value will be equal to the number of nodes (100% determinism).
8.3.1 Implementation Steps
1. The BBN network is compiled as soon as the user enters the finding for any node.
2. Iterate through all the answered and unanswered nodes in the net-work.
For each node {
1. Get the revised probabilities for all the states of the node
2. Update the state values (the probabilities of each state for this node) to the database
3. Get the maximum and the minimum probability values for the dif-ferent states of this node
4. Calculate the node determinism as –
Maximum probability – Minimum probability }
Tool And Algorithms for RASTEP based on Bayesian Belief Networks
36
3. Add the node determinism values for each node to obtain the net-work determinism value.
4. Let
Maximum determinism of network = X
Network determinism value (calculated above) = Y Then, Network determinism percentage = (Y/X) * 100
The network determinism shown in the tool is illustrated in Figure 11.
Tool And Algorithms for RASTEP based on Bayesian Belief Networks
37
8.4 Calculate Network Severity in Percentage
While entering the observations into the tool in case of an accident, it is helpful to get an idea about how critical is the situation in the NPP. The level of severity shows the criticality of the plant in terms of the worst case scenario. The worst case scenario is user defined. Various source term releases from the plants are assigned a ranking number. Also the release probability of each source term is calculated. The combined ef-fect of the ranking order and the release probability would determine the network severity.
This algorithm calculates the severity percentage of the radioactive re-lease in the network. For this, the tool needs to calculate the worst case severity that acts as a reference for the graphical pie chart display. Hence, the user needs to enter the worst case scenarios for each node in the tool when the model is loaded for first time. Also each source term is as-signed a rank in the order of its relative severity. The highest rank num-ber indicates the most severe source term.
8.4.1 Implementation Steps
When the user has completed entering the worst case scenarios for all the nodes, the maximum network severity is calculated as follows –
1. BBN network is compiled once all the worst case scenarios are en-tered by the user.
2. Iterate through all the source terms. For each source term
{Multiply the rank of the source term with its probability. Let us call this value as source term severity.
}
3. Add the source term severity for each source term. Let us call this value as maxNetSeverity.
4. Once the user has entered all the worst case scenarios, user is re-quired to enter the observations. After each observation entry, the network is recompiled and hence the source term probabilities are refreshed.
5. After each observation entry, steps 2 and 3 are repeated and the val-ue obtained in step 3 is called netSeverity.
6. The network severity percentage is calculated as –
Tool And Algorithms for RASTEP based on Bayesian Belief Networks
38
8.5 Identify the nodes that have the least effect on network determinism & release severity (less than 0.025 % in both cases) ("Algorithm 1" in Algorithms menu in the RASTEP tool)
For all unanswered nodes, each of the findings of the respective nodes is entered and the network is compiled. The network determinism and severity are calculated with each new finding and compared with the last network determinism and severity. If the difference is less than the varia-tion of 0.025% in both cases, then those nodes and states are listed as the nodes that have the least effect on the network determinism and release severity. Figure 12 shows the screenshot of the alert which shows the list of such nodes.
Tool And Algorithms for RASTEP based on Bayesian Belief Networks
39
8.6 Identify next node that brings the network to most de-terministic state ("Algorithm 2" in Algorithms menu in the RASTEP tool)
For each unanswered node, each of the findings of the respective nodes is entered and the network is compiled. The network determinism is calculated in each case. The node that attains the maximum determinism is highlighted. Figure 13 shows the screen shot of the highlighted node. The state that should be selected for this node is shown in a message box. This is illustrated in Figure 14
Figure 13: Node (highlighted in yellow) that brings the network to most deterministic state
Tool And Algorithms for RASTEP based on Bayesian Belief Networks
40
Figure 14: Message box showing the state for the highlighted node shown in Figure 13. This state for the node brings the network to the most deterministic state
Tool And Algorithms for RASTEP based on Bayesian Belief Networks
41
8.7 Identify next two nodes for most severe release ("Algo-rithm 3" in Algo("Algo-rithms menu in the RASTEP tool)
For each unanswered node, each of the observations of the respective nodes is entered and the network is compiled.
After each observation entry in the above step, for each unanswered node, each of the observations of the respective nodes is entered and the network is compiled. Thereafter the severity of the network is calculated. This is calculated in two levels. This algorithm lists the next two steps in the network that will bring it to the most severe state. The two nodes are highlighted in the node list is the left panel in yellow and marked with the order 1 and 2. This is illustrated in Figure 15. The states that should be answered for these nodes are shown in a message box. The states are listed with respect to the ordered nodes 1 and 2. This is illustrated in Figure 16.
Figure 15: The next two nodes that bring the network to most severe state. The nodes are highlighted in yellow and marked with the order 1 and 2
Tool And Algorithms for RASTEP based on Bayesian Belief Networks
42
Figure 16: The states for the two highlighted nodes (shown as highlighted in Figure 15) that bring the network to the most severe state
Tool And Algorithms for RASTEP based on Bayesian Belief Networks
43
9. EVALUATION OF ALGORITHMS
The algorithms that are described above were evaluated by Frida Hans-son from Lloyd's Register Consulting who is familiar with the BBNs for the RASTEP project. Her comments are highlighted in blue.
9.1 Identify Strong Contradiction (Parallel)
Once the user starts entering the observations, the tool should be able to identify if there are any contradictory observations entered in the past. There could be a 100% contradiction or less. This algorithm focuses on 100% contradictions.
Evaluation Criteria –
How much surprising or obvious was it to know the contradicting node? Contradictions Surprising Not Very
Surprising Good to know Obvious Comment Contradiction 1, PC_O2 X X For me this is very obvious due to the way the BBN is built. Contradiction 2, H_LDW X X Not sur-prising, since it is clear in the BBN. Contradiction 3, CONT_sprays X X Not sur-prising, since it is clear in the BBN.
Tool And Algorithms for RASTEP based on Bayesian Belief Networks
44
9.2 Identify Weak Contradiction (Parallel)
Evaluation Criteria –
This algorithm is evaluated to see the impact of answering a node with a weak contradiction, on the network determinism. When a node is an-swered, and it is identified that this node and observation has a weak contradiction in the previous answers, it is possible that this may reduce the overall network determinism. To understand this better, we can make the following observations -
Nodes CP_T H_ECCS H2_conc AFW
Reduction in Network
De-terminism Percentage 2.0 0.0
Increase in Network
De-terminism Percentage 1.1 0.0 0.1
Table 2: Evaluation for Algorithm 2, Impact on determinism
How surprising/obvious was this information?
Contradic-tions Surpris-ing Not Very Surpris-ing Good to know Obvi-ous Comments Contradiction 1, CP_T X X Contradiction 2, H_ECCS X X
The reason I put surprising is that the probabilities in the node are in the
range 12-21 for the lowest values Contradiction
3, H2_conc X X
Contradiction
4, AFW X X
Tool And Algorithms for RASTEP based on Bayesian Belief Networks
45
9.3 Calculate Network Determinism in Percentage (Parallel)
The evaluation has been performed as follows:
In this task I did three scenarios with different observations. Then, one at the time, I entered observations for the nodes in the table. When I had entered an observation and noted the percentage I put "not known" for the node and continued with the next node.
Evaluation Criteria –
This evaluation is done to analyze the variations of the determinism per-centage of the network as the nodes are answered. This change in deter-minism percentage can be measured for various scenarios of the net-work.
Power
operation PC_O2 LOOP_STAT US RHR_32 2 MAN SYS Determinism Percentage for Scenario 1 (no other observations) 90.0038 90.0038 92.029 5 88.5734 91.5323 90.0705 Determinism Percentage for Scenario 2 (RHR_X, H2_conc, DP_line) 95.1964 95.1964 94.498 2 84.367 96.6352 95.263 Determinism Percentage for Scenario 3 (SYS_AAA_ OP, PS) 89.9063 89.9063 93.873 5 91.4108 91.5511 89.973
Table 4: Evaluation for Algorithm 3
Thus there can be seen a pattern in the decrease of the network
deter-.
Tool And Algorithms for RASTEP based on Bayesian Belief Networks
46
9.4 Calculate Network Severity in Percentage (Parallel)
Evaluation Criteria –
This evaluation is carried out to analyze the relation between the severity percentage and the source terms. Source terms are categorized in the source term window based on their probability calculation–
Red – High Probability
Dark Pink – Medium Probability Light Pink – Low Probability Black – Zero Probability Severity
Percentage Number of High Prob-ability Source terms Number of Medium Probability Source terms Number of Low Proba-bility Source terms Number of Zero Prob-ability Source terms 18.0 9 0 0 8 17.5 8 0 0 9 46.5 5 0 0 12 69.9 4 0 0 13 55.4 5 0 1 11
Table 5: Evaluation for Algorithm 4
From the above observations, it can be seen that high severity percent-age corresponds to less number of high probability source terms. It can be concluded that less number of highly critical source terms can result is a more critical situation.
Tool And Algorithms for RASTEP based on Bayesian Belief Networks
47
9.5 Identify the nodes that have the least effect on network determinism & release severity (less than 0.025 % in both cases) ("Algorithm 1" in Algorithms menu)
Evaluation Criteria –
This evaluation was carried out to see if the indicated nodes were irrele-vant for the tested scenario?
Nodes Highly
Irrel-evant Quite Irrel-evant Not so Irrel-evant Quite Rel-evant
No nodes
observed X
The 2 first
observed X
3 observed X
I am not sure that this information is actually very interesting. If just a few observations are made, the algorithm will probably give a large amount of nodes/states as output. And the user can actually not do very
much with that information …
Table 6: Evaluation for Algorithm 5
I will comment this task/algorithm in two perspectives:
BBN builder: As a creator of a network I believe this information will be good to know in order to make sure that the BBN is correctly built ac-cording to my view of the system that the BBN should represent.
Operator: When I used it with no observations, there were a lot of nodes in the output, and not very interesting information. The more observa-tions I put in there, of course, the less nodes in the output. However, I am not sure that this information is very valuable for an operator, in a possibly very stressful situation. On the other hand, let's say that the operator is uncertain about a state, maybe 80% sure. If that state is in-cluded in that list, the operator would probably "dare" to enter the ob-servation, since it actually doesn't make a big difference for the severity.
Tool And Algorithms for RASTEP based on Bayesian Belief Networks
48
9.6 Identify next node that brings the network to most de-terministic state ("Algorithm 2" in Algorithms menu)
Evaluation Criteria –
This evaluation was carried out to know how useful (surprising) was it to know the node that would bring the network to the most deterministic state.
Runs Very
sur-prising Not Very Surprising Good to know Obvious
Run 1 X X
Run 2 X X
Table 7: Evaluation for Algorithm 6, usefulness of information
How would you consider the processing time of the algorithm? Runs Very long time & would
not like to run again! Long time but would still be okay Not so long Quick Run 1 X Run 2 X
Table 8: Evaluation for Algorithm 6, processing time
BBN builder: For a BBN builder it is a way to make sure that the BBN works as it is supposed to.
Operator: For an operator it is valuable to quickly receive information about which nodes that bring the network to a more deterministic state.
Tool And Algorithms for RASTEP based on Bayesian Belief Networks
49
9.7 Identify next two nodes for most severe release ("Algo-rithm 3" in Algo("Algo-rithms menu)
Evaluation Criteria –
This evaluation was carried out to know how useful (surprising) was it to know the listed two nodes that would bring the network to the most severe state.
Runs Very
sur-prising Not Very Surprising Good to know Obvious
For all
runs X X
Table 9: Evaluation for Algorithm 7, usefulness of information
How would you consider the processing time of the algorithm? Runs Very long time &
would not like to run again!
Long time but would still be okay
Not so
long Quick
Run 1, 2
observations X, almost 4 minutes Run 2, 4 observations X, 3 minutes Run 3, 6 observations X, 2.5 minutes Run 4, 8 observation X, 2 minutes Run 5, 10 observations X, 1.5 minute Run 6, 12 observations X, 1 minute Run 7, 14 observations X, < 1 minute
Tool And Algorithms for RASTEP based on Bayesian Belief Networks 50 Run 8, 16 observations X, 45 seconds Run 9, 18 observations seconds X, 30 Run 10, 20 observations seconds X, 20 Run 11, 22 observations seconds X, 10 Run 12, 24 observations seconds X, 5 Run 13, 26 observations seconds X, < 5
Table 10: Evaluation for Algorithm 7, processing time
Firstly, the algorithm was quite slow and it became faster the more ob-servations I put in. With 2 obob-servations, it took about 4 minutes. If an operator is in a stressful situation this might be too long.
Secondly, again let's say that the operator is uncertain about a state. If that state is one of the two in the output, the operator should think twice before entering an observation he is not sure of.