TRITA-LWR Degree Project 13:08
M
ODELLING
T
HE
E
MERGING
P
OLLUTANT
D
ICLOFENAC
W
ITH
T
HE
GREAT-ER
M
ODEL
:
A
PPLICATION
T
O
T
HE
L
LOBREGAT
R
IVER
B
ASIN
Joana Aldekoa
© Joana Aldekoa 2013
This is a degree project at the master’s level done in association with the department of Land and Water Resources at the Royal Institute of Technology, Stockholm, Sweden, and in asso-ciation with the Research Group of Hydrological and Environmental Modelling at the Poly-technic University of Valencia, Spain.
Department of Land and Water Resources Engineering Royal Institute of Technology (KTH)
SE-100 44 STOCKHOLM, Sweden
Reference should be written as: Aldekoa, J. (2013) “Modelling the emerging pollutant di-clofenac with the GREAT-ER model: application to the Llobregat River Basin” TRITA-LWR Degree Project 13:08
S
UMMARYI
NE
NGLISHThis Master Thesis, firstly, gives a general overview of occurrence of emerging pollut-ants in river water. A deeper study has been made for the emerging contaminant di-clofenac and its behaviour, from consumption to natural degradation and effects. In order to predict the fate of diclofenac in a real catchment area main characteristics of Llobregat River Basin in Spain have been described.
Data gathering, about the pharmaceutical diclofenac and hydrologic aspects of the catchment, were one of the most laborious works, as it is explained along the thesis. GREAT-ER has been the chosen model to simulate diclofenac occurrence in Llobre-gat River. Since its use is very limited worldwide, a full explanation about GREAT-ER geo-referenced aquatic exposure assessment model is included in this report: program methodology, main concepts, input files and simulation approach.
Simulation approach involved defining different scenarios and a calibration process which is specified in this paper. The results of this process and the derivate discussion mainly conclude in the future possible viability of the model.
This Master Thesis is addressed to researchers involved in water risk assessment as well as to people who work with water modelling systems. However, it is also in-tended to reach people interested in learning about emerging contaminants, its effects and a methodology to combat them: modelling.
S
UMMARYI
NS
WEDISHDetta examensarbete ger först en generell översikt av gifter i vattendrag som ökar i förekomst. En djupare undersökning är gjord för den ökande föroreningen diclofenac, och dess påverkan från konsumtion till nedbrytning i naturen. För att förutse vägen för diclofenac i ett verkligt upptagningsområde har huvudegenskaperna från upptagningsområdet Llobregat i Spanien beskrivits.
Informationsinsamling av läkemedels-diclofenac och hydrologiska data från upptagningsområdet har varit bland de mer arbetskärvande uppgifterna, vilket förklaras i arbetet.
GREAT-ER har används som modell för att simulera förekomsten av diclofenac i vattnet i Llobregat-floden. Eftersom modellens användning är mycket begränsad världen över finns en fullständig beskrivning av GREAT-ER georefereras vattenlevande exponeringsbedömning modell i rapporten, med huvudbegrepp, in-filer och simuleringsmetod.
Simuleringsmetoden berör fastställande av olika scenarion och kalibreringsprocessen som användes i arbetet. Resultaten av denna process och följande diskussion fastställer främst framtida möjligheter för modellen.
Detta examensarbete är riktat till forskare inom riskbedömning för vattenflöden och personer som arbetar inom modellering av vattensystem. Det är även tänkt att nå personer intresserade av att lära sig om dessa gifter som ökar i förekomst, med dess påverkan och metoder för att bekämpa dem.
S
UMMARYI
NS
PANISHEste Proyecto Final de Carrera, en primer lugar, ofrece una visión general de los con-taminantes emergentes en aguas de ríos y el conflicto que supone. Además, se profun-diza en el conocimiento del comportamiento del contaminante diclofenaco, desde su consumo a través del fármaco Voltaren, hasta su degradación natural y sus efectos en el medio ambiente. Es objeto de este PFC estudiar la presencia de esta substancia química en la cuenca del Llobregat, situada en el noroeste de España.
El trabajo de investigación sobre el diclofenaco y sobre las características hidrológicas de la cuenca ha resultado ser una de las tareas más complicadas, debido a su escasez y falta de fiabilidad.
GREAT-ER ha sido el modelo elegido para simular la presencia del diclofenaco en la cuenca del Llobregat. El uso de este geo-referenciado programa de evaluación de ries-go en ríos, no es conocido de forma global. Por este motivo, se ha procedido con un estudio profundo del funcionamiento del programa, con el objetivo de conocer su ge-neración de archivos de entrada y los principios de simulación entre otros.
El proceso de simulación implica la consideración de diferentes escenarios y la calibra-ción de parámetros, lo que dará lugar a ciertos resultados que se incluyen en el presen-te informe. Todo ello contribuye a la evaluación del modelo como posible herramienta para predecir concentraciones de contaminantes emergentes a escala de cuenca. El PFC está dirigido a investigadores involucrados en el campo de calidad de aguas y gestión de recursos hídricos, así como a personas que trabajen con diversos modelos de sistemas de agua. Del mismo modo, este proyecto se quiere hacer llegar a todo aquél interesado en aprender acerca de los contaminantes emergentes, su comporta-miento y efectos en el medio ambiente, y la metodología para hacerles frente.
A
CKNOWLEDGEMENTSI would like to kindly thank my supervisor, Vladimir Cvetkovic, Department of Land and Water Resources Engineering, for all the advice given during the entire period of this Master’s Thesis.
I would like to express my sincere gratitude to my supervisors at the Polytechnic Uni-versity of Valencia (Spain), Chiara Medici and Félix Francés, who supported and guided me even when I was working in Sweden. They offered me their help for any technical aspect or language writing issue.
Another person to whom I would also like to extend my gratitude is Victoria Osorio, who provided the sampling data of the field campaigns in the Llobregat Catchment. Without this information the model could not be calibrated and, consequently, the ob-tained results would not have the same value and reliability.
Finally, I would love to thank Johan Dahlqvist for his help with the Swedish Sum-mary, which he provided immediately.
T
ABLE OFC
ONTENTSSummary In English iii
Summary In Swedish v
Summary In Spanish vii
Acknowledgements ix Table of Contents xi Abstract 1 1. Introduction 1 2. Methods 2 2.1. Study Area 2 2.2. Data Collection 3
2.3. Emerging Contaminant Diclofenac 4
2.3.1. Consumption 4
2.3.2. Excretion patterns 5
2.3.3. WWTP removal efficiency 5
2.3.4. Biodegradation and sorption in rivers 7
2.3.5. Biodegradation and sorption in soils 8
2.3.6. Environmental effects 8
2.4. GREAT-ER Model 9
2.4.1. Methodology and model concepts 9
2.4.2. Inputs 10 2.4.3. Stochastic model 11 2.4.4. Scenarios 12 2.4.5. Calibration 13 3. Results 13 3.1. Calibrated Parameters 18 3.2. Model Tendency 18 4. Discussion 18 4.1. Uncontrolled Discharges 19
4.2. Deterministic or Stochastic Approach 19
4.3. Calibrated Parameters 19
4.4. Lake Model 20
5. Conclusion 21
References 22
Appendix I – Results: concentration tables, RMSE, Csim/Cmeas factor,
emission, K (For each scenario’s best result) I
Appendix II – Consumption: data and estimations IV
Appendix III – Lake model: HRT estimation VII
Appendix IV – Velocity formula IX
Appendix V – Stretches, flow and velocity distribution in the Llobregat
A
BSTRACTWater from the Llobregat is used to supply a significant part of the city of Barcelona. At the same time, 60 wastewater treatment plants discharge into this basin. Two field campaigns conducted in the Llobregat Catchment detected more than 80 pharmaceu-ticals in the water. Therefore, it is clear that water quality in Llobregat is a potential concern. A GIS hydrology water quality model has been applied in order to predict the concentrations of one of the pharmaceuticals, diclofenac, in the catchment. Con-sumption, excretion, and degradation data has been studied to calibrate the model. This exercise proves that it is relatively straightforward to predict the concentrations of new and emerging contaminants at basin scale. Nonetheless, the limited and inac-curate available data was a relevant obstacle in this modelling process.
Key words: Diclofenac; Llobregat; Predicted concentrations; GREAT-ER; Emerging Contaminants degradation
1. I
NTRODUCTIONFresh-water pollution due to so-called Emerging Contaminants (ECs) started to receive attention only quite recently. In fact, this kind of con-tamination was not studied until around 1990; and was not recognized as a significant source of uncontrolled pollution. Nevertheless, the ECs may have a considerable negative impact on the environment and human health. ECs are used every day in our homes, on farms and in industry, and in products such as detergents, fragrances, prescription and non-prescription drugs, disinfectants and pesticides. After human activity and consumption they finally reach the environment through sewage water, by way of excretion or deliberate disposal.
Since these new contaminants have been studied just for the last two decades, the information about these compounds is very limited and un-certain. Therefore, it is fundamental to localize and control areas with potential environmental risk. To this end, mathematical modelling of a catchment area represents a useful tool to help supervising spatial and temporal distribution of ECs. The modelling approach aims to predict chemical concentrations in rivers, in particular during future events, and to obtain further knowledge of their behaviour.
The purpose of this work is to implement the model GREAT-ER for the Llobregat River Catchment, which is affected by large human activ-ity, in order to study the effect and behaviour of the emerging contami-nant diclofenac. Diclofenac is a commonly used non-steroidal anti-inflammatory drug and is part of the EC group called Pharmaceuticals and Personal Care Products.
A literature review does not suggest too many models to predict the fate of emerging pollutants. Buser et al. (1988) used the GCSOLAR program from the U.S. EPA, which computes direct photolysis rates and half-lives of pollutants in the aquatic environment, in order to predict the occur-rence of the diclofenac drug. However, more modelling studies have been found that utilised the geo-referenced environmental risk assess-ment tool GREAT-ER (Whelan et al, 1999; Schowanek and Webb 2000; Johnson et al, 2007; Ort et al, 2009; Alder et al, 2010).
According to different authors GREAT-ER is a simple model but is able to provide valuable information for aquatic exposure assessment (Alder et al, 2010) and is able to explore the potential influence of river dis-charge, flow velocity, source variability and in-stream decay rate on river water quality (Whelan et al, 1999). Based on initial simulations, it can be
observed that not all exposure scenarios can be captured with the GREAT-ER model (Schowanek and Webb 2000; Ort et al, 2009). None-theless, even more complex water quality programs, accounting for deg-radation processes in a detailed mechanistic way, are unlikely to provide better results due to the lack of detailed, geo-referenced input informa-tion on industry, illegal discharges or unknown high temporal variainforma-tion of consumption in a particular catchment (Whelan et al, 1999; Ort et al, 2009). Thus, a better achievement of local catchment information, waste water treatment plants´ practices, current diclofenac consumption and behaviour data would refine input data and surely improve model results (Schowanek and Webb 2000; Johnson et al, 2007).
2. M
ETHODSThese sections aims to describe model determinants, that is, the study area which has been implemented in the model, the Llobregat River Ba-sin, the substance which has been studied and simulated, diclofenac, and the model itself, GREAT-ER.
2.1.
Study Area
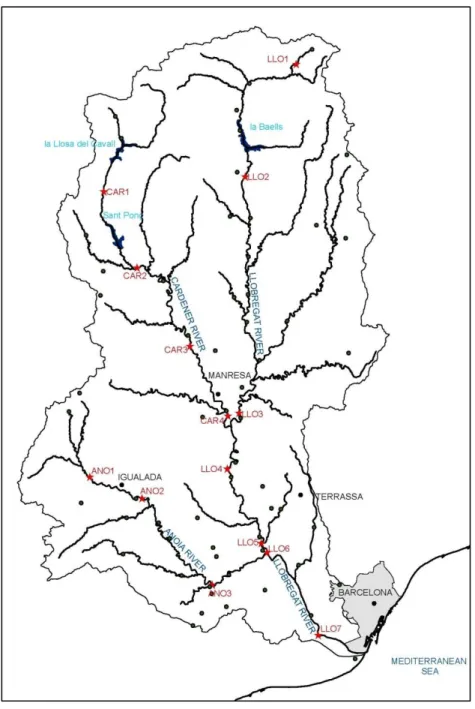
The Llobregat Catchment is located in Catalonia (Spain), northeast of the Iberian Peninsula (Fig. 1). The catchment area covers approximately 5000 km2. The Llobregat River length is about 160 km and discharges
into the Mediterranean Sea. Its hydrology is characterized by a highly variable flow, which is strongly influenced by seasonal rainfall. The mean annual bulk precipitation is 3330 ·106 m3 and it has an annual average
bulk discharge of 693 ·106 m3. Its watershed is densely populated, with more than 3 million inhabitants living therein. Together with its two main tributaries, the River Cardener and the River Anoia, the Llobregat is subjected to a heavy anthropogenic pressure (Osorio et al, 2012). More than half of the population is situated close to the coast, which is the lower area of the catchment.
Water from Llobregat is used to supply water to a significant part of the city of Barcelona. A mean value of 7.3 ·106 m3 per month of superficial
water is demanded for Sant Joan Despí drinking water treatment plant (the biggest of Catalonia). At the same time, 60 wastewater treatment plants discharge in this basin. Therefore, water quality is a potential con-cern in this catchment.
2.2.
Data Collection
In order to model the Llobregat Catchment, different data was required. Firstly, daily flow levels were gathered from 14 control points and entry and exit flows from the three reservoirs, in order to estimate hydrological variables. The source of this data comes from the Catalan Water Agency (ACA). It is important to note that 6 out of 14 control points stopped working from September 2010 to September 2011.
Secondly, data of waste water treatment plant discharges and water sup-plying extractions was collected, from the Hydraulic and Environmental Department at the Polytechnic University of Valencia, to determine the contaminant input and output amount and location.
Figure 2. Llobregat Catchment area. Location of 14 sampling points (red stars) and WWTPs (green points).
Finally, some field data is provided in order to validate the model. In the Llobregat River two field campaigns were conducted to detect several chemicals, on September 22, 2010 and September 13, 2011. In 14 points of the catchment (Fig. 2)diclofenac concentration was measured, among other pharmaceuticals. These two field campaigns were undertaken for the SCARCE international research project, with the objective to assess and predict the effects on water quantity and quality in Iberian rivers caused by global change.
2.3.
Emerging Contaminant Diclofenac
Diclofenac (2-(2-(2,6-dichlorophenylamino)phenyl)acetic acid) is a widely used non-steroidal anti-inflammatory drug (NSAID). It is generally used as an analgesic to reduce pain and to treat inflammatory disorders, espe-cially arthritis and rheumatism. Diclofenac is mostly available as sodium or potassium salt in the United Kingdom, India, Brazil, the United States and many other countries. In Spain it is mainly used in Voltaren medical products, such as sodium salt (Buser et al, 1998).
Data on diclofenac found in the literature about its biodegradation be-haviour, effects in the natural environment and consumption patterns is quite varied and imprecise. Nonetheless, the following sections summa-rise the main properties of diclofenac utilised in this project.
2.3.1. Consumption
A few years ago the worldwide annual consumption of pharmaceuticals was 15 g per capita; in developed countries this amount was three to ten times higher, that is, 50-150 g (Pal et al, 2010). Moreover, as a result of the increasing average age of the population and the tendency of the human genome, drug use is expected to grow (Jones et al, 2005) in the near future.
Diclofenac is one of these pharmaceuticals which is consumed world-wide. The human administration method varies between tablets, cap-sules, suppositories, intravenous solutions, and ointments and gels for dermal application (Buser et al, 1998). It is estimated that 940 tons of this anti-inflammatory drug are consumed annually all over the world (Al-Rajab et al, 2010).
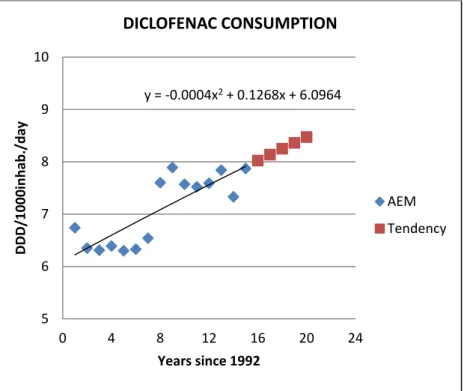
Despite the estimations suggesting that diclofenac’s impact on the envi-ronment are probably worth studying due to its significant consumption, very little data exists about diclofenac local consumption in Spain in or-der to estimate specific consumption in the area of interest for this pro-ject. The only published report from the Spanish Ministry of Health about non-steroidal anti-inflammatory drugs estimates the use of di-clofenac in the whole country in 2006 (7.87 DDD/1000 inhab./day) (Spanish Agency of Medicaments and Sanitary Products, 2007).
2.3.2. Excretion patterns
After administration, diclofenac is excreted by humans and discharged into the sewage system, as with all pharmaceuticals and personal care products. This excretion occurs after the drugs are partially or com-pletely metabolised by the human body. As a result, unchanged and con-jugated compounds are released through urine and faeces (Carballa et al, 2008).
According to several studies, the elimination of 90% of diclofenac hap-pens 3 or 4 hours after its consumption. Moreover, the pattern of me-tabolites and excretion is independent of the method of administration. Several conjugated forms derive from diclofenac, and the most signifi-cant one is 4-hydroxydiclofenac. 40-50% of the excreted dose from urine and bile comes in this conjugated form (Johnson et al, 2007). This means that just a fraction (probably under 50%) of the consumed diclofenac ar-rives to the waste water treatment plants in its unchanged form. The model suggested in this work aims to predict the diclofenac parent com-pound; therefore, it will not foresee its conjugated forms. Different lit-erature sources have been consulted to obtain an interval for diclofenac excretion rates values (Table 1). As a result, diclofenac excretion rates for its unchanged form vary between 1% and 39%.
2.3.3. WWTP removal efficiency
The pharmaceuticals that are released from humans reach waste water treatment plants (WWTPs) through sewers. Biodegradation of most drugs takes place in these WWTPs before they arrive into the river. In addition, compounds transformation and degradation may also occur during in-pipe transportation to WWTPs. However, as conditions in sewers in terms of residence time, temperature, solids content and aera-tion are not favourable for biodegradaaera-tion (Carballa et al, 2008), trans-port through sewers will not be considered as a relevant cause of elimi-nation of diclofenac.
Once diclofenac is exposed to sewage plants’ treatments, it will be af-fected by sorption, volatilization and degradation processes. Biodegrada-tion will mainly develop in the secondary treatment stage, as a conse-quence of large concentrations of microorganisms. Nevertheless, due to the significant amounts of the β-glucuridase enzyme, it is probable that gluconoride and sulphate conjugates of drug compounds are deconju-gated in some treatments (Jones et al, 2005).
The efficiency of WWTPs to eliminate drugs depends on physicochemi-cal properties and on the specific treatments of each plant. Therefore, diclofenac’s aqueous solubility, volatility, lipophilicity and other proper-ties will affect this process (Carballa et al, 2008). Several studies and laboratory practices reveal that diclofenac’s molecule is moderately bio-degradable, but weakly sorptive (Johnson et al, 2007).
Table 1. Diclofenac excretion rates, for its unchanged and conju-gated form, from literature. n.d.: no data.
Authors Unchanged diclofenac Conjugated
M. Carballa et al., 2008 1-15% 1-60% D. Bendz et al., 2005 15% <1% A. C. Johnson et al., 2007 7.50% n.d. J. Lienert et al., 2007 6-26% 45-85% H. T. Scheneider et al, 1990 12.66% 22.07% T. L. Laak et al, 2010 6-26% n.d. A. Pal et al., 2010 6-39% n.d.
Treatment processes at WWTPs will have different influence on the deg-radation of drug compounds. For instance, biological treatments can provide the double removal percentage of diclofenac than a primary sedimentation tank. At the same time, the efficiency of activated sludge plants improves if nitrogen treatments are included. Some research stud-ies also suggest that the removal increases with higher influent concen-trations to the plant (Miege et al, 2009). According to other studies, a pi-lot ozonation, UV-disinfection and activated carbon treatments could remove a significant fraction (95%) of diclofenac and other pharmaceu-ticals (Jones et al, 2005; Ort et al, 2009). On the other hand, biological filters may eliminate less than 9% (Johnson et al, 2007).
Due to the multiple factors that influence the degradation of diclofenac in WWTPs, literature values are rather variable. Despite the fact that most authors indicate poor removal efficiency in conventional sewage treatments, numeric values imply low and high rates. Different data col-lected from literature is gathered in table 2.
Table 2. WWTP removal efficiency for diclofenac from literature.
Authors Removal % A. C. Johnson et al., 2007 0-75 J. Lienert et al., 2007 <6 D. Bendz et al., 2005 17-69 C. Miege et al., 2009 32 T. Heberer, 2002 17 C. Ort et al., 2009 25
2.3.4. Biodegradation and sorption in rivers
The available data for diclofenac’s behaviour in river water is very vari-able. On the one hand, some authors suggest that diclofenac is affected by potential transformation processes and in consequence it will be mostly declined (Bendz et al, 2005); on the other hand, others define di-clofenac as a conservative solute (Johnson et al, 2007).
In general, researchers agree on little sorption capacity for diclofenac, which at the same time implies a negligible adsorption onto lake sedi-ments (Buser et al, 1998; Kunkel and Radke, 2011). Despite the fact that sorption capacity is a function of the sediment type, some models calcu-late a rate constant (day-1) for sedimentation of 0.005 (Tixier et al, 2003;
Jiskra, 2008).
In several studies, photodegradation and biodegradation have been found to be the main reason of diclofenac removal in environmental wa-ters. Nevertheless, biodegradation is directly connected to sewage efflu-ents. As a result, it mostly appears in waste water treatment plants. How-ever, diclofenac’s biodegradation has a quite variable response in river water (Jiskra, 2008). Some laboratory studies estimate a degradation con-stant of about 0.004-0.006 day-1 (Buser et al, 1998; Tixier et al, 2003);
therefore, diclofenac degradation would only be appreciable in rivers with very long residence time (Johnson et al, 2007).
According to laboratory and incubation experiments and field studies, diclofenac has a clear tendency to be affected by photochemical degrada-tion (Buser et al, 1998; Tixier et al, 2003; Kunkel and Radke, 2011). Nonetheless, this process has a different impact depending on the season of the year, geographic latitude, weather and depth into the water (Jiskra, 2008).
Buser et al. (1998) did a thorough study of diclofenac photodegradation capacity in lakes. The field study, where more than 90% of diclofenac was degraded in the lake, suggested an elimination rate between 0.022 and 0.081 day-1, for winter and summer, respectively. A modelling
calcu-lation was also made, where photodegradation rates varied from 0.006 to 0.14 day-1, with an annual average of 0.068 day-1 (Buser et al, 1998).
Other research studies estimated a phototransformation rate of about 0.082 day-1 (Tixier et al, 2003). As mentioned, the depth considered can
affect elimination values. In some experiments 97% decomposition was detected at 50 cm depth, whereas the decomposition at 1 m depth was just 30% (Jiskra, 2008).
Table 3. K degradation constant (day-1) for diclofenac. Minimum
value, maximum value and average, on every process.
K (d-1) Min. Value Max. Value Average
Photodegradation 0.006 0.14 0.068
Biodegradation 0.004 0.01 0.006
Sedimentation 0.005 0.005 0.005
Despite photodegradation being a relevant process in lakes, its effects in rivers are harder to appreciate. As a result of a tracer test done in a river, diclofenac was not attenuated (Kunkel and Radke, 2011). The lack of this photolysis effectiveness could be attributed to the high turbidity of the river water, to the low exposure to sunlight, to the cloudy weather during the experiment and to the low residence time of the drug in the river. Therefore, photodegradation is the most important process which affects diclofenac; however, its effectiveness will vary in every situation and can diminish enough to get no response in rivers.
Taking into account all data found in literature, table 3 shows the value intervals considered in this work to represent the degradation rate of di-clofenac in environmental water.
2.3.5. Biodegradation and sorption in soils
The degradation of diclofenac has mostly been studied in river water. However, water is also taken from rivers to irrigate lands. As a conse-quence, some research studies of diclofenac degradation in soils have also been carried out.
Soil laboratory studies have concluded that with high temperatures, the presence of microorganisms, aerobic conditions and unsaturated water conditions, the degradation rate for diclofenac is between 0.0234 and 0.2236 d-1 (Al-Rajab et al, 2010; Lin and Gan, 2011). These are relatively
high values considering the estimated rates for diclofenac degradation in river water. In addition, generally most irrigation water becomes groundwater.
These assumptions suggest that very little diclofenac will return to river water. Therefore, there is no relevant need to consider a new disperse source of diclofenec in the model provided in this work.
2.3.6. Environmental effects
Pharmaceuticals, after transportation through the sewage system and natural water, interact with environment biota. This interaction may vary for every drug compound and for every environmental condition. Sev-eral studies have been carried out to determinate some of the effects caused by the pharmaceuticals and personal care products in the natural environment.
According to some authors, non-polar compounds can be accumulated in fish and other aquatic biota, in sediments or in sewage sludge (Heberer, 2002). The most susceptible species to pharmaceuticals in wa-ter seems to be daphnids and wawa-ter fleas, followed by fish and algae. Sex hormones might provoke adverse impacts, such as feminization (Lin and Gan, 2011); therefore, great concern is focused on estrogen and andro-gen hormones (Pal et al, 2010). However, many pharmaceuticals also generate a potential concern, as a consequence of their emerging impact on nature.
Different environmental impacts of the diclofenac drug have been found through research studies in the last decade. Diclofenac causes some tox-icity to birds and alterations in the composition of river biofilm commu-nities (Al-Rajab et al, 2010), as well as sub-lethal effects on daphnids and fish embryos (Scheneider et al, 1990). This drug compound seems to ap-pear potentially phytotoxic only in concentrations that are not occurring in nature; however, its photodegradation products may present five to six times higher toxicity (Jiskra, 2008). In addition, it is not a less relevant fact that water is collected from rivers to supply drinking water for hu-mans, while at the same time this water might contain diclofenac, among other pharmaceuticals. Some years ago diclofenac was identified (under
10 ng/l) in a private drinking water tap in Berlin-Zehlendorf (Heberer, 2002). Hence, diclofenac consumption could also affect human health.
2.4.
GREAT-ER Model
The GREAT-ER (Geo-referenced Regional Exposure Assessment Tool for European Rivers) system is an aquatic exposure prediction tool for ‘down-the-drain’ chemicals within environmental risk assessment schemes (Boeije et al, 1997; Schowanek and Webb 2000). It was devel-oped and validated by ECETOC (European Centre for Ecotoxicology and Toxicology of Chemicals) (Schowanek and Webb 2000) in 1997. The GREAT-ER model structure is deterministic and stationary. How-ever, variability and parameter uncertainty can be considered applying the Monte Carlo approach.
Several studies have been undertaken with this model worldwide (e.g.: UK, Switzerland, Germany, Turkey, China and Australia). Even if its use is not widespread in Spain, a few studies have already been made with the GREAT-ER model in the Llobregat Basin.
2.4.1. Methodology and model concepts
The GREAT-ER structure is basically composed of discharge points and river stretches (Fig. 3).
Discharges represent waste water treatment plants, which are the input of chemical contaminants into the river network. Through these points the contaminant flux is introduced as mass per time.
Every river stretch is modelled by its start and end point (according to water current direction). The start point receives the chemical flux of the upstream stretch or stretches and the discharge mass of a WWTP if it ex-ists. Between the start and end point of the stretch a decay model is ap-plied, by a first-order in-stream removal and in accordance with the de-fined substance properties. Through this method the output of the stretch is calculated, which is the input for the next downstream stretch. As a result, the chemical mass is transported through river stretches down to the drainage point of the basin.
The GREAT-ER model provides three simulation modes depending on the level of complexity required. This way, more specific processes can be simulated in WWTPs and rivers, involving substance degradation. In this project, the first mode has been used for the modelling of the Llo-bregat Catchment, due to the lack of available data needed in higher complexity modes.
First-mode simulates the removal efficiency of waste-water treatments applying an overall removal rate. Degradation in rivers is calculated with the following equation in every river stretch:
Rriver=1-e-HRT*K
Where Rriver is the removal rate corresponding to the specific stretch, K
is the degradation constant of the chemical contaminant (h-1), and HRT
is the travel time in the stretch (h) calculated as HRT=L/v/3600, with length (m) and velocity (m/s).
GREAT-ER can also model lakes with the same first-order removal, but travel time is calculated as HRT= V/Q/3600, with volume (m3) and
Figure 4. GREAT-ER model layout for the Llobregat Catchment. Red points represent discharge points: WWTPs. Different colours at river stretches indicate concentration levels.
Once the mass per time charge has been simulated through the entire river network, GREAT-ER calculates concentrations with the water flow of each stretch. Consequently, the model gives the final result of the concentrations in the start and end points of every stretch. Figure 4 shows the layout of the GREAT-ER model with the resulting concentra-tions through the entire river network.
GREAT-ER models the input of chemical mass to river water. Never-theless, the reductions of chemical mass from the river due to extrac-tions of supplying water (drinking or irrigation water) are not modelled. Therefore, with the aim of simulating extractions for main water de-mands in the catchment, new river stretches were introduced at the ex-traction points. These artificial stretches can be identified outside the catchment (Fig. 3). This method allows representing the loss of chemical mass in these artificial bifurcation points.
2.4.2. Inputs
The GREAT-ER model requires seven input (text) files.
Digital River Network
The entire river network is divided into stretches, taking into account bi-furcations, confluences, discharge points and sampling points. Each stretch is identified by a number, ordered according to water current.
This file contains the geographic coordinates of the points that deter-mine the river network, gathered into stretches by their identification numbers. The spatial points in this file will generate the spatial distribu-tion of the river in the model.
River Network Attributes
Properties of every river stretch are defined within this file: stretch iden-tification, flow mean value, flow 5th percentile, velocity mean value,
ve-locity 5th percentile, length, depth mean value, depth 5th percentile and
name.
Discharge Site Data
Contaminants discharges are defined in this file. The discharges emanate from waste-water treatment plants. Identification, geographic coordi-nates, population, discharge flow, treatment type, discharged river stretch and names are stated.
Catchment Boundary Polygon
Geographic coordinates of the catchment boundary points (a polygon) are given.
Lakes
The stretches which are lakes are identified in this file.
Pictures
Pictures of the catchment can be included in this file.
Background
This file provides access to geographic background information.
Several tools have been used to model the Llobregat Catchment and generate its input files. ArcGIS has been an essential program to work with geographically referenced data. Using ArcGIS catchment boundary points, and river network stretches division, identification and points have been generated, along with other spatial calculations. Matlab was also required to provide a function able to order the 160 stretches of the river network, obtain the required format and other details which the model demands. Excel’s macros have also been used to calculate geo-graphic coordinates (from UTM coordinates) of more than 20.000 points.
2.4.3. Stochastic model
GREAT-ER is defined as a deterministic model with a stochastic ap-proach (Monte Carlo method) on top of it. Stochastic simulations permit one to take into account seasonality of environmental factors and pa-rameter uncertainty. Seasonality deals with environmental variations throughout the years for water flow or velocity factors. Parameter uncer-tainty deals with the difficulties to estimate model parameters, such as WWTP removal efficiency or consumption of chemical contaminants (Boeije et al, 1997).
The GREAT-ER model requires introducing the mean value and 5th
percentile of water flows and other hydrologic variables, as well as cer-tain model parameters distribution. The Monte Carlo method generates randomly discrete ‘shots’ from these input distributions. For each ‘shot’ the previously described deterministic method (2.3.1) is applied. There-fore, the model generates many concentration results as Monte Carlo outcomes. GREAT-ER defines a log-normal distribution for these con-centrations in each stretch and provides as a result its mean and standard deviation value.
2.4.4. Scenarios
Due to the existence of two field sampling campaigns and the option to apply a deterministic or stochastic model four different scenarios have been suggested.
Scenario 1
Deterministic model for first campaign (flow, velocity and consumption data of September 2010).
Scenario 2
Deterministic model for second campaign (flow, velocity and consump-tion data of September 2011).
Scenario 3
Stochastic model for first campaign (flow and velocity mean and percen-tile values from 2000 to 2012, and consumption data of September 2010).
Scenario 4
Stochastic model for second campaign (flow and velocity mean and per-centile values from 2000 to 2012, and consumption data of September 2011).
2.4.4.1. Flow and velocity calculation
Water flow and velocity in the river are the two main hydrological vari-ables which the GREAT-ER model uses for the simulation and are re-quired in the input files. Therefore, flow and velocity were estimated for every river stretch and in each scenario.
Our first aim was to represent the real or altered water flow for the days that the samples were taken (September 22, 2010 and September 13, 2011) for the deterministic models.
The available data to estimate flows were 14 river control points all over the catchment (where the flow level is measured daily) and entry and exit flows of reservoirs. Temporal data of water discharges and demands was also available. Therefore, taking into account measured levels, discharged and extracted flows from the river and the natural water contribution (by constant flow/drained area rates) flow values were estimated for every river stretch through a water balance.
Our second objective was to construct data for a stochastic model. Therefore, mean values and 5th percentile values were calculated for
most variables (flows in control points, discharges and extractions). Af-terwards, the same method as in the deterministic model was applied to estimate the flows (mean values and 5th percentile) in every stretch.
For velocity (v) calculation, an expression function of flow (Q), slope (S0) and drained area (Λ) was suggested (Appendix IV).
3 2 1 1 ) 3 2 ( ) ( ) ( 1 ) 2 1 ( 0 ) 1 )( 3 2 ()
(
1 2 1 2 2c
c
c
S
Q
FC
v
d nThis expression derives from the Manning formula and integrates several parameters (ξ, θ, ε, φ, c, and к) according to geomorphologic relations and the hydraulic geometry of the river network. Parameters were ob-tained for the Llobregat River and the correcting factor FC was cali-brated with data provided by the HEC-RAS model.
The ArgGIS tool was used to create raster layers for flow values, slope and drained area. As a result, a new layer of velocity was generated, which is a function of the previous expression. This process allowed es-timating a velocity value for every stretch.
Appendix IV shows the distribution and identification of the stretches, as well as the resulting water flow and velocity value for each stretch. 2.4.5. Calibration
The purpose of the calibration work was to adjust the model according to the measurements of field campaigns in order to make it valid. Hence, once the Llobregat Catchment was implemented some specific parame-ters were corrected through a calibration process.
The parameters of the model are: diclofenac degradation constant in na-ture (K), removal efficiency of waste water treatment plants, excretion rate by humans and diclofenac drug consumption in the affected area. Nevertheless, all these parameters, except the natural degradation con-stant, have been considered as one: diclofenac emission. WWTP removal and excretion rates are percentages that are applied to the consumption data straight away. As a result, an emission from WWTPs of mg per time is modelled.
In conclusion, the aim of this calibration work was to adjust the values of two parameters: K (natural degradation constant) and diclofenac net emission. Resulting concentrations from the model were compared to the concentrations measured during the two field campaigns in 14 points of the Llobregat River.
The methodology for adjusting the model is the primitive method of trial and error. The error was measured by the Root Mean Square Error (RMSE). Thus, the goal was to minimise the RMSE with K degradation constant and diclofenac emission.
3. R
ESULTSThe GREAT-ER model has been used to predict the fate of the di-clofenac drug in the Llobregat River. For this purpose, information on diclofenac behaviour has been gathered, followed by the introduction of the Llobregat Catchment into the model and a final calibration.
The GREAT-ER model provided the following results for each scenario (Fig.4) with their corresponding RMSE (Table 4).
Appendix I summarises numerical data from the results and the error cri-terion.
Figure 5. Measured concentrations (ng/l) at field campaigns (red colour) and resulting concentrations (ng/l) from the GREAT-ER model with scenario 1 (September 2010, deterministic approach), average value and standard deviation value (green colour), in the 14 sampling points.
Figure 6. Measured concentrations (ng/l) at field campaigns (red colour) and resulting concentrations (ng/l) from the GREAT-ER model with scenario 2 (September 2011, deterministic approach), average value and standard deviation value (green colour), in the 14 sampling points.
Figure 7. Measured concentrations (ng/l) at field campaigns (red colour) and resulting concentrations (ng/l) from the GREAT-ER model with scenario 3 (September 2010, stochastic approach), average value and standard deviation value (green colour), in the 14 sampling points.
Figure 8. Measured concentrations (ng/l) at field campaigns (red colour) and resulting concentrations (ng/l) from the GREAT-ER model with scenario 4 (September 2011, stochastic approach), average value and standard deviation value (green colour), in the 14 sampling points.
Table 4. Root Mean Square Error (ng/l) for each scenario.
SCENARIO 1 2 3 4
RMSE 18.1 64.4 12.2 56.3
Table 5. GREAT-ER model estimation for diclofenac emission (g/cap/year) out of WWTPs.
SCENARIO 1 2 3 4
Diclofenac
3.1.
Calibrated Parameters
Through the calibration process it has been possible to prove that con-taminant emission is a much more significant parameter than the natural degradation constant. Calculated concentrations can be two or even three times higher depending on the adopted WWTP removal efficiency or excretion rate. The estimated diclofenac emission out of WWTPs for each scenario is provided in table 5. Assuming that in 2010 and 2011 the diclofenac drug consumption was similar to the consumption published for 2006 (0.787 mg/cap/day (Spanish Agency of Medicaments and Sani-tary Products, 2007), excretion rates and WWTP removals have been approximately estimated from the emission results. The resulting values imply a large reduction of emission from its consumption. This means that excretion rates are low (10-20%) and WWTP removal efficiency high (50-70%).
The degradation constant also implies significant changes in concentra-tion values, especially with low water velocity which implies a higher residence time available for degradation, but its effect is always less no-ticeable. However, after comparing the error for the high degradation constant (0.155 d-1) and low constant (0.015 d-1), it was concluded that
concentrations are more properly estimated with high biodegradability for diclofenac. Despite the fact that different K values did not yield high RMSE differences, 0.15 d-1
appeared
to be the most adequate rate in thefour scenarios.
3.2.
Model Tendency
The GREAT-ER model was able to predict diclofenac concentrations in the Llobregat River network with a certain margin of error. GREAT-ER agreed with 2nd campaign samples (September 2011) taken in the upper
part of the catchment, which are the lowest. Nonetheless, GREAT-ER estimated even a lower concentration for points which were downstream of the lakes. The model tends to apply a complete degradation in lakes, whereas field samples can still detect concentrations over 0.1 ng/l. The concentrations did not match with 1st campaign samples (September
2010) taken in the upper part of the catchment (LLO1, LLO2 and CAR1). However, these sampling values are repeated exactly in other sampling points (CAR2 and CAR4), which can be considered inconsis-tent. Unfortunately, there has not been a chance to assure the reliability of this data.
The model followed the tendency of diclofenac through the Llobregat River and Cardener Tributary River, with generally acceptable over- or under- estimations. The model overestimated concentration in the high-est point of the Anoia River, but underhigh-estimated the middle point. A possible reason could be the low flows and high variability that charac-terises this affluent, which complicates the estimations of flows in the river. A similar problem exists in the last sampling point (LLO7). The flow variability and uncertainty is the highest close to the discharge point of the river. Field campaigns show high concentrations, which GREAT-ER did not calculate properly. However, the model predicted the in-crease of concentration in this downstream point (LLO7).
4. D
ISCUSSIONThe GREAT-ER model is able to estimate diclofenac concentrations all over the Llobregat Catchment, according to some hydrological variables (flow and velocity) as well as substance degradation properties and consumption rates. Despite the fact that calculated concentrations do not match exactly sampling data, the model captures the tendency of
diclofenac occurrence. It is able to predict where concentrations increase or decrease considerably, following the diclofenac level in the water with a certain error margin.
4.1.
Uncontrolled Discharges
60 waste water treatment plants receive sewage water from most of the municipalities in the catchment area. Some of them assist towns with fewer than 150 inhabitants; therefore, theoretically nearly 100% of sew-age water is supposed to pass through a WWTP. However, in reality, some uncontrolled and variable discharges to river water exist from cer-tain urban or industrial areas.
Some measured points of the field campaign could be affected by these uncontrolled discharges. The LLO2 point is located in the upper part in the catchment, downstream of La Baells Lake. There is an industrial channel which supplies water from the reservoir to Berga’s city and in-dustry. This channel discharges just before the sampling point LLO2. It is approximately 14 km in length, 65% is opened and about 25% passes through urban or industrial areas. Hence, in this point there is presuma-bly an uncontrolled source of contaminant diclofenac.
Another point probably affected by some uncontrolled discharges is LLO7, close to the discharge point of the Llobregat River to the sea. The river crosses the suburban area of Barcelona, so it is the most inhabited area. Consequently, there is a risk of diclofenac release into this part of Llobregat or into small torrents that conclude in Llobregat.
It is very difficult to estimate the amount of drug released to Berga’s In-dustrial Channel or to the Llobregat River, but it is a potential reason which could justify the underestimated concentration of the model at these two points.
4.2.
Deterministic or Stochastic Approach
Results indicated a better performance of the stochastic model than the deterministic model, according to mean root square error criterion. However, the lack of accuracy of the deterministic model could be mainly due to the limited availability of reliable data for some variables, such as, flow values. Therefore, a deterministic approach should be the most accurate one if the aim is to estimate the concentrations for a cer-tain day or specific time, while at the same time there is accurate hydro-logical data available for this specific moment.
An important advantage of the stochastic model is the variability data given as concentration results. The standard deviation gives an idea of the uncertainty and variability that exists in a certain point of the river. Thus, the stochastic approach could be the most proper one to predict future substance concentrations, where there is no accurate data available of most variables.
4.3.
Calibrated Parameters
Diclofenac emission from WWTPs would be a known parameter if there was accurate data on pharmaceutical consumption, human excretion rates and sewage system removal. Unfortunately, due to the little data available, substance emission is one of the parameters to calibrate. The calibration process estimated that emission in 2010 was between 0.0115 g/cap/year (scenario 3) and 0.051 g/cap/year (scenario 1), and in 2011 between 0.0115 (scenario 4) and 0.013 g/cap/year (scenario 2). This means, that the emission was between 4% and 17% of the consumed diclofenac in 2006 (0.787 mg/cap/day). These percentages
represent a diclofenac fraction which is not removed in the human body and in the sewage system, which agrees with collected literature data. Nevertheless, another hypothesis is that consumption in 2010 and 2011 increased following the consumption pattern from 1992 to 2006 (Ap-pendix II). An estimation of consumption can be done by approximating the tendency with a second order polynomial relation. As a result 0.836 and 0.847 mg/cap/day is the estimated consumption for 2010 and 2011, respectively, according to the tendency of available data. At the same time, this consumption increase implies that excretion rates must be smaller and WWTP removal higher, but not in a significant way. More-over, other drug removal ways could be considered, like degradation in the sewer system. Overall, between 3% and 16% of the consumed di-clofenac would be released out of the WWTPs, which is still inside the studied intervals from the literature. Therefore, a growth of diclofenac use among the Llobregat Catchment inhabitants is a valid and possible hypothesis.
Consumption data and estimations are gathered in Appendix II.
The natural degradation constant (K) is the second parameter that was calibrated. Literature data provided rate values for diclofenac: a mini-mum degradation of 0.015 d-1 and maximum degradation of 0.155 d-1.
The model proved that constant rates over or under these extreme val-ues do not provide better results. The RMSE was higher for a K value of 0.001 d-1 or 0.3 d-1. In addition, the model showed the minimum RMSE
for the highest degradation rate, 0.155 d-1. Literature suggests very
vari-able data for diclofenac natural degradation. Some authors define di-clofenac as a conservative solute (Johnson et al, 2007), while others state it is a rapidly degradable substance (Bendz et al, 2005). In this project, it has been proved that diclofenac can be more properly estimated with a degradation constant close to 0 .155 d-1, which is considered a high
deg-radation rate.
4.4.
Lake Model
Different authors suggest potential degradation of diclofenac in lakes due to photolysis (Buser et al, 1998; Tixier et al, 2003; Kunkel and Radke, 2011). The GREAT-ER model also simulated a nearly 100% deg-radation in the three reservoirs of the Llobregat Catchment. However, measured concentrations during field campaigns show concentrations over 0.1 ng/l downstream of the lakes.
It has been explained in section 2.3.1. that GREAT-ER calculates sub-stance removal in every stretch with the following 1st order decay
expres-sion:
R=1-e-HRT*K
The residence time HRT for lakes is estimated as:
3600
Q
Vol
HRT
This formula must be applied under a certain basic hypothesis, such as assuming a fully mixed model all over the lake. Nonetheless, there are many factors in reality that prevent the lake from being fully mixed. Firstly, stratification is a common process which divides the lake into two or three layers depending on water temperature and density at different depths. The upper layers are generally warmer and less dense than the bottom layers. At the same time the bottom layers are usually more static. Hence, substance transportation is mainly happening in the upper part of the lake, especially if there is not an important
sedimentation capacity. This means that diclofenac probably does not move through all parts of the lake, but just through the upper layer. Furthermore, the shape of the lake also affects the water movement. Irregular forms will complicate the substance transport through some parts. These and other factors imply that the volume considered calculating residence time should be smaller than the whole lake volume, and consequently, the real degradation rate in lakes would be smaller too. Taking into consideration the measured diclofenac concentrations in samples upstream and downstream of Sant Ponç Lake, an estimation of the residence time has been carried out (Appendix III). Considering the GREAT-ER model formulation, calculating entry and exit concentra-tions with sampling data and assuming an average K degradation con-stant (0.079 d-1), the residence time in Sant Ponç Lake should be
ap-proximately 143 days. This implies a volume of 1.01 ·106 m3, whereas the
first considered volume was of 22.74 ·106 m3. Therefore, according to
sampling concentrations just 4.5% of the real reservoir volume is ex-posed to the photodegradation process.
Buser et al. (1988) did one of the most significant studies about di-clofenac photodegradation in Greifensee Lake. However, some impor-tant characteristics can be distinguished between this Swiss lake and the three lakes in the Llobregat Catchment. Greifensee Lake is 150 ·106 m3,
while the largest lake in the Llobregat, La Baells, is 109 ·106 m3, which
implies a lower residence time. In addition, Greifensee has a maximum depth of 32 meters, while La Baells has approximately 80 m, so more volume can be stratified. These points could support the fact that not the whole lake volume should be considered in the model.
An alternative to the GREAT-ER simple model could be a model which divides the volume in the three dimensions: vertically considering strati-fication layers and horizontally considering smaller parts according to the lake shape in a plane. As a result, the model would be divided into smaller volumes and the transport between them should be included. This would be an alternative to improve the lake model.
5. C
ONCLUSIONThe GREAT-ER model has been used and calibrated with measured field concentrations in order to predict the occurrence of the diclofenac pharmaceutical in the Llobregat Catchment. The main conclusions are: The geo-referenced model is able to estimate concentration values in
most sampling points with an acceptable margin of error. The mean factor (simulated concentrations/measured concentrations) of the four scenarios is 1.79. This value agrees with the results obtained in another modelling study carried out in Switzerland with GREAT-ER model to predict the fate of β-blocker human pharmaceuticals (Alder et al, 2010), where the resulting factor was 1.6-2.5. Furthermore, the model is able to predict the tendency of diclofenac fate all over the river network. Calibrated parameters agree with suggested values by several authors
for diclofenac degradation patterns (excretion rates, waste-water treat-ment plant removal and natural biodegradation) and consumption. However, it should be considered that provided data from literature covers a wide range of values; WWTP removal, for instance, could be from 0% to 75%.
The main way to improve model results is to provide more accurate data. Currently, the available data on hydrological variables in the Llobregat Catchment and diclofenac degradation behaviour and
consumptions is quite limited and uncertain. Research involving emerging contaminants, such as pharmaceuticals and personal care products, started to appear a couple of decades ago, resulting in a wide variety of inaccurate data for different medical drugs.
A deeper study for the lake model is suggested, due to the differences between simulated and measured concentrations. An alternative model which divides lakes taking into account vertical stratification and hori-zontal morphology shapes could be the best option to improve the re-sults.
The GREAT-ER model could be a reliable tool for predicting the fate of emerging contaminants. It is not able to obtain exact concentration values. Nevertheless, the model allows estimating an overall concentra-tion distribuconcentra-tion all over the river network, which could be useful for water quality and resources management. Moreover, the stochastic ap-proach introduces variability and uncertainty in the model. Further re-search with GREAT-ER and more field campaign data could allow a final validation of the model. Therefore, new scenarios under different environmental conditions, such as, scarcity, or future situations with higher pharmaceutical consumption, could be contemplated.
R
EFERENCESAlder AC, Schaffner C, Majewsky M, Klasmeier J, Fenner K.. 2010. Fate of β-blocker human pharmaceuticals in surface water: Comparison of measured and simulated concentrations in the Glatt Valley Water-shed, Switzerland. Water Research. 44: 936-948
Al-Rajab AJ, Sabourin L, Lapen DR, Topp E. 2010. The non-steroidal anti-inflammatory drug diclofenac is readily biodegradable in agricul-tural soils. Science of the Total Environment. 409: 78-82
Bendz D, Paxéux NA, Ginn TR, Loge FJ. 2005. Occurrence and fate of pharmaceutically active compounds in the environment, a case study: Höje River in Sweden. Journal of Hazardous Materials. 122: 195-204 Boeije G, Vanrolleghem P, Matthies M. 1997. A geo-referenced aquatic
exposure prediction methodology for ‘down-the-drain’ chemicals.
Water Science and Technology. 36: 251-258
Buser HR, Poiger T, Müller MD. 1998. Occurrence and fate of the pharmaceutical drug diclofenac in surface waters: rapid photodegra-dation in a lake. Environmental Science and Technology 32: 3449-3456 Carballa M, Omil F, Lema JM. 2008. Comparison of predicted and
measured concentrations of selected pharmaceuticals, fragrances and hormones in Spanish sewage. Chemosphere. 72: 1118-1123
Heberer T. 2002. Tracking persistent pharmaceutical residues from mu-nicipal sewage to drinking water. Journal of Hydrology. 266: 175-189 Jiskra M. 2008. Fate of the pharmaceutical diclofenac in the aquatic
envi-ronment.. Biogeochemistry and Pollutant Dynamics. 21: 1-16
Johnson AC, Keller V, Williams RJ, Young A. 2007. A practical demon-stration in modeling diclofenac and propranolol river water concen-trations using a GIS hydrology model in a rural UK catchment.
Envi-ronmnetal Pollution. 146: 155-165
Jones OAH, Voulvoulis N, Lester JN. 2005. Human pharmaceuticals in wastewater treatment processes. Environmental Science and Technology. 35: 401-427
Kunkel U, Radke M. 2011. Reactive tracer test to evaluate the fate of pharmaceuticals in rivers. Environmental Science and Technology. 45: 6296-6302
Laak TL, Aa M, Houtman CJ, Stocks PG, Wezel AP. 2010. Relating en-vironmental concentrations of pharmaceuticals to consumption: a mass balance approach for the river Rhine. Environment International. 36: 403-409
Lienert J, Gúdel K, Escher BI. 2007. Screening method for ecotoxi-cological hazard assessment of 42 pharmaceuticals considering hu-man metabolism and excretory routes. Environmental Science and
Tech-nology: 41: 4471-4478
Lin K, Gan J. 2011. Sorption and degradation of wastewater-associated non-steroidal anti-inflammatory drugs and antibiotics in soils.
Chemos-phere. 83: 240-246
Miege C, Choubert JM, Ribeiro L, Eusèbe M, Coquery M. 2009. Fate of pharmaceuticals and personal care products in wastewater treatment plants – Conception of a database and first results. Environmental
Pol-lution. 157: 1721-1726
Ort C, Hollender J, Schaerer M, Siegrist H. 2009. Model-based evalua-tion of reducevalua-tion strategies for micropollutants from wastewater treatment plants in complex river networks. Environmental Science and
Technology 43 (2009), 3214-3220
Osorio V, Marcé R, Pérez S, Ginebreda A, Cortina JL, Barceló D. 2012. Occurrence and modeling of pharmaceuticals on a sewage-impacted Mediterranean river and their dynamics under different hydrological conditions. Science of the Total Environment. 440: 3-13
Pal A, Gin KY, Lin AY, Reinhard M. 2010. Impacts of emerging organic contaminants of freshwater resources: review of recent occurrences, sources, fate and effects. Science of the Total Environment. 408: 6062-6069
Scheneider HT, Nuernberg B, Dietzel K, Brune K. 1990. Biliary elimina-tion of non-steroidal anti-inflammatory drugs in patients. British
Jour-nal of Clinical Pharmacology. 2: 127-131
Schowanek D, Webb S. 2000. Examples of exposure assessment simula-tion for pharmaceuticals in river basins with the GREAT-ER 1.0 sys-tem. Proceedings KVIV Seminar ‘Pharmaceuticals in the Environment’,
Brus-sels
Spanish Agency of Medicaments and Sanitary Products. 2007. Utilización de antiinflamatorios no esteroides (AINE) en España. Publications Tixier C, Singer HP, Oellers S, Müller SR. 2003. Occurrence and fate of
Carbamazepine, clofibric acid, diclofenac, ibuprofen, ketoprofen and naproxen in surface waters. Environmental Science and Technology. 37: 1061-1068
Whelan MJ, Gandolfi C, Bischetti GB. 1999. A simple stochastic model of point source solute transport in rivers based on gauging station data with implications for sampling requirements. Water Research. 33: 3171-3181
A
PPENDIXI
–
R
ESULTS:
CONCENTRATION TABLES,
RMSE,
C
SIM/C
MEAS FACTOR,
EMISSION,
K
(F
OR EACHSCENARIO
’
S BEST RESULT)
The following tables show the numerical results after calibration. In each scenario the root-mean-square error (RMSE) and F factor is calculated with these expressions:
14
.)
.
(
2
Cestim
Cmeas
RMSE
. . Cmeas Cestim F Where Cestim. is the estimated concentration by the GREAT-ER model and Cmeas. is the measured concentration through field samplings.
Table 6. GREAT-ER model results and measured concentrations in every sampling point, and for each scenario. Error estimation through F and RMS. All units in ng/l.
SCENARIO 1. Deterministic model. 2010
K (h-1) 0.006458333
Emission (kg/cap/year) 5.05569E-05
Diclofenac Concentra-tions (ng/l) GREATER model estima-tion Sampling measurements F (Ces-tim./Cmeas. ) RMSE LLO1 0.501 6.061 -0.917 30.913 LLO2 0.000 6.061 -1.000 36.731 LLO3 11.806 9.726 0.214 4.323 CAR1 0.000 3.636 -1.000 13.223 CAR2 4.283 3.636 0.178 0.418 CAR3 7.773 4.800 0.619 8.838 CAR4 26.812 6.061 3.424 430.615 LLO4 18.564 12.800 0.450 33.219 LLO5 25.459 18.484 0.377 48.648 ANO1 40.530 5.895 5.876 1199.628 ANO2 78.878 129.053 -0.389 2517.524 ANO3 37.779 50.737 -0.255 167.894 LLO6 24.575 15.853 0.550 76.080 LLO7 55.899 62.105 -0.100 38.518 0.573 18.139
SCENARIO 2. Deterministic model. 2011
K (h-1) 0.006458333
Emission (kg/cap/year) 1.29265E-05
Diclofenac Concentrations (ng/l) GREATER model estima-tion Sampling measurements F (Ces-tim./Cmeas. ) RMSE LLO1 0.40 0.539 -0.263 0.020 LLO2 0.00 0.469 -1.000 0.220 LLO3 5.88 4.484 0.311 1.945 CAR1 0.00 0.863 -1.000 0.745 CAR2 1.82 0.248 6.306 2.454 CAR3 3.10 4.905 -0.368 3.254 CAR4 14.90 11.916 0.250 8.888 LLO4 10.49 6.737 0.557 14.079 LLO5 15.31 4.842 2.162 109.640 ANO1 15.46 1.493 9.360 195.199 ANO2 90.38 120.000 -0.247 877.167 ANO3 71.63 54.526 0.314 292.399 LLO6 15.17 9.453 0.605 32.665 LLO7 42.07 280.000 -0.850 56612.112 1.153 64.449
SCENARIO 3. Stochastic model. 2010
K (h-1) 0.006458333
Emission (kg/cap/year) 1.14902E-05
Diclofenac Concentra-tions (ng/l)
GREATER model
esti-mation Sampling measure-ments F (Ces-tim./Cmeas.) RMSE Mean Value Standard Deviation LLO1 0.198 0.000 6.061 -0.967 34.367 LLO2 0.000 0.000 6.061 -1.000 36.731 LLO3 5.776 9.726 -0.406 15.605 CAR1 0.000 0.000 3.636 -1.000 13.223 CAR2 1.700 0.960 3.636 -0.533 3.750 CAR3 3.540 2.250 4.800 -0.263 1.588 CAR4 13.743 3.983 6.061 1.268 59.023 LLO4 9.281 3.970 12.800 -0.275 12.386 LLO5 14.793 7.948 18.484 -0.200 13.625 ANO1 19.961 0.000 5.895 2.386 197.865 ANO2 100.150 64.025 129.053 -0.224 835.362 ANO3 79.584 64.650 50.737 0.569 832.159 LLO6 14.710 7.900 15.853 -0.072 1.306 LLO7 67.665 72.560 62.105 0.090 30.911 -0.045 12.212
SCENARIO 4. Stochastic model. 2011
K (h-1) 0.006458333
Emission (kg/cap/year) 1.14902E-05
Diclofenac Concentra-tions (ng/l)
GREATER model
estima-tion Sampling
measure-ments
F
(Ces-tim./Cmeas.) RMSE Mean Value Standard
Deviation LLO1 0.198 0.000 0.539 -0.632 0.116 LLO2 0.000 0.000 0.469 -1.000 0.220 LLO3 5.776 4.484 0.288 1.669 CAR1 0.000 0.000 0.863 -1.000 0.745 CAR2 1.700 0.960 0.248 5.843 2.107 CAR3 3.540 2.250 4.905 -0.278 1.864 CAR4 13.743 3.983 11.916 0.153 3.340 LLO4 9.281 3.970 6.737 0.378 6.471 LLO5 14.793 7.948 4.842 2.055 99.020 ANO1 19.961 0.000 1.493 12.373 341.088 ANO2 100.150 64.025 120.000 -0.165 394.022 ANO3 79.584 64.650 54.526 0.460 627.888 LLO6 14.710 7.900 9.453 0.556 27.640 LLO7 67.665 72.560 280.000 -0.758 45086.15 2 1.305 57.689