Page 1
Building a safety case
for a small sized product line
of Fuel Level Display Systems
Antonio Gallucci
Master Student – Software Engineering
Internal supervisor
Barbara Gallina
Post-Doc Researcher Mälardalens Högskola barbara.gallina@mdh.seExternal supervisor
Mattias Nyberg
Expert EngineerScania AB, Södertälje, Sweden mattias.nyberg@scania.com
Examiner
Kristina Lundqvist
Professor Mälardalens Högskola kristina.lundqvist@mdh.seAbstract:
ISO 26262 is an international standard valid for the automotive domain. It regulates all the activities to perform for developing safety critical systems in such domain. To be compliant with ISO 26262, all the required activities have to be performed and all the required work products have to be provided. Furthermore, in addition to develop a system in a safe way, following the safety standard guidelines, the achieved safety has also to be demonstrated. This is done through a safety case, a structured argument showing that a system is acceptably safe.
ISO 26262 focuses on single systems and does not contain guidelines for product lines. Product line engineering is a valid approach to systematize reuse, aimed at reducing the effort needed to develop similar systems. But, it loses its strength when dealing with safety critical systems, since it is not aligned with safety standards. Hence, when developing a safety critical product line in the automotive domain, the work products required by ISO 26262 have to be provided every time from scratch, including the safety case, for each single system of the product line.
This thesis work focuses on providing an approach for building and modeling a safety case for safety critical product lines in the automotive domain. Furthermore, the considered product line engineering approach is aligned with ISO 26262, through the inclusion of safety activities in the product line development process. Giving in this way, the concrete possibility to overtake to the current limitations, reducing the effort needed to develop and certificate each single system of a safety critical product line. To illustrate the validity of the proposed approach a safety critical product line developed by Scania is used as case study.
Page 3
Acknowledgments
First of all, I would like to thank my internal supervisor, Barbara Gallina, for her precious suggestions and support during the entire thesis period. I could not find a better supervisor.
I would like to thank my external supervisor, Mattias Nyberg, for giving me the great opportunity to perform this thesis work within a wonderful company, such as Scania.
I would like to thank my examiner, Kristina Lundqvist for arousing in me a strong interest in the safety critical systems engineering field.
Special thanks to my friends, Achille, Niklas, Aleksandar, Rasul, Tolga, Daniel, Mahmoud and many more for the great time that we spent together during my stay in Västerås.
Last but not least, I would like to thank my family for their great support during all this wonderful experience, without which I never would have made it.
Table of Contents
1. Introduction 9
1.1 Context and motivation 9
1.2 Contribution 10
1.3 Document structure 10
2. Background 11
2.1 Safety critical systems 11
2.2 ISO 26262 12
2.2.1 ISO 26262-3 Concept phase 14
2.2.2 ISO 26262-4 Product development at system level 16
2.3 Safety case 17
2.4 Safety case modeling 19
2.4.1 Goal Structuring Notation 19
2.5 Product line engineering 23
2.6 Feature diagrams 24
2.6.1 Usage context 25
2.7 Object Management Group (OMG) Systems Modeling Language (SysML) 26
2.7.1 Activity diagrams 26
2.7.2 Block definition and internal block diagram 27 2.7.3 Block definition and internal block diagram for product lines 28
2.8 Hazard Analysis 29
2.8.1 Hazard and operability analysis 30
2.8.2 Fault tree analysis 31
2.8.3 Hazard Analysis for product lines 32 2.8.3.1 Product line Fault Tree Analysis 32
2.9 Fuel Level Display systems 33
2.10 Related work 37
3. Problem formulation and analysis 39
3.1 Problem formulation 39
3.2 Problem analysis 40
3.2.1 Problem scope 40
3.2.2 Commonality and variability modeling approaches 40 3.2.3 Commonality and variability analysis 41
3.2.4 Safety case building 41
4. Method 42
4.1 Product line usage context 42
4.2 Product line requirements 43
4.3 Product line behavior 44
4.4 Product line hazard analysis 44
4.4.1 Hybrid hazard analysis 44
4.4.2 Deductive hazard analysis 45
4.5 Product line design 45
4.6 Safety case line 46
5. Methodological and modeling support for building safety case lines 46
5.1 Approach overview 46
5.2 Feature diagram tool 48
5.3 Feature diagram obligations 49
Page 5
5.5 Adapted HAZOP analysis 50
5.6 Adapted FTA 51 5.7 GSN tool 52 6. Case study 52 6.1 Item definition 52 6.1.1 Usage context 53 6.1.2 Functionality 54
6.1.3 Product line behavior 55
6.1.4 Preliminary architecture 58
6.1.5 Functional requirements 60
6.2 Hazard analysis and risk assessment 61
6.2.1 Safety goals 63
6.3 Functional safety concept 64
6.4 Technical safety requirements 65
6.5 System design 66
6.5.1 Safety analysis on system design 68
6.6 Safety case 70 6.6.1 Process-based evidences 71 6.6.2 Product-based evidences 75 6.7 Discussion 76 7. Conclusion 77 7.1 Summary 77 7.2 Future work 79 References 80
Index of Figures
Figure 1:Chain of events leading to a harm taken from [10]. ...12
Figure 2: Overview of ISO 26262 taken from [11] ...13
Figure 3: Design life-cycle and Safety case life-cycle taken from [12] ...18
Figure 4: Principal elements of the Goal Structuring Notation ...19
Figure 5: An Example Goal Structure taken from [3] ...20
Figure 6: Elements of the GSN extended taken from [21] ...21
Figure 7: Pattern modeling elements ...21
Figure 8: Hazard avoidance pattern taken from [25] ...22
Figure 9: Example of configurable goal structure ...23
Figure 10: Product line engineering phases ...24
Figure 11: Feature diagram example ...25
Figure 12: Usage context example ...26
Figure 13: Basic element of an activity diagram...26
Figure 14: Example of an activity diagram ...27
Figure 15: Example of block definition and internal block diagrams taken from [37] ...28
Figure 16: Example of variability with block diagrams taken from [37] ...28
Figure 17: Example of variability with block diagrams taken from [37] ...29
Figure 18: Fault tree symbols ...31
Figure 19: Example of Fault tree ...31
Figure 20: Fault tree for product lines based on the notation used in [43] ...33
Figure 21: ECUs configuration for trucks with liquid fuel engine ...35
Figure 22: ECUs configuration for trucks with gas fuel engine ...35
Figure 23: ECUs configuration for buses with liquid fuel engine ...36
Figure 24: ECUs configuration for buses with gas fuel engine ...36
Figure 25: ISO 26262 safety life cycle and PLE alignment ...47
Figure 26: Product line safety case lifecycle ...48
Figure 27: Visio stencil for creating feature diagrams ...48
Figure 28: Obligation in the context of a feature diagram ...49
Figure 29: Example of variability for product lines in an activity diagram ...50
Figure 30: Adjusted notation for product line FTA ...51
Figure 31: Visio stencil for creating goal structures ...52
Figure 32: FLDPL usage context ...53
Figure 33: Usage context considered for FLDPL ...54
Figure 34: Feature diagram of the FLDPL's functionality ...55
Figure 35: FLDPL behavior ...57
Figure 36: FLDPL preliminary architecture ...59
Figure 37: Feature diagram of the FLDPL's functional requirements ...61
Figure 38: FLDPL safety goals feature diagram...63
Figure 39: FLDPL safety goals and functional safety requirements ...64
Figure 40: FLDPL safety requirements for the FLDPL ...65
Figure 41: COO architecture ...67
Figure 42: ICL architecture ...68
Figure 43: Fault tree analysis for FLDPL ...69
Figure 44: Top level goal structure of the safety case ...71
Figure 45: Process-based aspects ...72
Figure 46: Section 3 module ...72
Figure 47: Section 4 module ...73
Figure 48: Trustworthiness module...74
Page 7
Index of Tables
Table 1: Classes of severity taken from [11] ...14
Table 2: Classes of controllability taken from [11] ...15
Table 3: Classes of Exposure taken from [11] ...15
Table 4: ASIL determination taken from [11] ...15
Table 5: System Design Analysis taken from [11] ...17
Table 6: Basic structure of a HAZOP table ...30
Table 7: Extended HAZOP table taken from [10] ...31
Table 8: Example of adapted HAZOP table ...51
Acronyms and Abbreviations
ASIL Automotive Safety Integrity Level
BCS Body chassi system
COO Coordinator
E/E Electrical and/or electronic
ECU Electronic Control Unit
FLDPL Fuel Level Display Product Line
EMS Engine Management System
FLDS Fuel Level Display System
FSR Functional Safety Requirement
FTA Fault Tree Analysis
GSN Goal Structuring Notation
HAZOP Hazard and Operability Analysis
ISO International Organization for Standardization
PLE Product Line Engineering
SysML Systems Modeling Language
Page 9
1. Introduction
This introductive chapter is organized as follows: in section 1.1 the context and motivation of the thesis are explained; in Section 1.2 the contributions of this thesis work are presented; in Section 1.3 the document structure is described.
1.1 Context and motivation
ISO 26262 is a safety standard for the automotive domain. Quoting from the standard: “ISO
26262 is intended to be applied to safety-related systems that include one or more electrical and/or electronic (E/E) systems and that are installed in series production passenger cars with a maximum gross vehicle mass up to 3 500 kg.” By now, trucks do not have to be compliant with the standard. However, it is likely that by 2016 they will have to [1].
ISO 26262 regulates all the phases of the entire lifecycle of the system, starting from the management and requirements specification phases up to the production release. The standard also defines the work products that have to be produced during the system lifecycle. A safety case (a structured argument used to show that the system is acceptably safe) is one of these work products required by the standard.
Arguments used to show that the process defined in the standard has been adopted, are called process-based arguments; instead, the ones used to show that the system behavior is acceptably safe are called product-based arguments. Process and product-based arguments are combined in a safety case.
As intended in ISO 26262, the safety case is aimed at showing the safety of one single system, and not of product lines that are families of systems having some common functionalities and other variable ones, which distinguish each single system.
Thanks to these common and variable functionalities, a systematic approach in reusing different artifacts resulting from all the phases of the system development process could lead to the easing of development of each single system. Such approach is called product line
engineering (PLE) approach, and it could be extended considering also safety activities.
Supporting in this way, the systematic reuse also for such activities, including the building of a safety case. Hence, easing not only the development, but also the certification1 of the
entire safety critical product line.
This thesis work has been performed in collaboration with Scania, that is one of the leading manufacturers of heavy trucks, buses, coaches and engines. To be ready by 2016, Scania is interested in continuing investigating ISO26262 as well as safety case provision. Thus this thesis builds on top of previous ones [2] [3] and it focuses on providing a systematic approach to build a safety case for a small-sized product line of Fuel Level Display Systems, which Scania considers being safety critical systems and need to be developed in compliance with the standard.
1
In this thesis the term certification is used to denote demonstration of functional safety of a given product in compliance with a given standard.
1.2 Contribution
To build a safety case for a product line in compliance with ISO 26262, a product line development process is aligned with the safety standard, through the inclusion of the considered and required safety activities, in the product line development process. This makes possible the identification and management of commonalities and variabilities within the outcomes related to a safety activity in the development process, supporting in this way reusability, and reducing the effort to develop and certificate each single system of a product line. Furthermore, a product line modeling approach is provided for each considered activity, giving the possibility to represent commonalities and variabilities within the relative outcomes.
So far, product line development processes have not explicitly aligned with safety standards. Product line modeling approaches are available for different aspects of the product line development process, but they have not been explicitly selected and combined for a product line development process, in order to be compliant with ISO 26262. In this thesis work an alignment of the product line development process with the activities required by ISO 26262 is proposed. Several product line approaches are accurately selected and extended were needed, in order to highlight and manage commonalities and variabilities for each considered development activity and the relative outcomes, in the context of ISO 26262.
In addition to manage and model commonalities and variabilities, an approach to represent a safety case relating his common and variable parts to the commonalities and variabilities identified during all the considered activities of the product line development process is used. Giving a clear view, on how a careful identification and tracking of the common and variable aspects of a product line, impacts on the structure of the safety case. Giving in this way concrete reusing possibilities in order to reduce the time-to-market, development and certification effort for a safety critical product line. The validity of the presented approach is also shown, applying it to a real set of similar safety critical systems developed by Scania.
Finally, the paper VROOM & cC: a Method to Build Safety Cases for ISO 26262-compliant
Product Lines [4] stemmed from this thesis work, and it has been accepted at the Next
Generation of System Assurance Approaches for Safety-Critical Systems workshop (SASSUR).
1.3 Document structure
The rest of this thesis is organized as follows:
Chapter 2 is intended to present the background information needed to understand the topics discussed and analyzed in this thesis. This information is also used to build the proposed solution in Chapter 4 and 5;
Chapter 3 contains the problem formulation and its analysis. The main problem is presented in detail and it is divided into several sub-problems, each of them covering a different aspect, in order to simplify its resolution.
Page 11
Chapter 4 explains how to use the available approaches to solve the identified sub-problems, describing step by step how to achieve the desired goal. Furthermore, available approaches limitations in relation to this thesis work are presented;
In Chapter 5 a general overview of the proposed alignment of the product line development process and the activities required by ISO 26262 is given. In addition the highlighted approaches limitations, within Chapter 4, are addressed.
Chapter 6 presents the case study describing how the proposed approach is applied on the Fuel Level Display Systems. All the considered activities required by ISO 26262 are performed, using the product line techniques described in Chapter 4 and the Chapter 5;
Chapter 7 concludes the thesis work by describing the benefits and limitations of this thesis work. Furthermore, directions for future work are presented.
2. Background
This chapter provides the necessary background information related to the topics covered in this thesis work. More specifically, In Section 2.1 safety critical systems are handled; In Section 2.2 ISO 26262 standard is described, with a focus on the sections that will be handled in this thesis; In Section 2.3 the concept of safety case is presented; In Section 2.4 safety case modeling is described; In Section 2.5 product lines and the product line engineering approach is described; In Section 2.6 feature diagrams are explained; In Section 2.7 activity diagrams are presented; In Section 2.8 SysML is described; In Section 2.9 the concept of Hazard analysis and some hazard analysis techniques are presented; Finally in Section 2.9 the different versions of the Fuel Level Display System are described.
2.1 Safety critical systems
Safety critical systems are those systems whose failure could result in loss of life, significant
property damage, or damage to the environment [5]. Example of safety critical systems are the ones used in aircrafts, cars, trucks, solving important functions. Failures in these important functions (event that occurs when the delivered service deviates from the correct service [6]), can cause serious damages to the surrounding environment, e.g. auto-pilot function failure, in an aircraft, could cause loss of human life. Many examples of safety critical systems failures can be found in [7] [8] [9]. A failure is caused by an error, which is the deviation from the correct system behavior. While the adjudged or hypothesized cause of an error is called fault [6].
This fault-error-failure sequence can leads to a hazard, which is an unsafe condition, which in turn can cause an harm. This chain of events is summarized in Figure 1.
Figure 1:Chain of events leading to a harm taken from [10].
Since hazards related to safety critical systems can also cause severe injuries, e.g. loss of human life, the safety must be ensured. Safety can be defined as the absence of catastrophic consequences on the user(s) and the environment [6], and it can be partially reached by performing adequate safety activities, e.g. hazard analysis (Section 2.8) and using appropriate safety measures, e.g. redundancy. The total safety of a system cannot be ensured, because there is always a residual risk that a failure can occurs. Also if the total safety cannot be reached the residual risk can be reduced below a minimum established threshold. Once the residual risk is acceptable, the system can be considered as acceptably safe, and can operate in the relative environment.
In order to ensure the acceptable system safety, the activities to develop safety critical systems could be dictated by safety standards. Since, the concept of safety is very general, there are safety standards that are more specific, which are written explicitly to manage sub-parts of the overall system safety, as for example the functional safety. The functional safety is the part of the overall safety which is related to the correct behavior of the system in terms of its inputs and outputs. An example of a functional safety standard is the ISO 26262, which is valid for the automotive domain.
2.2 ISO 26262
ISO 26262 [11] is an international safety standard for the automotive domain. Nowadays it is not mandatory for companies that build E/E systems for trucks and couches, but likely it will be required from 2016 [1]. The international standard covers all phases of the system development process, starting from the management to the maintenance and decommissioning phases. It is composed of 10 sections, organized in clauses, covering different aspects of the management and development processes.
Page 13
Figure 2: Overview of ISO 26262 taken from [11]
In Figure 2 the sections composing the standard and how they are organized are presented. ISO 26262 is based upon a V-model and it is organized as follows: in Section 1 the terms, definitions and abbreviated terms for application in all parts of ISO 26262 are specified; in Section 2 the requirements for functional safety management are presented; in Section 3 the requirements for the performing of the concept phase for automotive application are specified, e.g. requirements on the definition of functional and safety requirements and performing of hazard analysis; In Section 4, 5 and 6 the requirements for product development respectively at the system, hardware and software level are presented; In Section 7 the requirements for production, operation, service and decommissioning are described; In Section 8 the requirements for supporting processes, including overall management of safety requirements, documentation, verification and confidence in the use of software tools are presented; In section 9 the requirements for Automotive Safety Integrity Level (ASIL)-oriented and safety-oriented analyses are described; Finally, in Section 10 general guidelines on ISO26262 are specified.
Since ISO26262 has a very wide scope, this thesis work focus mainly on the third section and part of the fourth one. In the next chapters, Section 3 and 4 of ISO26262 are described more in detail.
2.2.1 ISO 26262-3 Concept phase
The Concept phase section of the standard is composed by four clauses, which are recalled in the following list: Item definition, Initiation of the safety lifecycle, Hazard analysis and risk assessment and Functional safety concept. These four clauses are recalled below.
Item definition
The goal of the item definition clause is to define and describe the item, its dependences on, and interaction with, the environment and other items [11]. Hence, functional and non-functional requirements, boundary, interfaces and assumptions regarding interaction with other systems need to be provided. The result of this phase is the Item Definition work product, and it is a prerequisite for the next clauses.
Initiation of the safety lifecycle
The Initiation of the safety lifecycle clause defines the safety life cycle activities to perform, distinguishing whether it is a new system or modification of an existing one. In the second case, an evaluation of the impact of the changes on the item and its environment need to be performed and documented in the Impact analysis work product. In addition if safety activities need to be tailored or if work products are missing or not compliant with the standard, the necessary activities need to be specified and documented in the safety plan .
Hazard analysis and risk assessment
The Hazard analysis and risk assessment clause defines the activities to carry out in order to identify and categorize the hazards related to the system and its behavior. Furthermore, the clause describes requirements on the activities to be performed for defining the necessary safety goals in order to prevent or sufficiently mitigate the identified hazards, avoiding in this way unreasonable risks.
According to ISO 26262, after that the hazards have been identified they have to be classified. There are different ways to classify them, but the ISO 26262 explicitly defines one method combining severity, controllability and exposure.
The severity is intended as the entity of the damage that the system could lead to in that hazardous situation. ISO26262 defines four levels of severity going from S0 to S3, where S3 is the highest one. Each level of severity is described in more detail in Table 1.
Table 1: Classes of severity taken from [11]
Instead, the controllability is the measure of the capacity to bring back the system in a safe state or to manage the hazardous situations. As for the severity, also the controllability has four different levels, going from C0 to C3, where C3 is the highest one. Each level of controllability is described in more detail in Table 2.
Page 15
Table 2: Classes of controllability taken from [11]
Finally the exposure is the probability that the event can occur, in the specified operational situation. ISO 26262 identifies 5 levels of exposure going from E0 to E4, where E4 is the higher one. Each level of severity is described in more detail in Table 3.
Table 3: Classes of Exposure taken from [11]
Based on these parameters an Automotive Safety Integrity Level (ASIL) is assigned to the hazard, assuming a value between A and D, where A is the lowest and D the higher integrity level. The ASIL can be considered as a measure of the rigor needed to mitigate the hazards, imposing requirements on the processes to follow during the system development process. In addition to these ASILs, there is another level, i.e. QM, indicating that there is no need to specify additional requirements. The combination of severity exposure and controllability and the relative ASIL are described in Table 4.
Table 4: ASIL determination taken from [11]
For example having S3 as severity level, E3 as exposure level and C2 as controllability level the relative ASIL will be C.
According to ISO 26262, the successive step, after identifying and classifying hazards, is to define safety goals. Safety goals are requirements defined to eliminate or sufficiently mitigate
one or more hazards, and they are used to translate hazards and their ASIL to the relative mitigation measures. An ASIL is assigned to each identified safety goal, and this is inherited from the correspondent hazard. If a safety goal corresponds to more than one hazard the highest ASIL is considered. Furthermore, this clause requires that the hazard analysis, risk assessment and the safety goals shall be verified in accordance with the standard.
The result of this clause is documented in three work products: 1. Hazard analysis and risk assessment
2. Safety goals
3. Verification review report of the hazard analysis and risk assessment and the safety goals work products.
Functional safety concept
The goal of this clause is to decompose the safety goals into Functional Safety
Requirements (FSRs) and allocate them to elements of the system architecture.
FSRs specify the safety measures to be applied to the system architecture in order to meet the relative safety goal, and for each safety goal at least one functional safety requirement have to be specified.
In addition, the functional safety requirements need to be verified, showing that are consistent and compliant with the safety goals and mitigate or avoid the hazardous events.
The result of this clause is documented in following work products: 1. Functional safety concept
2. Verification report of the functional safety concept
2.2.2 ISO 26262-4 Product development at system level
The goal of the Product development at system level section is to define requirements concerning the activities to perform at system level in the development process. It is composed by five clauses: Initiation of product development at the system level, Specification of technical safety requirements, System design, Item integration and testing and Safety validation.
In this section only the Specification of technical safety requirements and System design clauses are described, since the other ones are out of the scope of this thesis.
Specification of technical safety requirements
The goal of the Specification of technical safety requirements clause is to specify requirements on the decomposition of FSRs, in Technical Safety Requirements (TSRs) and their allocation.
TSRs shall decompose and refine FSRs, and for each FSR at least one TSR has to be specified. TSRs shall detail the FSRs that are specified at item level into safety requirements that are specified at system level. TSRs shall specify the necessary safety mechanisms and measures to implement FSRs.
Furthermore, TSRs shall also be verified to provide compliance with FSRs and the preliminary architectural design assumptions.
Page 17
1. Technical safety requirements specification 2. System verification report
3. Validation plan
System design
According to ISO 26262 the next step after the definition of TSRs, is to define a system design that meets FSRs and TSRs. This is the goal of the System design clause.
A second goal of this clause is also to verify that the system design effectively comply with FSRs and TSRs.
Furthermore, in order to avoid systematic failures, through the identification of their causes, safety analysis on system design shall be performed. Deductive and inductive analysis (Section 2.8) can be performed. For systems with ASIL C or D both type of analysis are mandatory, while for systems with ASIL A or B only inductive analysis is mandatory. This information is summarized in Table 5.
Table 5: System Design Analysis taken from [11]
The work products resulting from this clause are: 1. Technical safety concept
2. System design specification
3. Hardware-software interface specification (HSI)
4. Specification of requirements for production, operation, service and decommissioning 5. System verification report (refined)
6. Safety analysis reports
2.3 Safety case
When a safety critical system is developed, in order to be certified there is need to show that it is acceptably safe. This can be done through the use of a safety case. More specifically a safety case should communicate a clear, comprehensive and defensible argument that a system is acceptably safe to operate in a particular context [12].
A safety case is composed by three main elements: Requirements, Arguments and Evidences. Requirements describe the objectives to obtain, while Arguments can be used to show the relation between different requirements. Instead, Evidences are used to support requirements.
Between requirements and evidences there is a strict relation. If a requirement is not supported by evidence is unfounded, while if an evidence is used without referring to any requirement is unexplained [12]. Hence, fallacies in the safety case might undermine the safety case itself, as described in [6] and more generally in [13].
The type of evidence required by a safety case depends on the certification method. As described in [14] there are basically two general types of certification approaches, which determine the type of evidence used in the certification process:
1. Prescriptive
2. Performance-based or goal-setting
Prescriptive approaches require evidences showing that the system behaves in a safe way or that the process defined in the guidelines or standard have been followed. While, Performance-based or goal-setting approaches focus on desired, measurable outcomes, rather than system behavior or processes.
A prescriptive approach will be considered for this thesis.
The evidences used to show that the processes defined in the safety standard have been adopted are called process-based evidences, while the ones used to show that the system behaves in a safe way and its usage does not lead to unacceptable risks, are called product-based evidences. As discussed in [15] product-product-based and process-product-based evidences are essential elements of a safety case.
Hence, the safety case should be a structured argument showing that all the processes defined in the standard have been performed, through process-based arguments, and also how safety goals have been met, and all identified hazards have been sufficiently mitigated with the appropriate level of integrity, through product-based arguments, being in this way a valid argument for the system safety.
Similarly to the system development lifecycle adopted in ISO 26262 (V-model), the safety case has its own development lifecycle (preliminary, interim, operational status) as shown in Figure 3.
Figure 3: Design life-cycle and Safety case life-cycle taken from [12]
The Preliminary safety case is the first version of the safety case and it is built after the definition and review of the system requirements specification. Then, after the initial system design and preliminary validation activities it is refined, and the refined version is called Interim safety case. The last version of the safety case is the Operational safety case and it is finalized just prior to in-service use, including complete evidence of satisfaction of systems requirements [12].
Page 19
Hence, the building of the safety case should not be an activity performed at the end of the system lifecycle but it should be considered during all system development life-cycle. An example of how a preliminary safety cases is managed during the design phase is presented in [16].
In the context of ISO 26262 the safety case is a mandatory work product and as such, it is needed to certify systems in the automotive domain. According to the safety standard the safety case should progressively compile the ‘work products’ that are generated during the safety life-cycle [11]. Hence, it could be interpreted as a simply demonstration that the required work products exists. Instead, to be a valid argument for system safety, it should contain both product-based and process-based arguments as discussed in [17].
2.4 Safety case modeling
To represent a safety case a textual or a graphical-based notation can be used. Examples of textual based notations are: normal prose, structured prose, argument outline, mathematical proof or LISP style as described in [18]. Instead, example of graphical notations are the
Claim Argument Evidence (CAE) notation [19], and the Goal Structuring Notation (GSN) [20]
[21]. In Section 2.4.1 a general overview of GSN is given to the reader.
2.4.1 Goal Structuring Notation
GSN is a graphical notation to represent safety cases. An overview of the main elements of GSN is given in Figure 4.
Figure 4: Principal elements of the Goal Structuring Notation
As Figure 4 shows, the main GSN elements are: Goal, Solution, Strategy, Context, Supported by relation and In context of relation. The description of the elements follows: A Goal is a statement about the system safety that needs to be supported directly or indirectly by solutions;
A Strategy can be used to describe the relation between a goals and its sub goals, representing the argument used to decompose the main goal;
The Context element instead, is used to describe the circumstances in which the system safety is argued;
SupportedBy relation allows inferential or evidential relationships to be documented.
Inferential relationships declare that there is an inference between goals in the argument. Evidential relationships declare the link between a goal and the evidence used to substantiate it;
InContextOf relation declares a contextual relationship [21].
Combined together these elements define a goal structure. An example of goal structure is given in Figure 5.
Figure 5: An Example Goal Structure taken from [3]
In the presented goal structure, the main goal G2, states that the required process activity has been carried out, in the context of the concept phase of ISO 26262. In this case, G2 is clearly related to process-based aspects, and it is broken down in two sub-goals through two different strategies: one over the roles (S1) and the other over the activity’s steps (S2). S1 is supported by the goal G3, stating that the roles are qualified, and this goal is supported directly by the evidence E1. Instead S2 is supported by the goal G4, stating that the hazards have been identified and classified, and it is directly supported by the evidence E2.
In order to support safety case modularity, GSN has been extended [21] with modular extensions. Giving in this way the possibility to construct compositional safety cases as shown in [22]. The extended GSN symbols are represented in Figure 6.
Page 21
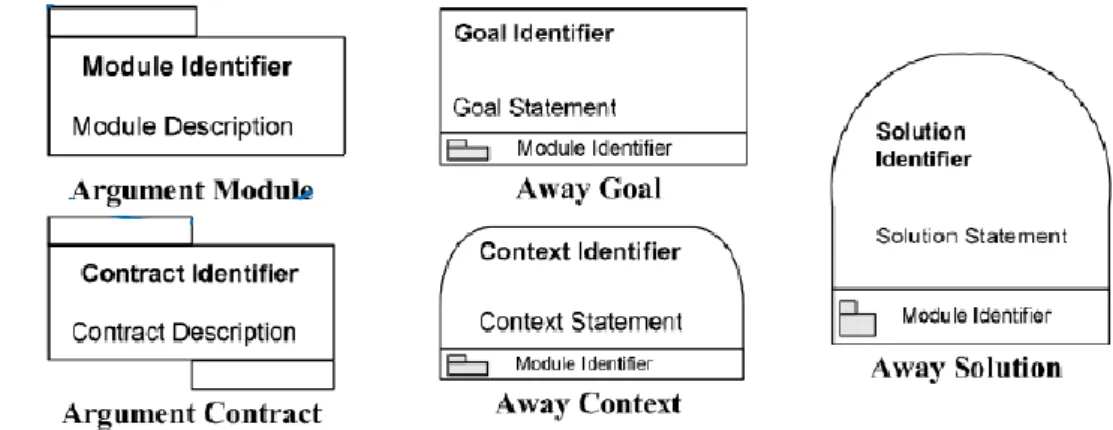
Figure 6: Elements of the GSN extended taken from [21]
A Module contains a part of the goal structure. An Away goal instead, is a goal used to support a claim within a module, but defined in another module. Away solution and Away
context are defined in the same way. Finally, a Contract is used to relate two modules, and it
defines how a claim in a module is supported by a goal in another module.
There can be some cases where a successful goal structures can be reused and applied also to a different context. In that case in order to systematize goal structures reuse a pattern can be defined [23] [24]. Patterns are defined to systematically reuse the same successful goal structure in different contexts.
In order to define patterns GSN has been extended [21] with the elements represented in Figure 7.
Figure 7: Pattern modeling elements
In a GSN pattern a goal could refer to a generic element, e.g. System X, instead of a specific systems, in order to be more general to allow the utilization of that goal structure for different systems. When a GSN element, e.g. a goal, contains a variable aspect, a white triangle at the base of the relative GSN symbol is used. In the case of a goal, when the pattern is used, the goal has to be instantiated considering the actual value the variable aspect.
Instead, when a goal needs to be further developed, a diamond shape at the bottom of the goal symbol has to be used.
diamond shape, with a horizontal line in the middle.
There can be some cases where a part of the goal structure is optional and can or cannot be present in the entire goal structure, in this case the optionality is represented through a white circle on the relative relation. Hence, when the pattern will be instantiated the optional part could be present or not based on the actual system for which the pattern is used.
Furthermore, an element could also be present multiple times in the goal structure with little variations. This multiplicity can be represented by a black circle on the relative relation and by an n indicating the number of possible instances.
Finally there can be the case where an option has to be taken among different choices and this can be represented by a diamond as starting point for different relations, each of them representing a choice.
A simple example of GSN pattern is shown in Figure 8.
Figure 8: Hazard avoidance pattern taken from [25]
As Figure 8 shows, the main goal of the pattern claims the safety of System X, where System X denotes a variable that needs to be instantiated with the name of the actual system. This goal is supported by claiming (by arguing) that all the plausible identified hazards have been addressed, in the context of the identified hazards for the System X. The number of hazards is represented by the variable n and for each hazard there is a different goal claiming that it has been addressed. This goals needs to be further developed. Hence, there will be n goals of the same type of the G2 goal and each of them will be instantiated with the identification name of the hazard and developed in a different way. Another patter can be combined with this, to show how each hazard has been addressed. Several GSN patterns are available in [25].
Using the available GSN modular and pattern extensions an approach for building configurable safety has been proposed in [26]. To support this approach the Obligation symbol has been introduced. An obligation describes a condition related to a point where a choice has to be made, within the goal structure. There can be two types of conditions:
Page 23 Intrinsic and extrinsic. Intrinsic conditions are the ones related to other elements of the same
goal structure, e.g. the presence of a goal can imply the presence of another one. Instead, extrinsic conditions are the ones related to external aspects of the safety case. E.g. a system design choice can influence the goal structure. An example of goal structure including an obligation is shown in Figure 9.
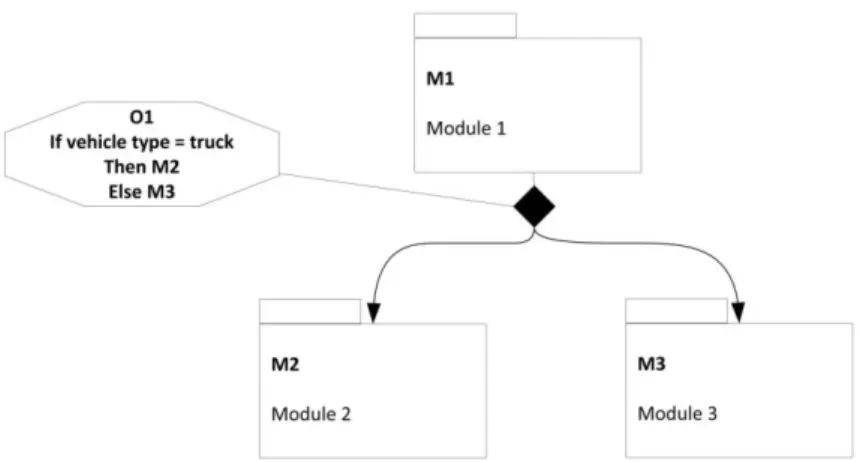
Figure 9: Example of configurable goal structure
As Figure 9 shows, in the presented goal structure there are tree modules: M1 is mandatory, while M2 and M3 are related by a XOR alternative. Thus either Module 2 or Module 3 will be present in the instantiated goal structure, depending on the vehicle type, as specified in the obligation O1.
2.5 Product line engineering
A (Software) product line is a set of (software-intensive) systems sharing a common, managed set of features that satisfy the specific needs of a particular market segment or mission and that are developed from a common set of core assets in a prescribed way [27]. A product line engineering (PLE) process [28] [29] is based on the identification and organization of common and variable aspects among the systems composing the product line, and using them to define artifacts, e.g. requirements or system architecture, for the entire product line, with the possibility to adapt them to each single system that compose it. Common aspects are called commonalities and variable aspects are called variabilities. A variability is represented by a variation point and the different possible choices for a variation point are called variants. Configuring all the variation points of product line it is possible to define a product line member (system).
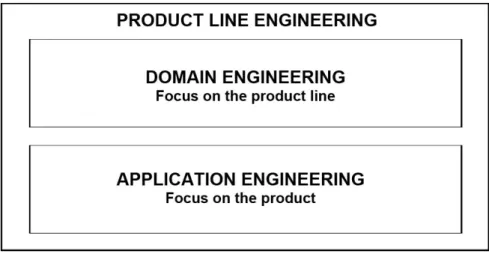
The product line engineering process (Figure 10) is divided basically into two phases:
domain engineering and application engineering phases.
During the domain engineering phase the entire product-line is defined, based on common and variable aspects identified during variability and commonality analysis [30]. During the application engineering phase instead, single products are defined configuring the variation points defined during the domain engineering phase.
Figure 10: Product line engineering phases
This engineering approach highly supports the systematic reuse, contributing in saving time and costs to develop new similar systems. The effort required during the domain engineering phase will be significant, but in the long run the time needed to create new systems or update existing ones will be significantly decreased.
Product lines can also be developed in the context of safety critical systems (Section 2.1). In that case they are called safety critical product lines, and as such there is need to perform all the safety activities necessary for safety critical systems.
2.6 Feature diagrams
Feature diagrams is a means to represent commonalities and variabilities for a product line in
terms of features, where a feature describes product characteristics from various stakeholder views: end-user, customer, analyst, architect, developer, etc [31]. Furthermore during the domain engineering phase they are an effective way to identify variability among different products in a domain [32].
In addition to represent common and variable features of a product line, with feature diagrams it is also possible to represent the relations among features. There can be three types or relations: mandatory, optional and alternative.
The mandatory relation indicates that the relative feature will be always present in all the product line configurations. Being in this way, core features of the product line.
The optional relation indicates that the relative feature can be optional. This means that a feature can be present in a system of the product line, but absent in another.
Finally the alternative relation is related to more than one feature. It indicates that only one of the relative features can be chosen. An example of feature diagram can be seen in Figure 11.
Page 25
Figure 11: Feature diagram example
This diagram should be interpreted as follows: Desktop PC has a CPU which is mandatory, meaning that a Desktop PC will always have a CPU. Bluetooth functionality, instead is optional, meaning that the user that by the PC can choose to have this functionality or not. Furthermore, for the same PC it is possible to have a dual core CPU or a quad core one, but not both of them.
As we saw in this example, feature diagrams can be used for the representation of configurable aspects in a product line, hence defining allowed product line configurations through different types of relation.
In addition to the intra-constraints on the feature selection within the same feature diagram, there could be also external constraints, influencing the feature selection. E.g. there could be constraints influencing directly the selection or exclusion of some features. These constraints could derive for example from environmental, human or technical choices, influencing in this way the product line configuration.
In the context of the example shown in Figure 11, if, for example, the context in which the PC will be used is an elementary school a Dual core CPU could be required. Because the software used in that level of education does not require powerful CPUs. While, for Universities a Quad core CPU could be used for the PCs, because university students could require powerful CPU to run their software.
2.6.1 Usage context
An important factor influencing the feature selection is the usage context. Informally, the usage contexts are any contextual settings in which a product is deployed or used, which can be detailed in terms of user, physical, social, business, operating environments, etc [33]. The usage context can also be represented through feature diagrams. In Figure 12 is presented the usage context in relation to the previous example, with the relative constraints on the feature selection of the feature diagram shown in Figure 10.
Figure 12: Usage context example
As we can see from Figure 12, a choice on the usage context have a direct impact on the feature selection of the feature diagram of the Desktop PC. Using a mapping table it is possible to define relations between the Usage context and the Desktop PC feature diagram. For example, if the type of education is Elementary then a required feature for the PC is the dual core CPU, while an excluded feature is the Bluetooth. Instead, if the type of education is University then, a required feature is the Quad core CPU and the Bluetooth.
2.7 Object Management
Group
(OMG)
Systems Modeling
Language (SysML)
The Object Management Group’s SysML (OMG SysML) is a general-purpose graphical modeling language for representing systems that may include combinations of hardware, software, data, people, facilities and natural objects. [34]
OMG SysML include diagrams that can be used to specify system requirements, behavior, structure and parametric relationships [35].
The focus of this chapter is on the behavior and structure aspects of OMG SysML. In more detail, the focus is on block definition and internal block diagrams, and activity diagrams.
2.7.1 Activity diagrams
An activity diagram represents the flow of data and control between activities [35]. The basic elements of activity diagrams are represented in Figure 13.
Page 27
The start and the end of the activities is represented respectively from the Initial state and
Final state symbols. Activities are represented through rounded rectangles. The arrows
represent the control flow (order in which the actions happen). Diamonds represent
decisions. When one arrow enters in the diamond and two or more exit, it is called decision node. While, if two or more arrows enter and one exits from the diamond, it is called merge node. Bars instead, represent the start and the end of concurrent activities. The constraint
symbol instead is used to represent constraints. When it is used in combination with a decision node, then there is the so called parameterization of the decision nodes.
An example of activity diagram is shown in Figure 14
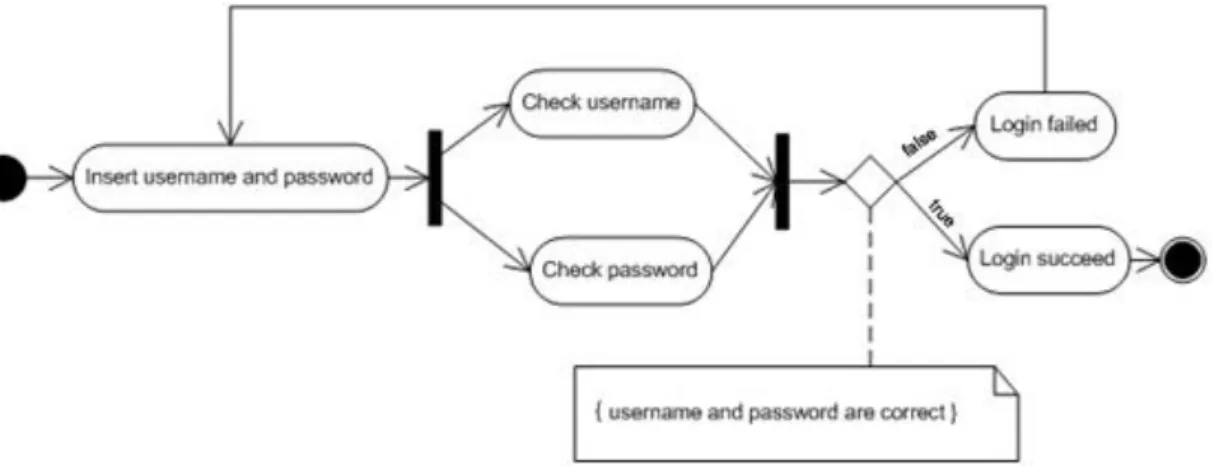
Figure 14: Example of an activity diagram
As Figure 14 shows, the first activity is inserting of username and password. After that there are two parallel activities, one checking the validity of the username and another one checking the validity of the password. Then, if the username and password are correct the login succeed and the activities end, while if they are not correct another possibility to insert them again is given, and this activities flow is repeated until that the inserted username and password are correct. This method of representing variability in activity diagrams has been taken from [36].
2.7.2 Block definition and internal block diagram
The system structure in OMG SysML is represented by block definition diagrams and internal
block diagram. A block definition diagram describes the system hierarchy and
system/component classification. The internal block diagram describes the internal structure of a system in terms of its parts, ports, and connectors [35].
Figure 15: Example of block definition and internal block diagrams taken from [37]
In Figure 15 a system is represented, through a block diagram, with two components, i.e. Controller and Motor, through internal block diagrams. The interfaces are represented through ports and the relations through links. From Figure 15we can see that the system is receiving input from two sensors and the values are read by the Controller, and after that the information is elaborated and sent to the Motor component.
2.7.3 Block definition and internal block diagram for product lines
In EAST-ADL [38] the block definition and internal block diagram has been used also to model product lines. In Figure 16 an example of how these diagrams are used to represent variability for product lines is shown.Figure 16: Example of variability with block diagrams taken from [37]
As Figure 16 shows, a variation point is indicated with an element with a dotted border. Then for the given variation point each variant is specified. We can also see that when the variant with the Controller1 is selected the S2 port is not present in the product line configuration. Furthermore, there is a mapping between each variant and the relative feature through a configuration link. This is to be able to define which variant for a given variation point, in the product line design model, has to be selected based on the correspond feature in the feature
Page 29
product line design.
In simple cases instead of defining a variation point, it could be enough to specify a variation group containing all the variants as shown in Figure 17.
Figure 17: Example of variability with block diagrams taken from [37]
As Figure 17 shows, this time there is not a variation point, but all the variants are represented in the variation group <<VAR_GROUP>>. The achieved result is the same as the example in Figure 16.
2.8 Hazard Analysis
The Hazard analysis [39] is a technique used to avoid failures in a system through the identification and analysis of hazards. Hazards are situations that could lead to a harm, causing also severe injuries to human life and damages to the surrounding environment. The hazard analysis can be performed at different levels. The Preliminary Hazard Analysis (PHA) is performed at the first stages of the system before the design phase; the System
Hazard Analysis (SHA) is performed instead during the system design phase; and the Sub-System Hazard Analysis is performed at sub-system level.
There can be some overlaps between hazard analyses. In this case the common hazards have to be merged together. Usually the hazard analysis at a lower level (e.g. sub-system level) is a refinement of the one of higher level (e.g. system level), since there is more detailed information available.
In general there are two types of hazard analysis approaches: inductive and deductive approaches. With inductive approaches a failure is observed and the relative consequences are evaluated (forward search). Instead, with deductive approaches failures are analyzed and the relative causes are deducted (backward search). Furthermore, there are also hazard analysis techniques combining both inductive and deductive approaches. These techniques are called bowtie techniques, since they combine forward and backward searching techniques.
An available techniques for the inductive hazard analysis is the Failure mode, Effects and
Criticality Analysis (FMECA) [39]. An example of deductive hazard analysis is the Fault Tree
and OPerability analysis (HAZOP) (Section 2.9.1).
2.8.1 Hazard and operability analysis
Hazard and Operability analysis (HAZOP) [40] is an hybrid hazard analysis technique, to
analyse system deviations and determine their effects. HAZOP analysis is based on the analysis of deviations of the normal behaviour of the system. Identification of such deviation is done systematically using a set of attributes (e.g. value, occurrence, timing) combined with guide words (e.g. higher, lower, omission, commission, early, late).
By combining attributes and guide words it is possible to analyse system deviations and evaluate their effect, discovering in this way potential hazards. Not all the possible combinations are considered, but only the ones that have a plausible meaning. For example a plausible combination of attributes and guide words could be, value higher, value lower, occurrence omission, occurrence commission etc.
These deviations are analysed for an item of the system, e.g. system function, and the relative consequences are derived. The result of this analysis is stored in the HAZOP table. The basic structure of a HAZOP table is represented in Table 6.
ID Item/interaction Attribute Guide word
Deviation Consequences Causes
Table 6: Basic structure of a HAZOP table
The information included in the HAZOP table presented in Table 6 are: - ID: The identification of the deviation;
- Item/interaction: The item that is being considered, e.g. flow of signals, messages, data, system function etc.;
- Attribute: Attribute being considered for the deviation, e.g. value, occurrence, timing etc.;
- Guide Word: A guide word that has a plausible meaning combined with the attribute, e.g. higher, lower, commission, omission etc.;
- Deviation: The deviation from the correct system behaviour derived from the relative combination of the attribute and guide word.
- Consequences: The consequences of the considered deviation; - Causes: The possible causes of the considered deviation;
Using this technique many hazards of a system can be discovered. Identified hazards can be used to improve system safety, through the implementation of safety measures addressing the identified hazards. This process of hazard mitigation is called risk assessment process.
In order to be compliant with ISO 26262, HAZOP table has been extended in [10], adding four additional columns, i.e. Exposure (E), Controllability (C), Severity (S) and ASIL. The extended table is presented in Table 7.
Page 31 ID Item/interaction Attribute Guide
word
Deviation Consequences E C S ASIL Causes
Table 7: Extended HAZOP table taken from [10]
These additional columns corresponds to the parameters required by ISO 26262 described in Section 2.2.1 for hazard analysis. In this way, for each identified hazard it is possible to define an ASIL, making the HAZOP analysis compliant with the safety standard.
2.8.2 Fault tree analysis
The Fault Tree Analysis (FTA) [39] is a deductive hazard analysis technique carried out at the system level. It is performed using a top-down approach, starting from one hazard and analyzing which and how events contribute to the hazardous event.
The result of the FTA is the fault tree . The fault tree is a tree where the top node is the hazard being considered, named top event. It can be connected to his children through logic gates. There are several types of logic gates. The main ones are the AND and OR gates. When events are connected to their parent through an AND gate, all of them need to occur in order to make the parent event occurring. While, if they are connected through an OR gate, only one of them needs to occur in order to make the parent event occurring. The events at the base of the tree are named basic events.
Events in the fault tree are represented through rectangle shapes and basic events through circle shapes. Instead, the AND and OR gates are represented by the symbols in Figure 18.
Figure 18: Fault tree symbols
A simple example of fault tree is presented in Figure 19.
As Figure 19 shows, the system can fail if the hardware or the software fails. The basic events are connected to the top event through an OR gate. This means that if there is a hardware failure the system will fail independently from the software and vice versa. From this fault tree we could argue that the system can fail in a very easy way and safety measures are necessary to avoid a system failure or make it more difficult to occur.
2.8.3 Hazard Analysis for product lines
The product line hazard analysis [41] is slightly different compared with the hazard analysis for single products. For such hazard analysis there are more aspects to be considered, e.g. product line variants, since that for a hazard of a product line member there could be different causes compared with another product line member, e.g. because the system architecture between the product line members is different.
Hence, the product line hazard analysis must also consider all the variants related to the product line members in order to be considered valid for the entire product line. An investigation of several hazard analysis techniques for product lines can be found in [42]. In the next section an FTA approach for product lines is described.
2.8.3.1
Product line Fault Tree Analysis
Product lines are set of similar systems and as such the fault tree analysis used to analyze the causes of hazards for single systems is not enough. Hence, an analysis addressing the variabilities of product lines is needed. A (Software)FTA approach for product lines is presented in [43] and it is briefly described in this section.
To manage product line variabilities in a fault tree, they need to be explicitly related to the event(s) of the fault tree. When a specific variant is present in a product line configuration, then also the related fault tree event(s) should be included in the fault tree. The events related to the product line commonalities instead, will be always present in the fault tree, since they are related to aspects that are always present in all the systems of the product line. Once that the fault tree has been defined for the product line, a refinement process, to make it valid for single systems is needed.
In Figure 20 an example of software fault tree for product lines and the relative refinement for one product is presented.
Page 33
Figure 20: Fault tree for product lines based on the notation used in [43]
For the example of Figure 20 we assume that two variabilities for a product line have been identified during commonality and variability analysis, e.g. V1 and V2. V1 and V2 are related respectively to a hardware failure event and software failure event in the fault tree. When the variability V1 will be present in the product line configuration then, also the hardware failure event in the fault tree will be present. While, if V2 is not present in the product line configuration, the relative event in the fault tree, i.e. Software failure, will be not present. This means that when the variability V1 is in the product line configuration only hardware failures can cause a system failure.
When events related to product line variabilities are removed from the product line fault tree, it could be needed a refinement of the fault tree, e.g. when two events are connected to a logic gate and one of them is related to a variability that is not included in the product line configuration, the relative logic gate has no reason to exists and there can be a direct link between the parent and child event without any logic gate. The result of the refinement for the considered Fault tree is represented in Figure 20.
2.9 Fuel Level Display systems
The Fuel Level Display System (FLDS) is a system used in Scania’s trucks and buses to estimate and show the fuel level to the driver, and to activate an alarm when the fuel level is low. The FLDS is used both in trucks and buses, and different versions of the system exist. Scania produces trucks and buses with liquid and gas fuel engine, and to a different vehicle type and fuel type corresponds a different version of the FLDS. This is because, for example, a different tank type or different fuel sensors can be used and these differences have an impact on the FLDS.
In addition to the vehicle type and fuel type there are also other aspects that influence the FLDS. These aspects are: the injection system, fuel volume, number of fuel tanks etc. For simplicity, however, only the vehicle type and fuel type will be considered as aspects that have an influence on the FLDS. The other parts of the vehicle will be ignored, assuming that they don't influence the FLDS. For this thesis only vehicles with one fuel tank will be
considered.
As mentioned above the FLDS has two main functionalities: 1- Showing the fuel level to the driver
2- Alerting the driver when the fuel level is low.
The fuel level is presented to the driver through a gauge and a warning light is used for signaling a low fuel level. Both functionalities are present in trucks and buses with liquid fuel engine and buses with gas fuel engine. While, in trucks with gas fuel engine the low fuel level warning functionality is not present, because of technical constraints.
The FLDS is composed by several Electronic Control Units (ECUs) connected each other through a CAN bus, and depending on the priority of the messages sent and received from and to one ECU, it is connected to a different CAN bus. The red can bus is used for messages with high priority and the yellow one for medium-priority messages. For simplification purposes, it will be assumed that all the ECUs are connected through only one CAN bus.
The ECUs composing the FLDS are:
- Instrument cluster system (ICL) : it is responsible to set the position of the gauge’s
needle and activates the low fuel level alarm when needed. For buses it is also responsible to determine if the fuel level is low.
- Coordinator (COO): it is the main ECU and it is responsible for the fuel level
estimation. For trucks with liquid fuel engine it is also responsible to determine if the fuel level is low.
- Engine Management System (EMS): it is responsible to calculate the fuel
consumption rate for trucks with liquid fuel engine, while for trucks and buses with gas fuel engine it is responsible to read the fuel level in the tank.
- Body chassi system (BCS): for buses with two fuel tanks it is responsible to read the
fuel level in the second tank, but since that only buses with one fuel tank have been considered, it only forwards back the received messages.
- BCI1: It is responsible to read the status of the parking brake in trucks with liquid fuel engine.
To a different version of the system corresponds a different ECU configuration. In Figure 21 the system architecture for trucks with liquid fuel engine is presented.
Page 35
Figure 21: ECUs configuration for trucks with liquid fuel engine
In this type of vehicles the BCI1 reads the status of the parking brake, the EMS reads the fuel consumption rate and they send this information to the COO. The COO reads the fuel level in the tank and estimate the actual fuel level applying a Kalman filter to reduce the noise. The information received from BCI1 and EMS is also used in the estimation process. After that the fuel level has been estimated, COO determines if the fuel level is low and send these information to the ICL. Then, the ICL sets the position of the gauge’s needle and activates the low fuel level warning if needed, based on the messages received from COO.
Figure 22: ECUs configuration for trucks with gas fuel engine
For trucks with gas fuel engine there is a different ECUs configuration as we can see from Figure 22. In these vehicles the EMS reads the fuel level in the tank and no filter is applied on the read value. Then, it sends this information to the COO that forwards it to the ICL. At this point the ICL sets the position of the gauge’s needle based on the fuel level. In these vehicle the low fuel level warning functionality is not present, because of technical constraints.
Figure 23: ECUs configuration for buses with liquid fuel engine
The ECUs configuration for buses with liquid fuel engine is depicted in Figure 18. In this vehicles the COO estimates the fuel level applying a Low-Pass filter on the fuel level read from the tank, to reduce the noise. Then, COO sends the estimated fuel level to the BCS that forwards it back to the COO. After that, the COO sends the fuel level to the ICL that sets the position of the gauge’s needle and determines if the fuel level is low, activating the relative warning if needed.
Figure 24: ECUs configuration for buses with gas fuel engine
Finally, the ECUs configuration for buses with gas fuel engine is shown in Figure 24. In this type of vehicles, the EMS reads the fuel level in the tank and sends this information to the COO without applying any filtering. The COO sends the fuel level to the BCS that forwards it back to the COO. Then the COO sends the fuel level to the ICL that sets the position of the gauge’s needle and determines if the fuel level is low, activating the relative alarm if needed.
![Table 5: System Design Analysis taken from [11]](https://thumb-eu.123doks.com/thumbv2/5dokorg/4725699.124875/17.892.109.789.432.583/table-system-design-analysis-taken-from.webp)
![Figure 3: Design life-cycle and Safety case life-cycle taken from [12]](https://thumb-eu.123doks.com/thumbv2/5dokorg/4725699.124875/18.892.166.730.755.952/figure-design-life-cycle-safety-case-cycle-taken.webp)
![Figure 5: An Example Goal Structure taken from [3]](https://thumb-eu.123doks.com/thumbv2/5dokorg/4725699.124875/20.892.224.684.307.636/figure-example-goal-structure-taken.webp)
![Figure 8: Hazard avoidance pattern taken from [25]](https://thumb-eu.123doks.com/thumbv2/5dokorg/4725699.124875/22.892.302.642.362.752/figure-hazard-avoidance-pattern-taken.webp)

![Figure 15: Example of block definition and internal block diagrams taken from [37]](https://thumb-eu.123doks.com/thumbv2/5dokorg/4725699.124875/28.892.177.721.103.318/figure-example-block-definition-internal-block-diagrams-taken.webp)
