Sogol Kharrazi
Fredrik Bruzelius
Ulf Sandberg
Performance based standards for
high capacity transports in Sweden
FIFFI project 2013-03881 – Final report
VTI r
apport 948A
|
P
erformance based standar
ds for high capacity tr
ansports in Sweden
www.vti.se/en/publications
VTI rapport 948A, revised edition 1
Published 2017
VTI rapport 948A
Performance based standards for high
capacity transports in Sweden
FIFFI project 2013-03881 – Final report
Sogol Kharrazi
Fredrik Bruzelius
Ulf Sandberg
VTI rapport 948A, revised edition 1 Diarienummer: 2013/0539-8.1
Omslagsbilder: Volvo och VTI/Eva Åström Tryck: VTI, Linköping 2017
Abstract
Project “Performance Based Standards for High Capacity Transports in Sweden” started at the end of 2013 to investigate applicability of PBS in Sweden, and ended in Autumn 2017. The purpose of the project was to propose a performance based regulation of HCT vehicles and their access to the road network; under a PBS approach to regulation, standards would specify the performance required from the vehicle, rather than mandating prescriptive length and weight limits. In this project, all the three domains of safety, infrastructure and environment were addressed, but the focus has been on safety for which extensive testing, simulations and analysis were performed. This report gathers the outcomes of the project.
Title: Performance based standards for high capacity transports in Sweden
FIFFI project 2013-03881 – Final report
Author: Sogol Kharrazi (VTI)
Fredrik Bruzelius (VTI) Ulf Sandberg (VTI)
Publisher: Swedish National Road and Transport Research Institute (VTI)
www.vti.se
Publication No.: VTI rapport 948A
Published: 2017
Reg. No., VTI: 2013/0539-8.1
ISSN: 0347-6030
Project: Performance based standards for high capacity transports in Sweden
Commissioned by: Vinnova
Keywords: Performance based standards, high capacity transport, safety,
infrastructure, environment
Language: English
Referat
Projektet “Performance Based Standards for High Capacity Transports in Sweden” startade i slutet av 2013 för att undersöka möjligheterna att applicera prestandabaserade kriterier, eller Performance Based Standards (PBS), i Sverige. Projektet avslutades hösten 2017. Vid prestandabaserade föreskrifter så specificeras kriterier eller standarder för en prestandanivå som ett fordon måste uppfylla, istället för att bestämma hur samma prestandanivå skulle uppnås genom att sätta gränser för fordonets längd eller vikt. I PBS-projektet har de tre domänerna säkerhet, infrastruktur och miljö beaktas, men fokus var på säkerhet och därför har omfattande testning, simulering och analys genomförts. Denna rapport beskriver resultatet från projektet.
Titel: Prestandabaserade kriterier för högkapacitetstransporter i Sverige
FIFFI projekt 2013-03881 – Slutrapport
Författare: Sogol Kharrazi (VTI)
Fredrik Bruzelius (VTI) Ulf Sandberg (VTI)
Utgivare: VTI, Statens väg och transportforskningsinstitut
www.vti.se
Serie och nr: VTI rapport 948A
Utgivningsår: 2017
VTI:s diarienr: 2013/0539-8.1
ISSN: 0347-6030
Projektnamn: Prestandabaserade kriterier för högkapacitetstransporter i Sverige
Uppdragsgivare: Vinnova
Nyckelord: Prestandabaserade kriterier, högkapacitetstransporter, säkerhet,
infrastruktur, miljö
Språk: Engelska
Preface
This report includes the outcomes of the project: “Performance Based Standards for High Capacity Transports in Sweden”, supported by Vinnova with the reference number: 2013-03881. The project was coordinated by the Swedish National Road and Transport Research Institute (VTI); other parties involved in the project were Chalmers University of Technology, Volvo Group Trucks Technology, Scania, Parator Industri AB, Swedish Transport Administration (Trafikverket) and Swedish Transport Agency (Transportstyrelsen).
I would like to acknowledge certain individuals from the project partners who were of great help during the project:
• Niklas Fröjd, Lena Larsson, Emil Pettersson, Magnus Olbäck, Per-Uno Sturk, and Anders Berger (Volvo)
• Jolle Ijkema, Magnus Staaf and Ulf Ceder (Scania)
• Bengt Jacobson, Manjurul Isalm, Peter Sundström and John Aurell (Chalmers)
• Thomas Asp, Anders Berndtsson, Peter Lindqvist, Åke Löfqvist, Robert Ronnebrant, Peter Smeds and Petter Åsman (Trafikverket)
• Anders Gunneriusson, Omar Bagdidi, Lars Rapp, Mats Willen and Per Öhlund (Transportstyrelsen)
• Per Olsson (Parator).
I would also like to thank colleagues at VTI who helped with conducting the driving simulator study and other tasks within the project: Anders Andersson, Bruno Augusto, Mattias Hjort, Jonas Ihlström, Eleni Kalpaxidou, Robert Karlsson, Erik Olsson, Frida Reichenberg, Jesper Sandin and Beatrice Söderström.
All the pictures in the report are provided by Volvo, if not mentioned otherwise. Linköping, December 2017
Sogol Kharrazi Project leader
Revision history
Revision Date Section
1 2020-09-17 Section 4.2, second paragraph, page 26 and first paragraph,
page 27 and captions of Figures 12 and 13. Appendix A, Legend of Figure 48.
Quality review
External peer review was performed on 5 December 2017 by Jolle Ijkema, Scania and Niklas Fröjd, Volvo. Sogol Kharrazi has made alterations to the final manuscript of the report. The research director Jonas Jansson examined and approved the report for publication on 12 December 2017. The
conclusions and recommendations expressed are the authors’ and do not necessarily reflect VTI’s opinion as an authority.
Kvalitetsgranskning
Extern peer review har genomförts 5 december 2017 av Jolle Ijkema, Scania and Niklas Fröjd, Volvo. Sogol Kharrazi har genomfört justeringar av slutligt rapportmanus. Forskningschef Jonas Jansson har därefter granskat och godkänt publikationen för publicering 12 december 2017. De slutsatser och rekommendationer som uttrycks är författarnas egna och speglar inte nödvändigtvis myndigheten VTI:s uppfattning.
Contents
Summary ...9
Sammanfattning ...11
1. Introduction ...13
1.1. PBS project ...13
1.2. Infrastructure aspects of HCT vehicles ...14
1.3. Environmental aspects of HCT vehicles ...15
1.4. Safety & manoeuvrability aspects of HCT vehicles ...15
1.5. Representative fleet ...17
1.6. Report layout ...18
2. Test track experiments ...19
2.1. High speed lateral stability ...19
2.2. Roll stability ...20
2.3. Braking stability ...21
2.4. Traction and low speed tracking ...22
3. Vehicle models ...23
3.1. Tyre model ...23
3.2. Sample validation results ...24
4. Heavy vehicles performance, winter versus summer ...25
4.1. Traction ...25
4.2. Low speed tracking ...26
4.3. High speed tracking ...28
4.4. Low speed stability ...30
4.5. High speed stability ...33
4.6. Braking ...35
5. Assessment procedure ...36
5.1. Traction ...36
5.1.1. Simple expression for startability ...36
5.1.2. Simple expression for gradeability ...36
5.1.3. Simple expression for acceleration capability ...37
5.1.4. Comparison results...37
5.2. Low speed tracking ...39
5.3. High speed tracking and stability ...41
5.4. Steady-state rollover threshold ...42
5.4.1. Vehicle roll stiffness and effective tyre lateral stiffness ...42
5.4.2. Calculation of SRT ...43
6. Driving simulator study ...45
6.1. Driving simulator ...45
6.2. Driving scenario ...46
6.3. Tested vehicle combinations ...46
6.4. Test drivers and collected data ...47
6.5. Simulator study results ...47
6.5.1. Realism of the driving experience ...47
6.5.3. Comparison of HCT and conventional vehicles by the drivers ...51
7. Noise Emissions ...52
7.1. The vehicle noise simulation tool ...52
7.2. Tyre noise data ...53
7.3. Power unit noise ...54
7.4. Simulation results ...55
7.5. A note regarding maximum noise levels ...57
8. Discussion ...58
8.1. Outlook...61
8.2. Project publications ...61
References ...63
Appendix A. Model validation against test data, summer tests ...65
Appendix B. Model validation against test data, winter tests ...67
Appendix C. Questionnaire after driving each vehicle ...69
Summary
Performance based standards for high capacity transports in Sweden. FIFFI project 2013-03881. Final Report
by Sogol Kharrazi (VTI), Fredrik Bruzelius (VTI) and Ulf Sandberg (VTI)
The transport sector is facing a major challenge to reduce energy consumption and limit environmental impact; therefore, there is a great interest in increasing the efficiency of the transport system in
Sweden, which makes the High Capacity Transports (HCT) an attractive solution. The existing legislation in Sweden, allows heavy vehicle combinations with maximum length of 25.2 meter and maximum weight of 64 tons on the road network. However, the government is considering allowing heavier vehicles up to 74 tons on a designated part of the road network.
To introduce HCT vehicles in Sweden, the existing regulations should be modified and a proper way of regulating HCT vehicles and their access to the road network should be developed to ensure that a certified HCT vehicle would not have negative effects on traffic safety, infrastructure and the environment. One approach is to use performance based standards (PBS) for regulation of heavy vehicles access to the road network; under a PBS approach to regulation, standards would specify the performance required from vehicle, rather than mandating prescriptive length and weight limits. The inherent flexibility in the PBS approach allows industry to develop innovative vehicles optimized for different applications. PBS has been implemented in Australia, Canada, and New Zealand, and is under trial in South Africa.
In this scope, the project “Performance Based Standards for High Capacity Transports in Sweden” started at the end of 2013 to investigate the applicability of PBS in Sweden. The project objective was to propose a regulatory framework based on PBS by identifying a set of performance based standards suitable for Sweden, with attention to winter road conditions. The project ended in September 2017 and this report presents its main outcomes.
In the PBS project all the three domains of safety, infrastructure and environment were addressed; however, the focus has been on safety and manoeuvrability. All the existing regulations with respect to environmental aspects of heavy vehicles are already performance based; thus, proposing new
standards for HCT vehicles was deemed to be unnecessary. However, to address the concerns about the noise emissions of HCT vehicles, a short simulation study was performed on comparison of noise emissions of a conventional and an HCT vehicle. The study showed that the resulting noise emission for a certain transport task is very similar for both vehicles. The infrastructure aspects, which has been focused on road network categorization with respect to 74 tons vehicles, was mostly performed by Trafikverket, results of which can be found in Trafikverket reports on the topic.
During the PBS project, extensive research was performed on safety aspects of HCT vehicles, resulting in a proposal of a PBS scheme, using test track experiments, offline simulations and driving simulator studies. The achieved results showed that a PBS scheme is a better means to evaluate performance of heavy vehicles than length or weight. Furthermore, the driving simulator study displayed a strong correlation between the perceived performance of the vehicles by the drivers and the studied performance measures.
One of the main objectives of the PBS project was to investigate the applicability of PBS in Sweden with attention to winter road conditions. Thus, the safety aspects which should be considered with respect to winter conditions were investigated, resulting in proposals for safe performance levels. Furthermore, the required complexity of models for accurate assessment of heavy vehicles with respect to the performance measures in the proposed PBS scheme were identified.
Sammanfattning
Prestandabaserade kriterier för högkapacitetstransporter i Sverige. FIFFI projekt 2013-03881. Slutrapport
av Sogol Kharrazi (VTI), Fredrik Bruzelius (VTI) och Ulf Sandberg (VTI)
Transportsektorn står inför stora utmaningar när det gäller att minska energiförbrukning och miljöpåverkan. Ett attraktivt alternativ för att effektivisera transportsystemet i Sverige är att öka kapaciteten hos tung trafik genom att tillåta längre och tyngre fordon, på engelska kallade High Capacity Transport (HCT) fordon. Den nuvarande lagstiftningen i Sverige tillåter tunga fordons-kombinationer med en maximal längd av 25,25 meter och en maximal vikt på 64 ton. Men regeringen har planer att tillåta tyngre fordon upp till 74 ton på en bestämd del av vägnätet.
För att kunna introducera HCT-fordon i Sverige så behöverregelverk och föreskrifter utvecklas för att säkerställa att ett certifierat HCT-fordon inte har negativa effekter på trafiksäkerhet, infrastruktur och miljö. En variant för att reglera tunga fordons tillträde till vägnätet är att använda prestandabaserade kriterier, eller Performance Based Standards (PBS). Vid prestandabaserade föreskrifter så specificeras kriterier eller standarder för en prestandanivå som ett fordon måste uppfylla istället för att sätta gränser för fordonets längd eller vikt. Den större flexibiliteten inom PBS-konceptet gör det möjligt för
industrin att utveckla innovativa fordon som är optimerade för specifika ändamål. PBS används i Australien, Canada och Nya Zeeland, och provas i Sydafrika.
För att utreda möjligheterna till en introduktion av PBS i Sverige så startade projektet “Performance Based Standards for High Capacity Transports in Sweden” i slutet av 2013. Syftet med projektet var att föreslå ett prestandabaserat regelverk för HCT-fordon och deras tillträde till vägnätet i Sverige med hänsyn till svenska förhållanden och vinterväglag. Projektet avslutades i september 2017 och denna rapport presenterar projektets huvudresultat.
I PBS-projektet behandlades alla tre domänerna av säkerhet, infrastruktur och miljö med fokus på säkerhet och manövrerbarhet. Alla befintliga regelverk med avseende på miljöaspekter för tunga fordon är redan prestationsbaserade. Därför ansågs det vara onödigt att föreslå nya standarder för HCT-fordon, men för att utreda frågor om bullerutsläpp från HCT-fordon genomfördes en kort simuleringsstudie. Studien jämförde bullerutsläpp från ett konventionellt och ett HCT-fordon och visade att de resulterande bullerutsläppen för en viss transportuppgift är liknande för båda typerna av fordon. Infrastrukturaspekterna, som har varit inriktade på kategorisering av vägnätet med avseende på 74 ton tunga fordon, utfördes främst av Trafikverket.
Under PBS-projektet genomfördes en omfattande studie om säkerhetsaspekter av HCT-fordon som resulterade i ett förslag till PBS-system, med hjälp av försök på provbana, simuleringar och
körsimulatorstudier. Resultaten visade att ett PBS-system är ett bättre sätt för att utvärdera prestanda hos tunga fordon än fasta krav på längd eller vikt. Vidare visade körssimulatorstudien att det finns en stark korrelation mellan lastbilsförarnas uppfattade prestanda av fordonen och de studerade
prestandamåtten.
Ett av huvudsyftena med PBS-projektet var att undersöka användbarheten av PBS i Sverige med hänsyn till vintervägarna. Säkerhetsaspekter som bör beaktas med hänsyn till vinterförhållanden undersöktes vilket har resulterat i förslag på säkra prestandanivåer. Dessutom identifierades erforderlig modellkomplexitet för korrekt bedömning av tunga fordon med avseende på prestandamått i det föreslagna PBS-systemet.
1.
Introduction
The large increase in the goods transport demands, the growing congestion problem and the environmental concerns over transportation emissions and fuel consumption, make High Capacity Transport (HCT) vehicles an attractive alternative to the conventional heavy vehicle combinations on the road; an alternative which is also expected to result in significant economic benefits. HCT refers to introduction of heavy vehicle combinations with higher capacity (longer and/or heavier vehicles) than the existing vehicles on the roads. With HCT vehicles, the existing capacity in the road infrastructure can be utilized efficiently without requiring too high investments, and the goods can be transported with fewer vehicles. It is expected that this will result in a reduction in the transport cost, fuel consumption, emissions and the traffic congestion.
The existing legislation in Sweden, allows heavy vehicles with maximum length of 25.25 m and maximum weight of 64 t. However, the government is considering allowing heavier vehicles up to 74 t on a designated part of the road network, which will be classified as a new category of roads with higher bearing capacity. The new road class, BK4, will be added to the existing three classes with bearing capacities BK1-3 (Trafikverket 2016).
Dispensations of longer and heavier HCT vehicles for trial periods have been granted in the recent years, which have shown considerable CO2-reduction, fuel saving and improved transport economy
(Cider & Ranäng 2013, Skogforsk 2013, Adell et al. 2014). According to Skogforsk website, as of Autumn 2017, 50 vehicles have been operating in the dispensation program, saving about 10 million litres of diesel and 25 000 tons of CO2, since 2009.
To gain more knowledge about HCT vehicles and their effects on traffic safety, infrastructure and environment, the Swedish government is undertaking a large research program focused on HCT vehicles in Sweden. One of the projects in the HCT program is “Performance based standards for high capacity transport in Sweden” project. Performance Based Standards (PBS) is a way of regulating HCT vehicles and their access to the road network. Under a PBS approach, standards would specify the performance required from the vehicle operations rather than mandating prescriptive length and weight limits. The inherent flexibility in the PBS approach allows development of innovative vehicles optimized for different applications, without negative effects on safety, infrastructure and
environment. PBS for regulation of heavy vehicles has been implemented in Australia, Canada, and New Zealand, and is under trial in South Africa. A review of these PBS approaches, and other relevant literature and regulations is published in the first report of the PBS project (Kharrazi et al. 2015).
1.1.
PBS project
The project “Performance based standards for high capacity transport in Sweden” started at the end of 2013 to investigate the applicability of PBS in Sweden and to propose a regulatory framework based on PBS by identifying a set of performance based standards suitable for Sweden, with attention to winter road conditions. The project ended in September 2017; this report presents its main outcomes. The PBS project was financed by Vinnova, reference number 2013-03881, and was part of the Swedish HCT program. The project was coordinated by VTI with partners from academia, industry and authorities. The project partners are:
1. The Swedish National Road and Transport Research Institute (VTI) 2. Chalmers University of Technology
3. Volvo Group Trucks Technology 4. Scania
5. Parator Industry AB 6. Trafikverket
In the PBS project all the three domains of safety, infrastructure and environment were addressed; but the focus has been on safety and manoeuvrability, for which extensive testing, simulations and analysis were conducted. In the following sections a brief overview of the performed tasks with respect to each domain is provided.
1.2.
Infrastructure aspects of HCT vehicles
The main pavement deterioration mechanisms and their relationship to heavy loads, as well as bridge bearing capacity calculations were described in the first report of the PBS project (Kharrazi et al. 2015). It was also recommended that the HCT vehicles should comply with the existing load axle regulations; however, a need for investigating effects of multiple heavy load passage on the road was identified. This issue has been investigated in another project, results of which can be found in the paper by Erlingsson et al (Erlingsson et al. 2018). Erlingsson et al conducted Indirect Diametrical Tensile (IDT) fatigue tests and Confined Triaxial Tests (CTT) in a laboratory to evaluate the impact of three heavy vehicle combinations with different axle configurations. The investigated vehicles were a 64t Nordic combination allowed on the Swedish roads, a 74 t Bdouble and a 74 t Adouble. The results demonstrated that when damage due to permanent deformation is concerned, the Bdouble and
Adouble vehicles cause less damage per ton of transported goods compared to the Nordic
combination. Furthermore, the Adouble caused less fatigue damage per ton compared to the Nordic combination. In other words, the load distribution and axle configuration play a more important role in the resulting road damage than the total weight of the vehicle. Further studies on measuring and comparison of damage to the road caused by conventional and HCT vehicles are planned. Four instrumented test road structures have been built in northern Sweden about 100 km north of the Arctic Circle, with cold winters, mild summers and a long spring thaw period. 16% of the traffic passing the instrumented road consists of heavy vehicles, and it is on the route of 90 t HCT vehicles of ore mining industry (Erlingsson et al. 2017). Additional instrumented road structures have been built on two local roads in North of Sweden, where timber vehicles pass.
One of the main tasks with respect to infrastructure in the PBS project, was the categorization of the Swedish road network with respect to HCT vehicles; Trafikverket was the main partner responsible for this task. Trafikverket efforts have mainly been focused on road network categorization with respect to 74t vehicles, results of which can be found in Trafikverket reports (Trafikverket 2014, Trafikverket 2016). Trafikverket has proposed introducing a new class of roads with higher bearing capacity, called BK4, for 74 t vehicles. Currently, the total length of the proposed BK4 road network is just under 8000 km, which corresponds to approximately 8 percent of the total national road network. The limited size of the proposed BK4 road network is due to shortcomings in the infrastructure, but also due to excluding roads where a risk of transport transfer from rail to road has been identified. Therefore, an analysis of the risk of transfer for excluded critical road stretches is advised.
One of the main components of the infrastructure that impose restrictions to HCT vehicles access to the road network, are bridges. One possible approach to assess effects of HCT vehicles on bridges is to consider more reference vehicles and update the gross weight curves accordingly. This approach has been used by Trafikverket and the resulting gross weight curve for heavy vehicles is shown in Figure 1. For more information see the Trafikverket report (Trafikverket 2014).
1.3.
Environmental aspects of HCT vehicles
The existing European regulations, also in effect in Sweden, on exhaust and noise emissions and fuel consumption were reviewed in the first report of the PBS project (Kharrazi et al. 2015). All the existing regulations with respect to environmental aspects of heavy vehicles are already performance based; thus, proposing new standards for HCT vehicles was deemed to be unnecessary. However, there are concerns about the noise emissions of HCT vehicles since a long heavy vehicle combination is equipped with more tyres. Therefore, a short study was performed on simulation and comparison of noise emissions of a conventional heavy vehicle and an HCT vehicle. The simulation results showed that the noise emission is not a factor that gives either vehicle type a clear advantage over the other. Further description of the study on the noise emission of HCT vehicles and the achieved results are provided in Chapter 7 of this report.
1.4.
Safety & manoeuvrability aspects of HCT vehicles
After reviewing the relevant literature and existing PBS schemes and regulations of heavy vehicles in different countries, a candidate set of performance measures for further investigation was identified in the beginning of the PBS project. The candidate measures, which are listed in Table 1, were grouped into four categories based on the practical goals they address (adapted from categorization by Fancher et al. 1989). The four categories are:
Traction: The heavy vehicle should be able to start motion, maintain motion and attain a desirable level of acceleration; measures that can be used to assess the vehicle performance with respect to these goals are listed in this category.
Tracking: The rear end of the vehicle and all the units within the vehicle combination should follow the path of the front end of the vehicle with adequate fidelity; measures that can be used to assess the vehicle performance with respect to this goal are listed in this category.
Stability: The vehicle should be stable, attain directional control and remain upright during
manoeuvring; measures that can be used to assess the vehicle performance with respect to these goals are listed in this category.
Braking: The vehicle should safely attain a desirable level of deceleration during braking; measures that can be used to assess the vehicle performance with respect to this goal are listed in this category. The selected measures for further investigation were mainly focused on traction, tracking and stability; since it was reckoned that the existing measures with respect to braking performance in ECE R13 regulations are suitable for the HCT vehicles as well (UNECE 2008). Thus, only braking stability in a turn, which does not exist in the ECE R13, was included in the further investigations. For more information about the candidate measures, see (Kharrazi et al. 2015).
Table 1. Candidate performance measures, identified in the beginning of the PBS project.
Performance measure Description
Tra
c
ti
o
n
Startability (SA) The maximum grade of the road on which the vehicle can
commence from a standing start
Gradeability (GA) The maximum grade of the road on which the vehicle can
maintain an acceptable speed
Acceleration capability (AC) The clearance time of the vehicle accelerating from standing
still L o w s p e e d tra c k in
g Frontal swing (FS) Swing out of the vehicle’s front corner in a low speed tight
turn
Tail swing (TS) Swing out of the vehicle’s rear corner in a low speed tight
turn
Low-speed swept path (LSSP) Total road width utilized by the vehicle in a low speed tight
turn Hig h s p e e d t ra c k in g
Tracking ability on a straight path (TASP)
Total road width utilized by the vehicle responding to the road unevenness, on a straight path at high speed
High-speed steady-state offtracking (HSSO)
The maximum distance between path of the rearmost axle of the vehicle and the prescribed path in a steady turn at high speed
High-speed transient offtracking (HSTO) The maximum distance between path of the rearmost axle of the vehicle and the prescribed path in a lane change at high speed L o w s p e e d s ta b ili
ty Friction demand of steer tyres (FDST) Demanded friction at the steer tyres for maintaining the
desired path in a low speed tight turn, indicating the proximity of loss of steerability
Friction demand of drive tyres (FDDT) Demanded friction at the drive tyres for maintaining the
desired path in a low speed tight turn, indicating the proximity of a jackknife Hig h s p e e d s ta b ili ty
Steady-state rollover threshold (SRT) The maximum steady lateral acceleration the vehicle can
withstand before rolling over
Load transfer ratio (LTR) The fractional change in the load carried on the left and right
tyres in a lane change at high speed, indicating the proximity of a lift off
Rearward amplification (RA) Amplification of motion (lateral acceleration or yaw rate) in
rear units of the vehicle in a lane change at high speed
Yaw damping ratio (YD) The rate at which the yaw oscillations of the vehicle settle
after a pulse steer input at high speed
Bra
k
in
g Braking stability in a turn (BS) Directional stability and controllability of the vehicle under
1.5.
Representative fleet
To study the candidate performance measures and their relevancy for assessing heavy vehicles performance, a representative fleet of heavy vehicles, including both prospective HCT vehicles and existing conventional heavy vehicles on Swedish roads, was selected; see Table 2.
Table 2. Representative fleet
No Axle configuration* Dimension Figure Vehicle Combination
1 TR4x2-ST3 16.5 m/40 t
Tractor-semitrailer
2 TR6x2-ST3 17.1 m/50 t
3 TR4x2-LT2-ST3 24.8 m/60 t
Tractor-link trailer-semitrailer, Bdouble
4 TR6x4-LT2-ST3 25.4 m/70 t
5 TR6x4-LT3-ST3 25.4 m/74 t
6 TR4x2-ST3-CT2 25.1 m/60 t
Tractor-semitrailer-centre axle trailer
7 TR6x4-ST3-CT2 25.7 m/70 t
8 TR6x4-ST3-DY2-ST3 31.0 m/89 t Tractor-semitrailer-dolly-semitrailer, Adouble
9 TR6x4-LT2-LT2-ST3 33.7 m/90 t
Tractor-link trailer-link trailer-semitrailer, Btriple
10 TR6x4-LT3-LT3-ST3 33.7 m/98 t
11 TK6x2-CT2 18.8 m/40 t
Truck-centre axle trailer
12 TK8x4-CT3 19.9 m/56 t 13 TK6x2-FT2+2 24.1 m/60 t Truck-full trailer 14 TK6x2-FT2+3 24.1 m/64 t 15 TK8x4-FT2+3 25.1 m/74 t 16 TK6x2-DY2-ST3 24.1 m/64 t Truck-dolly-semitrailer 17 TK8x4-DY2-ST3 25.2 m/74 t 18 TK6x2-CT2-CT2 27.6 m/64 t
Truck-centre axle trailer-centre axle trailer
19 TK6x4-CT3-CT3 28.4 m/74 t
20 TK6x4-DY2-LT2-ST3 32.4 m/80 t
Truck-dolly-link trailer-semitrailer, ABdouble 21 TK6x4-DY2-LT3-ST3 32.4 m/92 t
22 TK8x4-DY2-LT3-ST3 33.5 m/98 t
* TR=Tractor, TK=Truck, ST=Semitrailer, CT=Centre axle trailer, LT=Link trailer, FT=Full trailer, DY= Dolly
The number following each unit name indicates number of axles. For a full trailer, i+j format is used, where the first digit (i) indicates the number of axles at the front of the trailer and the second digit (j) indicates number of axles at the rear. For the motor vehicles, i.e. tractor and truck, the common format of ixj is used, where i is twice the number of axles and j is twice the number of driven axles.
One of the key issues investigated in the PBS project is the performance of the selected representative fleet with respect to candidate measures, both in summer and winter. Furthermore, the correlation between the candidate performance measures and the drivers’ perception of the vehicle performance; as well as the correlation between heavy vehicles performance during winter and summer, were studied. The results of the correlation studies can be used to assign required performance levels which ensure safe performance both under summer and winter conditions. It should be noted that in another subproject of the Swedish HCT program, called “HCT typfordonskombinationer” with the reference number 2015-02327, several HCT vehicles with high efficiency and safe performance, suitable for different transport missions are identified (Fröjd et al. 2017). Thus, in the PBS project the focus was on investigating the candidate performance measures and analysis of the corresponding performance of various heavy vehicles, rather than identifying the potential future HCT vehicles.
All the vehicles in the representative fleet were modelled to simulate the performance of the
representative fleet. Moreover, tests with a subgroup of the representative fleet were performed on the test track to further investigate the performance of the vehicles and to gather data for validation of the models. The simulations and experiments on test tracks were conducted under both winter and summer conditions.
Another subject studied in the PBS project is the required level of modelling details for assessing performance of heavy vehicles with respect to the candidate measures. This led to early steps toward development of a PBS tool for evaluation of heavy vehicles performance, which is an important part of an assessment procedure needed for implementation of a PBS-based regulatory framework.
1.6.
Report layout
In the coming chapters, first a summary of the test track experiments with the achieved results are provided, which is followed by a chapter on the vehicle models and validation against test track experiments. In Chapter 4, the results of the comparison study on performance of HCT vehicles in winter versus summer are provided, and it is followed by the outcomes of the assessment procedures and required model complexity investigation in Chapter 5. The driving simulator study, which was performed to examine the correlation between drivers’ perceived performance of HCT vehicles with objective measures in a PBS scheme, is discussed in Chapter 6. The short study on noise emissions of the HCT and conventional vehicles and its result are described in Chapter 7. The last chapter discuss the projects outcomes and concludes the report.
2.
Test track experiments
During the project, a series of tests were performed by Volvo and Scania. The aim with these tests were two-folded: to investigate the performance of HCT vehicles, as well as to collect data for virtual vehicle model validation. In this chapter a summary of test track results is provided.
2.1.
High speed lateral stability
The performed tests were conducted both in summer and winter. Different HCT vehicles were tested, as well as a few conventional heavy vehicle combinations as reference. Most of the performed tests were focused on high speed lateral stability of HCT vehicles, where rearward amplification (RA) and high speed transient offtracking (HSTO) in single lane change manoeuvres were measured/calculated. The obtained results from these tests are summarized in Table 3. It can be seen that the rearward amplification of yaw rate is higher for HCT vehicles in comparison with conventional heavy vehicle combinations. However, the rearward amplification is below 2.0 for all the tested vehicles. The offtracking is equal or below 0.7 m for all tested vehicles, except the last test with a 76 t Nordic combination (truck-dolly-semitrailer) which was performed on very slippery conditions (wet ice); it resulted in an offtracking of about 2 m. Another observation is that even for vehicle combinations of the same type, but with different dimensions and under different conditions, the performance can be quite different. Both Volvo and Scania have performed a single lane change manoeuvre in winter at speed of 65 km/h with a 74 t ABdouble combination (tests 6 & 10 in Table 3). However, the rearward amplification of yaw rate is much lower in the Volvo test, RA of 1.3 in comparison with 1.8 for the Scania test. This is due to different snow and friction conditions on the test track, different tyres and lane change style; also, due to the longer wheelbases of the truck and the link-trailer in the Volvo combination.
Table 3. Summary of single lane change tests in summer and winter
No Year & OEM Vehicle Combination Manoeuvre RA of yaw rate RA of lat. acc. Offtracking
Sum m e r 1 2014 Scania TR6x4-ST2-DY2-ST2 74 t, 25.7 m SLC, 80 km/h 1.8 - 0.7 m 2 2014 Scania TR6x4-LT3-ST3 74 t, 25.2 m SLC, 80 km/h 1.3 - 0.5 m 3 2014 Scania TR6x4-LT3-LT3-ST3 90 t, 30.5 m SLC, 70 km/h 1.8 - 0.7 m 4 2014 Volvo TR6x4-ST3-DY2-ST3 80 t, 32 m SLC, 80 km/h 1.6 1.8 - 5 2015 Volvo TR6x4-LT3-ST3 74 t, 23.4 m SLC, 80 km/h 1.8 1.9 - Wi nte r 6 2015 Scania TK6x4-DY2-LT2-ST3 74 t, 31.4 m SLC, 65km/h 1.8 - 0.7 m 7 2015 Scania TK6x4-DY2-ST3 57 t, 24.3 m SLC, 70 km/h 1 - 0.3 m 8 2015 Scania TR6x4-LT2-ST3 55 t, 24.4 m SLC, 70 km/h 0.7 - 0.1 m 9 2015 Volvo TR6x4-LT2-ST3 56 t, 24 m SLC, 70 km/h 0.9 1 - 10 2015 Volvo TK6x4-DY2-LT2-ST3 74 t, 31.3 m SLC, 65 km/h 1.3 1.1 0.6 m 11 2016 Volvo TK8x4-DY2-ST3 74 t, 23.5 m SLC, 65 km/h - - ~2 m
Figure 2. Test vehicles: B-triple, Scania summer test (Top, picture: Scania), ABdouble, Volvo winter test (Bottom, picture: Volvo).
2.2.
Roll stability
In 2014, Volvo performed tilt table tests on timber trailers, two of which can be used in 74 t combinations and weighed 42 t each, and the third one weighed 36 t and can be used in a 60 t combination. The purpose of the tests was to check and compare the steady state-rollover threshold (SRT) of timber trailers in the existing combinations on the road network and 74t vehicle
combinations. The results are presented in Table 4 (Volvo 2014). As expected the heavier trailers have a lower SRT level, due to the higher centre of gravity (about 10% higher). The difference in SRT levels seem to be correlated to the difference in centre of gravity height, and the lighter trailer has about 10% higher SRT. The 5-axle trailers have the same SRT values, although the load height is higher in the full trailer; this can be due to the higher rigidity of the turn table in the full-trailer,
compared with the fifth-wheel in dolly-semitrailer. In general, from roll stability perspective, it is safer to increase the length along with the weight for 74 t vehicles; so that centre of gravity is not too high. In 2015, Volvo tested the SRT of a high loaded 74 t Bdouble combination on a test track using rollover preventing outrigger wheels. The Bdouble combination had a 2.5-26 m centre of gravity height at the trailers, and without ESP it rolled over at 3.1-3.2 m/s2, which is similar to the tilt table
results. The combination did not roll over with ESP on, since the ESP function prevented reaching high levels of lateral acceleration (Volvo 2016a).
It should be noted that the roll stability of the combination was also tested in a dynamic lane change manoeuvre, in which the combination did not roll over. The lane change manoeuvres were performed with a 1.75 m/s2 lateral acceleration at the front axle at different frequencies. Considering the lateral
acceleration rearward amplification of 1.9 (see Table 3), the manoeuvre resulted in 3.3 m/s2 in the rear
unit in the worst frequency, without rollover. In a dynamic manoeuvre the steady-state value of rollover threshold can be exceeded to some extent, since it is transient.
Table 4. Results of tilt table tests of timber trailers 4-axle full trailer, 36 t
CG height 2.1 m
5-axle full trailer, 42 t CG height 2.4 m
5-axle dolly-semitrailer, 42 t CG height 2.3 m
Figure 3. Volvo tilt table test with a timber trailer.
Volvo also performed an additional tilt table test in 2016 with a centre axle trailer. The purpose of this test was to investigate the effect of single versus double mounted tyres on SRT of the trailer. As expected the trailer with single mounted tyres, with its larger track width, had a higher SRT.
Moreover, lower pressure in double mounted tyres resulted in even lower value of SRT, see Table 5.
Table 5. SRT of a centre axle trailer with single and double mounted tyres
Single 355/50 R22.5, 9.0 bar Twin 295/60 R22.5, 8.5 bar Twin 295/60 R22.5, 5.5 bar
SRT (m/s2) 4.55 4.15 4.05
2.3.
Braking stability
Volvo tested the stability of two HCT vehicles during braking at high speed in a curve in winter conditions. The first test was performed in winter 2015 on a 74 t ABdouble combination. The test results showed that the vehicle was stable during braking when the ABS function was working properly. But, malfunctioning of the ABS on any axle groups, resulted in large offtracking (Volvo 2017a). A similar test was conducted with a 76t Nordic combination (truck-dolly-semitrailer) in winter 2016. During this test, the track was very slippery (wet ice) and the maximum braking in curve was performed twice. The first test showed similar satisfactory results as in winter 2015; but, the second repetition of the test resulted in large deviation, about 10 m, between front and rear axles paths (Volvo 2016b).
Additionally, Volvo performed heavy braking in curve at 70 km/h on wet asphalt with a 74 t Adouble combination in 2015. The vehicle remained stable during braking. The stopping distance of the Adouble combination on a wet road surface at different speeds was measured as well, the results are provided in Table 6.
Table 6. Braking distance of a 74t Adouble on wet asphalt
Initial speed 50 km/h 60 km/h 70 km/h 80 km/h 90 km/h
Figure 4. Braking in a curve on wet asphalt with a 74t Adouble, Volvo summer test.
2.4.
Traction and low speed tracking
Volvo also performed traction tests and low speed turns with the 74t Adouble combination in 2015, to investigate the vehicle accessibility and manoeuvrability. The results are summarized in Table 7. It should be noted that for the hill start test, standard constant slope was not used due to space limitations; instead, a country road with progressive slope was used, which was postprocessed into equivalent constant slope for every starting position.
Table 7. Traction and tracking of a 74t Adouble
Achievable speed during hill climbing on a 5% slope 45 km/h
Hill start on a 12% slope passed
Acceleration capability on a flat road, 0-50 km/h 30 s
Acceleration capability on a flat road, 0-80 km/h 63 s
Low speed swept path in a turn with outer radius of 12.5m 7.8 m
3.
Vehicle models
The Volvo vehicle model library (VTM), with some modifications, was used to model the
representative fleet, presented in Table 2 in the introduction chapter. The vehicles are modelled as multibody mechanical systems, using SimMechanics toolbox in Matlab-Simulink. The representative fleet consists of 22 vehicles, including HCT vehicles, as well as conventional heavy vehicle
combinations allowed on the Swedish roads.
3.1.
Tyre model
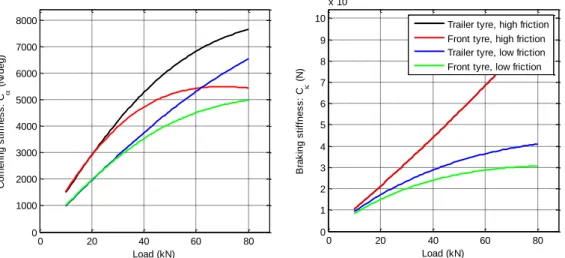
An important part of the vehicle models, is the tyre model; since the tyre characteristics influence the vehicle performance significantly. Thus, the models were validated against test data collected in both summer and winter, using two tyre models, one for summer conditions and one for winter. Due to the existing variety of tyres and the diversity of road surface condition, especially during winter, choosing one tyre for modelling is not a trivial task. The existing tyre data at VTI, measured at VTI tyre testing facility (Nordström 1993) or gathered in other projects were reviewed, which as expected showed a large diversity, see Figure 6. In this project, an average tyre was selected for each weather condition, see Figure 7. However, there is a need for further investigation of different tyre characteristics and tyre modelling and development of standard tyres for assessment of heavy vehicles performance.
Figure 6. VTI Sample tyre data at VTI for various tyres under diverse conditions. Cornering stiffness is the tyre ability to resist deformation while cornering and relates the side force to the slip angle.
Figure 7. Characteristics of the selected tyres for the vehicle fleet simulations in summer and winter.
0 10 20 30 40 50 60 0 1000 2000 3000 4000 5000 6000 7000 8000 Load (kN) C o rn e ri n g s ti ff n e s s : C ( N /d e g )
Sample tyre data for summer condition, high friction
0 10 20 30 40 50 60 0 1000 2000 3000 4000 5000 6000 7000 8000 Load (kN) C o rn e ri n g s ti ff n e s s : C ( N /d e g )
Sample tyre data for winter condition, low friction
0 20 40 60 80 0 1000 2000 3000 4000 5000 6000 7000 8000 Load (kN) C o rn e ri n g s ti ff n e s s : C ( N /d e g ) 0 20 40 60 80 0 1 2 3 4 5 6 7 8 9 10 x 105 Load (kN) B ra k in g s ti ff n e s s : C ( N )
Trailer tyre, high friction Front tyre, high friction Trailer tyre, low friction Front tyre, low friction
3.2.
Sample validation results
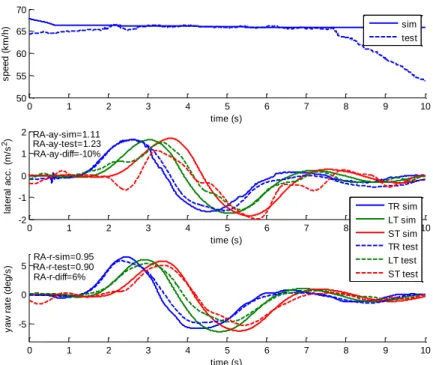
The simulation results for high speed lateral dynamics were compared with test data gathered by Volvo and Scania, presented in previous chapter. Test data for several vehicle combinations, both in summer and winter was used. Some tuning of the tyre cornering stiffness and friction level was allowed to match the test data to validate the models. The results show an acceptable level of accuracy of the models. Some sample results are shown in Figure 8 and Figure 9, where lateral performances of two Bdouble vehicles with different axle configuration in a lane change manoeuvre under summer and winter conditions are plotted. The error in estimated rearward amplification by simulation is bound to 10% for both vehicles. More heavy vehicles and test data were used for validation of the models, plots of which are provided in Appendix A and Appendix B. The error in estimated rearward amplification by simulation varies based on vehicle type and surface condition, but it is bound to 25% for all cases.
Figure 8. Lane change of a Bdouble (TR6x4-LT3-ST3, 25 m, 74 t) in summer, test versus simulation.
Figure 9. Lane change of a Bdouble (TR6x4-LT2-ST3, 24 m, 56 t) in winter, test versus simulation.
0 1 2 3 4 5 6 7 8 9 10 79 80 81 82 83 time (s) s p e e d ( k m /h ) sim test 0 1 2 3 4 5 6 7 8 9 10 -4 -2 0 2 time (s) la te ra l a c c . (m /s 2) RA-ay-sim=1.29 RA-ay-test=1.41 RA-ay-diff=-9% 0 1 2 3 4 5 6 7 8 9 10 -10 -5 0 5 10 time (s) y a w r a te ( d e g /s ) RA-r-sim=1.23 RA-r-test=1.33 RA-r-diff=-8% TR sim LT sim ST sim TR test LT test ST test 0 1 2 3 4 5 6 7 8 9 10 -5 0 5 time (s) te ta ( d e g ) A1 sim A2 sim A1 test A2 test 0 1 2 3 4 5 6 7 8 9 10 50 55 60 65 70 time (s) s p e e d ( k m /h ) sim test 0 1 2 3 4 5 6 7 8 9 10 -2 -1 0 1 2 time (s) la te ra l a c c . (m /s 2) RA-ay-sim=1.11 RA-ay-test=1.23 RA-ay-diff=-10% 0 1 2 3 4 5 6 7 8 9 10 -5 0 5 time (s) y a w r a te ( d e g /s ) RA-r-test=0.90RA-r-sim=0.95 RA-r-diff=6% TR sim LT sim ST sim TR test LT test ST test
4.
Heavy vehicles performance, winter versus summer
In this chapter the effect of road surface condition and tyre-road grip on the performance of heavy vehicle combinations is discussed, and correlation between the vehicle performance in winter and summer is explored. From a practical aspect, it is easier and less costly and time consuming to assess the performance of heavy vehicles for summer condition, and use the correlation between the vehicle performance in summer and winter to decide performance levels which ensure safe performance during winter as well, if such a correlation exist. It is also important to note that if a heavy vehicle is to be permitted on a certain road network, features of the roads also play a key role on the required level of performance from the vehicle. In this scope, the candidate performance measures listed in the introduction chapter have been studied with respect to high and low friction, results of which is summarized in this chapter.
4.1.
Traction
The traction measures, namely startability, gradeability and acceleration capability were calculated for a series of heavy vehicle combinations. The calculations were performed at Volvo using the detailed powertrain model which is widely accepted and used at Volvo. Less vehicles were considered in this study compared to the reference fleet, since the effect of axle configuration of the towed units on the traction measures is insignificant; the key factor is the normal load on the driven axles. Thus, only one axle configuration is considered for the 9 studied heavy vehicle combinations, presented in Table 8 The simulation results showed that the effect of tyre-road friction level on the gradeability is insignificant. However, the startability of the heavy vehicles deteriorate significantly with lower friction levels; on average the calculated startability on a low friction surface is only 10% of the startability on a high friction surface, see Figure 10. None of the considered heavy vehicle
combinations, not even the conventional vehicles, will be able to start on a grade higher than 5% when the tyre-road friction level is low. This is far from 12% which a heavy vehicle combination should be able to start on during summer conditions. One solution to overcome the startability issue of the heavy vehicles in winter is to allow exceeding the driver axle load limit during a brief time at start up, by axle lift or other means of load transfer to drive axles.
The Volvo model does not handle the low friction for calculation of the acceleration capability; thus, a simpler model was used for this purpose. As expected, the results showed that the acceleration
capability decreases in winter conditions. However, effect of low friction on acceleration capability is not as significant as the effect on startability.
Table 8. Heavy vehicle combinations simulated for the traction study
No Vehicle combination Dimension Load on driven axles Figure
1 TR6x4-ST3 16.5 m/40 t 12 2 TR6x4-ST3-CT2 25.2 m/60 t 12 3 TR6x4-LT3-ST3 30.9 m/80 t 19 4 TR6x4-ST3-DY2-ST3 31.5 m/80 t 19 5 TR6x4-LT3-LT3-ST3 33.8 m/90 t 19 6 TK6x4-FT1+1 18.7 m/40 t 16 7 TK6x4-DY2-ST3 25.2 m/60 t 19 8 TK6x4-CT2-CT2 27.3 m/66 t 19 9 TK6x4-DY2-LT3-ST3 33.8 m/90 t 19
Figure 10. Effect of tyre-road friction level on the startability of heavy vehicle combinations.
4.2.
Low speed tracking
The effect of tyre-road friction, as well as the turn angle on the swept path in a low speed tight turn was investigated. As used in many regulations, turning in a roundabout with outer radius of 12.5 m was simulated. In the Australian PBS scheme, a 90˚ turn is used (NTC 2008), while in the European Directive 97/27/EC, it is stated that a vehicle combination should be able to move within an area described by an outer circle of 12.5 m radius and an inner radius of 5.3 m. In Swedish regulations an inner circle of 2 m is used instead, to allow for manoeuvring of 25.25 m vehicle combinations. A study by Pecchini and Giuliani (2013) suggests that more angles should be studied. Long vehicle combinations will not reach their steady state offtracking when driving in a roundabout, which makes the angle a test parameter to investigate in a PBS framework. Here 5 exit angles ranging from 90˚ to 210˚ were used, see Figure 11. The longitudinal speed was set to 1m/s. The reference trajectory is given as input to the driver model in the simulation. The driver model is a PID controller acting on the vehicle longitudinal and lateral path errors. All the 22 vehicles in the reference fleet were simulated in the roundabout manoeuvre, and the resulting swept path are plotted in Figure 12. The achieved results indicate a dependency of the swept path on the simulated turn angle, specifically for longer vehicle combinations. Note that by subtracting the track width from the swept path, the offtracking values can be calculated.
Figure 11. Illustration of the considered exit angles in the roundabout manoeuvre.
23, 3 13, 7 16, 3 16, 3 13, 9 33, 1 23, 3 20, 6 13, 9 3 0, 5 1, 4 1, 4 0, 7 5, 5 3, 2 2, 5 0, 7
Startability (%)
All the turning manoeuvres were also simulated with a tyre-road friction of 0.25, to analyse the effect of road surface condition on the swept path. The relative difference between the low speed swept path in winter and summer conditions is plotted in Figure 13. The relative difference is well below 5% for most of the vehicle combinations, and below 10% for the rest. Thus, it was concluded that the
inclusion of low tyre-road friction in the low speed tracking measures is not necessary. Here, only the results for swept path/offtracking were presented, comparable results are expected for the other low speed tracking measures, tail swing and frontal swing.
Figure 12. Swept path of 22 vehicle combinations in a roundabout manoeuvre on high friction surface.
4.3.
High speed tracking
The effect of wintery road conditions was investigated for only one of the high speed tracking measures, namely High Speed Transient Offtracking (HSTO); since, it was anticipated that the effect of wintery road conditions would be most significant for this measure. It should also be noted that the high speed steady-state offtracking and the tracking ability on straight path are anticipated to be highly correlated; since, the difference between the two measures is the level of lateral acceleration the vehicle combination is exposed to.
To investigate the correlation between the HSTO of vehicle combinations in winter and summer, Single Lane Change (SLC) manoeuvres were simulated for the vehicle combinations in the reference fleet, with the selected tyre models for both high and low friction. A single lane change manoeuvre can be simulated using an open loop sinusoidal steer input, or as a closed loop manoeuvre with a driver model in the loop that decides the steering input for following a defined path. As the first step, a closed loop and an open loop SLC manoeuvre on dry asphalt were simulated for a subgroup of the reference fleet, to investigate the correlation between the two methods of simulating a lane change. For the open loop SLC, a sinusoidal steer input with frequency of 0.4 Hz at speed of 80 km/h was used; the amplitude was adjusted for each vehicle to result in a 3m lateral displacement of the front axle, so that the vehicles perform similar lane changes. For the closed loop single lane change manoeuvre, a simple PID driver model for following the desired path was used. The desired path was defined according to the ISO 14791 standard (ISO 2002), with a lateral acceleration of 2 m/s2 at the
front axle and a frequency of 0.33 Hz. This results in a 3m lane change which is comparable with the simulated open loop SLC. The achieved results are shown in Figure 14. In addition to the offtracking, rearward amplification of lateral acceleration and yaw rate, as well as load transfer ratio (LTR) are plotted in the figure, since all these measures can be investigated in a SLC manoeuvre. More information about these high speed stability measures are provided in section 4.5.
Figure 14 shows that the results of the open loop and closed loop manoeuvres are highly correlated for all the relevant performance measures. Care should be taken before generalizing this result, due to its dependency on the utilized driver model. Nevertheless, in the continuation of this investigation, open loop SLC manoeuvres were used to avoid dependency of the results on the driver model.
Figure 14. Correlation between the performance of vehicles, closed loop SLC vs. open loop SLC.
0 0.5 1 1.5 2 2.5 3 0 0.5 1 1.5 2 2.5 3
open loop lane change
c lo s e d l o o p l a n e c h a n g e
Rearward amplification of lateral acceleration Rearward amplification of yaw rate
High speed transient offtracking Load transfer ratio
A 3m open loop single lane change manoeuvre was simulated for all the 22 vehicle combinations in the reference fleet, with three steer input frequency of 0.3, 0.35 and 0.4 Hz and with speed of 80 km/h for high friction and 70 km/h for low friction (µ=0.25). The resulting HSTO for high friction versus low friction is plotted in Figure 15. The offtracking values for high and low friction are highly correlated. The steer input frequency does not have a significant effect on the results.
In the next step, the input steering frequency was kept constant as 0.35 Hz, but different values of friction, ranging from 0.2 to 0.35, were considered to simulate different winter road conditions, see Figure 16. The offtracking is significantly larger for all the vehicles in winter compared with summer, and it increases as the friction decreases. The correlation is evident for all simulated friction levels, and it is almost linear. This winter-summer performance correlation can be used to require a certain level of performance on summer, which also ensures stable performance in winter.
It should be noted that in the performed simulation, the vehicle combinations are compared in a single lane change with 3 m lateral displacement using a sinusoidal steer input. Other approaches can be used, such as giving a sinusoidal lateral acceleration input with a fixed amplitude. Here the sinusoidal steer input is used due to its easier implementation.
Figure 15. Correlation between offtracking of the vehicle combinations in the reference fleet in winter versus summer, during a 3 m SLC manoeuvre with different steer input frequency.
Figure 16. Correlation between offtracking of the vehicle combinations in the reference fleet in winter versus summer, during a 3 m SLC manoeuvre for different friction levels.
0 0.5 1 1.5 2 -1 0 1 2 3 4 5 6
offtracking on high friction [m]
o ff tr a c k in g o n l o w f ri c ti o n [ m ], m u = 0 .2 5 3m SLC 0.3Hz 0.35Hz 0.4Hz 0 0.5 1 1.5 2 -2 0 2 4 6 8 10 12
offtracking on high friction [m]
o ff tr a c k in g o n l o w f ri c ti o n [ m ] 3m SLC 0.35Hz mu=0.2 mu=0.25 mu=0.3 mu=0.35
The influential infrastructure features during a lane change manoeuvres are the lane width and the road surface friction. The nominal values of these parameters on the Swedish road network, according to road design guidelines and road maintenance requirements are as followings (Trafikverket 2012): • The road friction should be at least 0.35 for major roads and 0.25 for minor roads.
• The lane width is 3.5-3.75 m for highways, 3.0-3.75 m for major roads and 2.75-3.25 m for minor roads.
Considering the linear correlation depicted in Figure 16, the low friction offtracking is about 1.45 times more than the high friction offtracking for a surface friction level of µ=0.35. Thus, the offtracking in summer should be below 0.7m, in a single lane change at 80 km/h with lateral displacement of 3m, to ensure an offtracking below 1.0m in winter, which means the vehicle stays within the lane on major roads in winter as well, considering a lane width of 3.5m and the vehicle width of 2.5m.
The values of the simulated high speed transient offtracking for vehicle combinations in the reference fleet are plotted in Figure 17. Most of the simulated vehicles have an offtracking below 0.7 m on high friction, however many of the combinations with centre axle trailers have larger offtracking, including the conventional combination tractor-semitrailer-centre axle trailer which has an offtracking of 0.8 m. Thus, if it can be assumed that the existing fleet on Swedish roads are safe and allowing occupying up to 3.6 m lane width during a lane change, an offtracking of 0.8 m can be set as the limit.
It should be noted that the provided offtracking values are for the specific simulated configuration of the vehicle combinations; different offtracking values can be achieved by changing the vehicle configuration, such as number and position of the axles and position of the articulation joints.
Figure 17. Offtracking of the vehicle combinations of the reference fleet in a 3m SLC manoeuvre.
4.4.
Low speed stability
The friction demand of steer tyres is a measure aimed to estimate how much friction is needed to complete a tight turning manoeuvre without losing the steerability of the vehicle. The friction demand of the drive tyres estimates how much friction is needed to propel the vehicle and to prevent a
jackknife of the towed units in such a manoeuvre. Simulating the same roundabout manoeuvre used for swept path, the friction demands of the steer and drive tyres for all the 22 vehicle combinations in the reference fleet were calculated. It should be noted that the purpose is to assess how much peak friction is required for the vehicle to complete the manoeuvre. Thus, the friction demand is calculated as the ratio of planar forces and normal forces, and it is not normalized by friction coefficient.
0 0,2 0,4 0,6 0,81 1,2 1,4 1,6 1,82 TK6x 2_ CT 2 TK6x 2_ CT 2_ CT 2 TK6x 2_ DY 2_ ST 3 TK6x 2_ FT 22 TK6x 2_ FT 23 TK6x 4_ CT 3_ CT 3 TK6x 4_ DY 2_ LT 2_ ST 3 TK6x 4_ DY 2_ LT 3_ ST 3 TK8x 4_ CT 3 TK8x 4_ DY 2_ LT 3_ ST 3 TK8x 4_ DY 2_ ST 3 TK8x 4_ FT 23 TR 4x 2_ LT 2_ ST 3 TR 4x 2_ ST 3 TR 4x 2_ ST 3_ CT 2 TR 6x 2_ ST 3 TR 6x 4_ LT 2_ LT 2_ ST 3 TR 6x 4_ LT 2_ ST 3 TR 6x 4_ LT 3_ LT 3_ ST 3 TR 6x 4_ LT 3_ ST 3 TR 6x 4_ ST 3_ CT 2 TR 6x 4_ ST 3_ D Y2_ ST 3
High Speed Transient Offtracking
Figure 18 and Figure 19 show the calculated friction demand of the steer tyres, using tyre models for high and low tyre-road frictions respectively. Unexpectedly, the friction demand of the steered axle is lowered in the snow condition (µ=0.25) compared to the dry asphalt. A similar observation can be drawn for the drive axles by observing Figure 20 and Figure 21. This phenomenon can be explained by the fact that the friction demand is not only dependent on the friction, but also on other tyre
properties such as cornering stiffness. This is illustrated in Figure 22, where the friction demand on the steered axle is plotted for a parameter sweep in friction and stiffness for the Adouble combination (TR6x4_ST3_DY2_ST3). The plot illustrates that the stiffness of the tyres plays an important role in the measure with an almost linear dependency. This is aligned with the intuition that stiffer tyres will generate higher tyre forces for the same displacement and that most of the required friction forces are used to oppose other tyre forces within the combination rather than maintaining the path of the vehicle. Also, worth noticing is that the vehicle configuration has a higher impact on the friction demand than the total length of the vehicle combination. For instance, the friction demand of steer tyres is highest for the combinations with 4-axled trucks, due to resistance from the rear axle group to traveling through a tight turn. Furthermore, the results show that the friction demand on snow does not depend on the manoeuvre angle, implying that the peak force utilization occurs early in the manoeuvre on snow.
Figure 18. Friction demand of steer axles on dry asphalt
Figure 20. Friction demand of drive axles on dry asphalt.
Figure 21. Friction demand of drive axles on snow.
In conclusion, the simulation results suggest that the interpretation of the friction demand measures is ambiguous and that in addition to the friction level, the tyre stiffness has also a significant impact on the value. This indicates that calculating the friction demand on high friction as a means for assessing the performance on low friction is not an appropriate approach, due to the dependency of the measure on both cornering stiffness and friction level. However, it can be argued that the measure can be calculated for winter condition directly to ensure that a heavy vehicle combination would be able to manoeuvre through a tight turn in winter conditions.
4.5.
High speed stability
The load transfer ratio was investigated in the same lane change manoeuvre used for high speed transient offtracking study, described in section 4.3. As expected the rollover risk is not an issue during winter due to lower levels of lateral acceleration, and the load transfer ratio is generally lower in winter compared to summer, see Figure 23. Thus, it can be concluded that testing the vehicle roll stability during summer condition is sufficient.
Figure 23. Load transfer ratio of vehicle combinations in the reference fleet in a 3 m SLC manoeuvre.
Rearward amplification of yaw rate was also evaluated in the same single lane change. Again, the effects of steer input frequency and tyre-road friction level on the correlation between performance in summer and winter was investigated, see Figure 24 and Figure 25.
It can be seen that the rearward amplification values for winter and summer are highly correlated. Although the values for winter and summer are not too different, the difference gets exaggerated for vehicles with poor performance which will result in swing out and instability in winter. Thus, the yaw rate rearward amplification in summer condition should be below a certain value, to ensure that the vehicle will not be prone to swing outs in winter. According to the obtain simulation results, this limit value is between 2.1 and 2.5 in a single lane change at 80 km/h with a lateral displacement of 3m. All the simulated vehicle combinations have a yaw rare rearward amplification below 2.1, except for the vehicle combination with double two-axled centre axle trailers, see Figure 26. Thus, considering the performance of the current fleet and the correlation between winter and summer performance, a limit value of 2.2 is suggested. 0 0,1 0,2 0,3 0,4 0,5 0,6 0,7 0,8 0,9 TK6x 2_ CT 2 TK6x 2_ CT 2_ CT 2 TK6x 2_ DY 2_ ST 3 TK6x 2_ FT 22 TK6x 2_ FT 23 TK6x 4_ CT 3_ CT 3 TK6x 4_ DY 2_ LT 2_ ST 3 TK6x 4_ DY 2_ LT 3_ ST 3 TK8x 4_ CT 3 TK8x 4_ DY 2_ LT 3_ ST 3 TK8x 4_ DY 2_ ST 3 TK8x 4_ FT 23 TR 4x 2_ LT 2_ ST 3 TR 4x 2_ ST 3 TR 4x 2_ ST 3_ CT 2 TR 6x 2_ ST 3 TR 6x 4_ LT 2_ LT 2_ ST 3 TR 6x 4_ LT 2_ ST 3 TR 6x 4_ LT 3_ LT 3_ ST 3 TR 6x 4_ LT 3_ ST 3 TR 6x 4_ ST 3_ CT 2 TR 6x 4_ ST 3_ D Y2_ ST 3
Load Transfer Ratio
Figure 24. Correlation between yaw rate RA of vehicle combinations in the reference fleet in winter versus summer, during a 3 m SLC manoeuvre with different steer input frequency.
Figure 25. Correlation between yaw rate RA of vehicle combinations in the reference fleet in winter versus summer, during a 3 m SLC manoeuvre for different friction levels.
Figure 26. Yaw rate RA of vehicle combinations in the reference fleet in a 3 m SLC manoeuvre.
0.5 1 1.5 2 2.5 3 3.5 0 1 2 3 4 5 6
Yaw rate rearward amplification on high friction
Y a w r a te r e a rw a rd a m p lif ic a ti o n o n l o w f ri c ti o n , m u = 0 .2 5 3m SLC 0.3Hz 0.35Hz 0.4Hz 1 1.5 2 2.5 3 0 1 2 3 4 5 6
Yaw rate rearward amplification on high friction
Y a w r a te r e a rw a rd a m p lif ic a ti o n o n l o w f ri c ti o n 3m SLC 0.35Hz mu=0.2 mu=0.25 mu=0.3 mu=0.35 0 0,51 1,52 2,53 3,54 TK6x 2_ CT 2 TK6x 2_ CT 2_ CT 2 TK6x 2_ DY 2_ ST 3 TK6x 2_ FT 22 TK6x 2_ FT 23 TK6x 4_ CT 3_ CT 3 TK6x 4_ DY 2_ LT 2_ ST 3 TK6x 4_ DY 2_ LT 3_ ST 3 TK8x 4_ CT 3 TK8x 4_ DY 2_ LT 3_ ST 3 TK8x 4_ DY 2_ ST 3 TK8x 4_ FT 23 TR 4x 2_ LT 2_ ST 3 TR 4x 2_ ST 3 TR 4x 2_ ST 3_ CT 2 TR 6x 2_ ST 3 TR 6x 4_ LT 2_ LT 2_ ST 3 TR 6x 4_ LT 2_ ST 3 TR 6x 4_ LT 3_ LT 3_ ST 3 TR 6x 4_ LT 3_ ST 3 TR 6x 4_ ST 3_ CT 2 TR 6x 4_ ST 3_ D Y2_ ST 3
Yaw Rate Rearward Amplification
With respect to yaw damping ratio, the performance of the vehicle combinations during winter and summer are similar. However, the simulation results in Figure 27, indicate that vehicles with very low damping ratio in summer, below 0.1, will be prone to undamped oscillation in winter. As shown in Figure 28, all the simulated combinations have a yaw damping above 0.2, except the combinations with double centre axle trailers. Thus, considering the performance of the current fleet and the correlation between winter and summer performance, a limit value of 0.2 is suggested.
Figure 27. Correlation between yaw damping ratio of vehicle combinations in the reference fleet in winter versus summer, during a 3 m SLC manoeuvre for different friction levels.
Figure 28. Yaw damping ratio of vehicle combinations in the reference fleet in a 3 m SLC manoeuvre.
4.6.
Braking
In the PBS project, braking stability in turn has been investigated by Volvo on test track in winter conditions, where two HCT vehicles were tested. The test results indicate that the vehicles stay stable during braking in a turn on snow, when the ABS function works properly. But, malfunctioning of the ABS on any axle groups, as well as extreme slippery conditions, results in large offtracking. No simulation has been performed with respect to the braking stability in the PBS project due to lack of detailed brake models. An issue which should be further investigated in future is the effect of the braking delay on stability of long HCT vehicles during braking in a turn. It should be noted that in Volvo test results no considerable benefit was observed with using Electronic Braking System (EBS).
0 0.2 0.4 0.6 0.8 1 -0.2 0 0.2 0.4 0.6 0.8 1 1.2
Yaw damping ratio on high friction
Y a w d a m p in g r a ti o o n l o w f ri c ti o n 3m SLC 0.35Hz 0.99x+0.01=y mu=0.25 mu=0.35 0,00 0,20 0,40 0,60 0,80 1,00 1,20 TK6x 2_ CT 2 TK6x 2_ CT 2_ CT 2 TK6x 2_ DY 2_ ST 3 TK6x 2_ FT 22 TK6x 2_ FT 23 TK6 x4_ CT 3_ CT 3 TK6x 4_ DY 2_ LT 2_ ST 3 TK6x 4_ DY 2_ LT 3_ ST 3 TK8x 4_ CT 3 TK8x 4_ DY 2_ LT 3_ ST 3 TK8x 4_ DY 2_ ST 3 TK8x 4_ FT 23 TR 4x 2_ LT 2_ ST 3 TR 4x 2_ ST 3 TR 4x 2_ ST 3_ CT 2 TR 6x 2_ ST 3 TR 6x 4_ LT 2_ LT 2_ ST 3 TR 6x 4_ LT 2_ ST 3 TR 6x 4_ LT 3_ LT 3_ ST 3 TR 6x 4_ LT 3_ ST 3 TR 6x 4_ ST 3_ CT 2 TR 6x 4_ ST 3_ D Y2_ ST 3