VTI sär
tr
yck 354A • 2003
The Studded Tire –
a Fair Bargain?
A Cost-Benefit Assessment
Master’s thesis in Environmental Economics
Department of Economics, SLU, Uppsala
VTI särtryck 354A · 2003
The Studded Tire – a Fair Bargain?
A Cost-Benefit Assessment
Master’s thesis in Environmental Economics
Department of Economics, SLU, Uppsala
Elisabet Idar Angelov
Reprinting (2003) with kind permission from SLU ISSN 1102-626X
The Studded Tire – a Fair Bargain?
A Cost-Benefit Assessment
Elisabet Idar Angelov
Master’s thesis in Environmental Economics
ABSTRACT
Although studded tires are used to benefit individuals and society by decreasing the risk of road transport accidents, they indirectly cause negative effects from wearing the pavement. Not only does this imply increased maintenance costs for the road-holders and cleaning costs for many oth-ers, but particles from the wear are also believed to cause and aggravate diseases in the human res-piratory system. It is further suspected that they may cause environmental harm. This essay is an attempt to disentangle the matter through a cost-benefit assessment including the 13 southernmost Swedish counties. For those effects that there is sufficient knowledge, monetary values have been estimated, while others are merely discussed.
A literature survey, accident and population statistics, and a model describing the differences in accident risk between tires have been used as bases for the analysis. SIKA’s recommended mone-tary values have been applied for road accidents, as well as for health and soiling costs from emis-sion of particulate matter.
It seems today unrealistic to assert for certain whether the net effect of studded tire use is positive or negative seems. This is principally due to a lack of exposure-response links and uncertainties concerning friction improvement, as well as size distribution and toxicity of pavement wear par-ticulate matter. With reference to the results at hand, it is nevertheless claimed that most likely, a high level of studded tire use in the southern part of Sweden does not entail any significant net benefits. Depending on which assumptions are correct it may, however, involve a rather substantial net cost.
It is also suggested that studded tires are included in further analyses together with other measures for increased road safety during the winter season, and that separate contingent valuation surveys are applied when estimating separate values – if such surveys are used at all – in forthcoming ASEK reviews.
Key words: Studded tires, cost-benefit analysis, economic valuation, road safety, road dust, PM2.5,
PREFACE
This Master’s thesis in environmental economics was written through an initiative from the Swed-ish National Road Administration (SNRA), and with help from this organization as well as from the Swedish National Road and Transport Research Institute (VTI).
I would like to thank my supervisors, Tore Söderqvist at the Beijer Institute of Ecological Eco-nomics and Mats Gustafsson at VTI, as well as Lars Nilsson, environmental director at the SNRA, who came up with the idea. Several other experts helped me by answering my often quite confused questions. Amongst them I would especially like to show my appreciation to Torbjörn Jacobson, VTI, who gave me many answers as well as new questions. Also, Inger Forslund at SCB sent me – in no time – the accident statistics I thought did not exist, and Bengt Magnusson at the SNRA equipped me with immense data files and actually managed to explain them to me. Furthermore, I was helped by Gudrun Öberg and Urban Björketun at VTI, Poul Holmgren and Åsa Lindgren at the SNRA, Kaarle Kupiainen at the University of Helsinki, and Anders Pettersson at Stads-byggnadskontoret in Stockholm. And there are others.
But most of all, Nikolay. This marvelous husband of mine not only taught me the wonders of Ex-cel and proofread all the pages, but he also put up with me talking studded tires at all times when not being generally pregnant and irritable. Quite amazing. Thank you.
Uppsala, April 2003 Elisabet Idar Angelov
CONTENTS
ABBREVIATIONS ...4
1. INTRODUCTION...5
1.1 BACKGROUND... 5
1.2 PURPOSE... 5
1.3 METHOD AND DELIMITATIONS... 6
1.4 DISPOSITION... 6
2. STUDDED TIRES – THE STORY ...6
2.1 HISTORY IN BRIEF... 6
2.2 STUDDED TIRES IN SWEDEN... 7
2.2.1 Studded tires and the goals of the SNRA ... 7
2.2.1.1 Road safety ...7
2.2.1.2 Environmental sustainability...8
3. COST-BENEFIT ANALYSIS ...9
3.1 CBA THEORY... 9
3.1.1 The nature of CBA ... 9
3.1.2 Time, risk, and uncertainty... 10
3.1.3 General procedure... 11
3.2 CBA IN SWEDEN... 11
4. ECONOMIC VALUATION ...12
4.1 VALUATION THEORY... 12
4.1.1 Finding WTP and WTA ... 13
4.2 VALUATION METHODS... 13
4.2.1 Indirect methods... 14
4.2.2 Direct methods... 14
4.2.3 Other methods... 14
4.3 VALUATION METHODS OF THE SWEDISH TRANSPORT SECTOR... 15
4.3.1 Road safety... 15
4.3.2 Air pollution... 16
5. EARLIER STUDIES AND HOW THIS ONE DIFFERS ...17
5.1 CARLSSON ET AL. 1995 ... 17
5.2 THE NORWEGIAN ROAD GRIP PROJECT... 17
5.3 THE PRESENT ANALYSIS... 18
6. ANALYSIS ...19
6.1 A STUDDED CBA INTRODUCTION... 19
6.2 STUDDED TIRE BENEFITS... 20
6.2.1 Road safety... 20
6.2.1.1 Results - road safety ...21
6.2.2 Roughening of asphalt ... 21
6.3 STUDDED TIRE COSTS... 22
6.3.1 Road abrasion - maintenance... 22
6.3.1.1 Results - maintenance...23 6.3.2 Health... 23 6.3.2.1 PM10, PM2.5...23 6.3.2.2 Health effects...24 6.3.2.3 Limit values ...24 6.3.2.4 Results - health...25 6.3.3 Soiling... 25 6.3.3.1 Results - soiling...26 6.3.4 Environment ... 27 6.3.4.1 Three effects ...27
6.3.4.2 Summing up - environment ...28
6.4 OTHER EFFECTS... 29
6.4.1 Noise... 29
6.4.2 Accessibility and fuel consumption... 29
6.4.3 Miscellaneous... 29
7. RESULTS ...30
7.1 SENSITIVITY ANALYSIS... 30
7.1.1 Safety benefits ... 30
7.1.2 Maintenance costs... 31
7.1.3 PM2.5 health and soiling costs ... 31
7.2 RESULTS IN SUMMARY... 32
7.2.1 Original values ... 32
7.2.2 Values including sensitivity analysis adjustments ... 33
7.2.3 Some reasoning ... 33
8. DISCUSSION ...34
8.1 AMBIGUOUS RESULTS... 34
8.1.1 Research to be done... 34
8.1.2 Doubtful use of valuation method... 35
8.2 SOME FINAL THOUGHTS... 35
REFERENCES ...37
APPENDIX I CALCULATION PROCEDUR ES ...41
A. SAFETY BENEFITS... 41
B. MAINTENANCE COSTS... 42
C. HEALTH AND SOILING COSTS... 43
APPENDIX II ACCIDENT DATA ...46
APPENDIX III PAVEMENT WEAR CALCUL ATIONS ...48
APPENDIX IV SFS 2001:527...48
ABBREVIATIONS
ASEK working group for socio-economic calculations within the transport sector CBA cost-benefit analysis
CV compensating variation
EV equivalent variation
NPV net present value
PM2.5 particulate matter less than 2.5 micrometers of aerodynamic diameter
PM10 particulate matter less than 10 micrometers of aerodynamic diameter
SEK Swedish kronor
SIKA Swedish Institute for Transport and Communications Analysis SNRA Swedish National Road Administration
SPS specific wear; grams of abraded material per vehicle and kilometer VOLY value of a life year
VOSL value of a statistical life
VTI Swedish National Road and Transport Research Institute WTA willingness to accept
1. INTRODUCTION
1.1 BACKGROUNDApproximately 70 percent of Swedish cars are equipped with studded tires during the winter sea-son; less in the south while more in the north of the country.1 The tires contribute to increased safety on slippery winter roads by providing better friction, and they make the road surface rougher, giving improved road grip also to vehicles with non-studded tires. Lightweight studs have replaced the older steel studs, and more wear-resistant pavements have been developed, signif i-cantly decreasing the road wear and tear that studded tire use entails.
The use of studded tires results in fewer accidents and deaths in winter road transport, and it might seem incontestable that they are a societal benefactor. All the same, besides the benefits, the use of studded tires implies negative externalities, costs, which should be accounted for when assessing the actual utility they bring us. Studded tires wear the road surface to a larger extent than non-studded winter tires. And this road wear gives rise not only to maintenance costs, but also to parti-cles that harm human health and the environment.
In 1995, the social net benefit that would arise from a hypothetical ban on studded tires was calc u-lated in a Swedish cost-benefit analysis.2 The study concluded that such a ban would be too costly in terms of road safety, and that studded tires were largely beneficial. However, shortly after this a Norwegian project was initialized, exploring measures to ensure adequate road grip and transport safety during wintertime.3 Scenarios with different percentages of studded tire use were considered and health factors were included in the calculations. In the earlier Swedish study, these effects had merely been mentioned due to lack of data. The Norwegian analysts found that a decrease in the studded tire use in the largest city regions would be beneficial, and incentives to achieve this have since been implemented in Oslo and Trondheim.
Within Sweden, no serious discussions on such measures are taking place. Nevertheless, although several exposure-response links on what studded tire pavement abrasion really implies are still missing, there is today more knowledge on causes and effects of its negative externalities. If we want to allocate society’s resources in the best way, it might therefore be worthwhile to once more assess the costs and benefits of studded tire use. This time on slightly different premises, and ask-ing the questions in a different way.
1.2 PURPOSE
The purpose of the essay is to conduct a cost-benefit assessment on studded tires in a Swedish set-ting, in order to try to appraise whether they entail a net benefit or net cost to soc iety. ‘Society’ is for this purpose defined as the Swedish state and the human beings living within the country. As ‘counterfactual state’, or zero alternative, stands the current level of studded tire usage, while a de-crease in the use is considered as an option.
As a second, indirect purpose, the status of Swedish studded tire knowledge is presented. More specifically, it is briefly discussed within which areas that lack of information hampers the full un-derstanding of the matter.
1
The percentage is an approximate derived fro m Velin et al. (2002).
2
Carlsson et al. (1995).
3
1.3 METHOD AND DELIMITATIONS
A cost-benefit assessment is a combination of a traditional cost-benefit analysis, and a qualitative discussion and estimation of sizes of those effects that have not been monetary valued.
To carry out the study, Swedish data on population, traffic accidents, and the level of studded tire usage have been applied in the calculations, as well as estimates on studded tire road abrasion. Furthermore, literature on cost-benefit analysis and valuation theory, published studies on studded tires, and the SIKA Reports on socio-economic calculation and valuation within the Swedish transport sector (ASEK2 and ASEK3) have been used as bases for the analysis.
Although the essay includes effects that have not yet been valued, no new monetary valuations have been embarked upon. This is partly because some scientific connections between cause and effect have not yet been fully explored, and partly because a monetary valuation of environmental effects is a complex and time-consuming task that lies beyond the scope of this essay.
Several assumptions have been made, some rather strong due to lack of proper data, but of which all have been discussed with experts within appropriate fields at the Swedish National Road and Transport Research Institute (VTI) and at the Swedish National Road Administration (SNRA).
1.4 DISPOSITION
In the second chapter, a brief history of studded tires is presented, as well as the indirect relatio n-ship between studded tires and the goals of the SNRA. The two thereafter following chapters, three and four, contain introductions to the theory behind the cost-benefit analysis method and economic valuation, as well as the links between these and the Swedish transport agencies. The fifth chapter presents two earlier studded tire studies and explains some fundamentals of the reasoning behind the analysis at hand, while the analysis itself can be found in chapter six.
Each section in chapter six contains a description of the current knowledge of a studded tire bene-fit or cost, as well as results for those effects for which calculations have been carried out. All re-sults are summarized in chapter seven, after a sensitivity analysis based on ventilation of some of the made assumptions. The results are discussed in chapter eight. Detailed descriptions on how the calculations were carried out can be found in the Appendices, while a more thorough introduction to the analysis is placed as an introduction to chapter six.
2. STUDDED TIRES – THE STORY
2.1 HISTORY IN BRIEFAs the passenger car became commonplace and speeds increased in the mid 20th century, the num-ber of serious traffic accidents escalated. In northern countries, where wintry road conditions addi-tionally aggravated the situation, studded tires and tire chains were developed to counterbalance the low friction on frequently icy roads. The original studded tire, in the early 1960’s, was a force-ful construction made of a tungsten carbide pin in a jacket, fastened to the tread rubber by a flange.4 With this measure, the accident risk decreased significantly, but unfortunately the studs made heavy pavement damage and implied large maintenance costs for the road holders.
When increased attention was given the drawbacks of studded tires, they were banned in a few states in the US and Canada 1971, as well as in West Germany 1975. In Japan, studded tires were during a period very popular, but when considerable health and environmental problems were connected with pavement wear from the studs, these were banned in some regions in 1991. After
4
large increases in accident rates, the current aim in Sapporo, Japan, is to reach a studded tire usage of 20 percent, thereby benefiting from the roughening effect that studs entail.5
In Denmark, studded tires are a rare sight, although permitted, while 90 percent of all Finnish car owners use them during the winter months.6 A Norwegian road grip study in 1997 led to an at-tempt to decrease the studded tire use in the largest city regions.7
Today, the studded tires sold on the market are much lighter and less damaging constructions. A variety of material combinations are used, and the steel or aluminum pin is usually covered with a casing of plastic or aluminum.8 Also, the studs on each tire are fewer and shorter to decrease road abrasion.
2.2 STUDDED TIRES IN SWEDEN
Studded tires have been used in Sweden since the winter season of 1961/629 and first and foremost for passenger cars and light duty trucks, as opposed to Norway where also heavy trucks and buses are equipped with studs.
Since the first of December 1999, cars, light lorries and buses of a total weight less than 3.5 tons are complied to be fitted with studded or non-studded winter tires during the period between the 1st of December and the 31st of March (provided that winter road conditions prevail).10 The reasons behind the Decree were purely connected to road safety. There is also an Order regulating when studded tires must not be used, namely from the 1st of May to the 30th of September,11 as well as an Order setting minimum tread depth to 3 mm in wintry road conditions from December to March.12 In the southernmost Swedish county, Skåne, the studded tire use level was doubled with the intro-duction of the winter tire law, while the difference without and with the law diminished further north to be close to zero in northern Sweden.13 The studded tire use level now ranges from above 90 percent in the north to less than 50 percent in the south during the coldest winter months.14 Many studded tires still in use in Sweden are rather old and worn. In 2001, 10 percent of the tires in the county of Östergötland were ten years or older, albeit all with approved tread depth. Still, around 30 percent of the studded tires had studs that were too small (≤ 0.6 mm) to provide better friction than non-studded tires.15 It is not unlikely that the situation is similar also in the rest of the country.
2.2.1 Studded tires and the goals of the SNRA 2.2.1.1 Road safety
Sweden is among the countries that have the lowest road transport mortality rate per capita. Due to a number of security measures, the mortality rate decreased during the 1980’s and 1990’s, until the last few years of the century when the trend seemed to turn slightly upwards again.
5
Folkeson (1992); Gustafsson (2002).
6
Kupiainen et al. (2002b).
7 The project is briefly described in section 5.2, p. 17. 8 González Arrojo (2000). 9 Folkeson (1992). 10 SFS 1999:721. 11 VVFS 1999:114. 12 VVFS 2000:119. 13
Jacobson & Hornwall (2000).
14
Velin et al. (2002).
15
The SNRA is tied to security goals beside goals regarding efficiency and the environment. In 1997, the Swedish Parliament passed a Road Traffic Safety Bill, based on the so-called Vision
Zero. This sets the long-term traffic security goal to zero fatalities or severely injured in Swedish
road transport, while basically ignoring the total number of accidents, and it has since been crit i-cized for being unreachable. There is also a temporary goal, according to which the mortality number in road traffic accidents shall be lower than 270 in 2007.16
For the sake of consistency, it could be advocated that Vision Zero should also include morta lity and morbidity caused by the different forms of air pollution emitted through motor vehicles. Such a measure would most certainly give the policy an even more utopian touch as far as the near fu-ture is concerned, but also make it economically more accurate when used as objective in the allo-cation of means and implementation of incentives.
2.2.1.2 Environmental sustainability
The overall environmental goal of the SNRA is formulated as follows: ”The road transport system shall be developed in a way that does not jeopardize the environment or public health and welfare either now or in the future.”17 And from this, the following aims can be derived:18
- Decrease discharges of climate gases and air pollutants. - Decrease health effects of air pollutants.
- Decrease disturbance from noise. - Economize with natural resources.
- Increase consideration for natural and cultural values.
When discussing studded tires, it is mainly the second of these aims that is of interest - to decrease the health effects of air pollutants - although the others may also be of importance. More specif i-cally, the environmental quality standards for air quality along the state-owned road network are to be fulfilled from the year that they are implemented into Swedish law.19 As shall be seen below, studded tires may in this respect pose a problem when the PM10 environmental quality standard is
implemented in 2005.20 A strategy to solve pollution-related health problems connected with road transport is also to be formulated.
The air quality in most densely populated Swedish areas has, health-wise, improved. However, ni-trogen dioxide, benzene, particulate matter, and ozone are believed to at times exist at levels that can harmfully influence human health. It is estimated that between 100 and 1 000 Swedes fall ill in cancer due to air pollution each year, and that 20 000 – 100 000 days of illness have the same source through asthmatic attacks and airway problems.21 Only local emissions of particulate matter are believed to cause 230 deaths in Stockholm and 100 deaths in Gothenburg each year; i.e. an in-creased mortality of approximately two percent.22
In the SNRA Environmental Program for 2002-2005,23 it is claimed that none of the measures suggested in order to reach the environmental goals conflicts with any other goal of the authority. Note that further investigation of the environmental effects of studded tires is not included in the Program. The environmental benefits of decreasing the use of studded tires would clearly collide with the goal of Vision Zero as it is today formulated, since it would also somewhat reduce road
16 Vägverket (2001b). 17 Vägverket (1998). 18 http://www.vv.se 19 Vägverket (2001a). 20 See section 6.3.2, p. 23. 21 Vägverket (2001a). 22 Medina et al. (2002). 23 Vägverket (2001a).
safety. This implies that even if it was to be shown that the use of studded tires bears a substantial net cost, it does not seem improbable that the matter would end up in a low-priority list.
3. COST-BENEFIT ANALYSIS
The cost-benefit analysis, or CBA, method is a form of applied neoclassical welfare economics. When non-market goods or externalities are involved it also takes frequent rests with the theory of economic valuation presented in chapter four. Generally, the application of CBA has to do with choosing among alternatives. More specifically, it is used to systemize the effects of particular public sector policies or projects on social welfare. A CBA is considered particularly helpful when one seeks to reach a desirable allocation of resources within a policy area, and there are different investment alternatives to choose from. It should be noted that the CBA does not necessarily help to find the most desirable allocation, but the better one out of different possibilities.
When economic efficiency is the sole guide to policy makers, CBA might serve as primary basis for decision-making. The general purpose of the method is, however, not to replace the considera-tions of the decision-maker, but to provide one out of several means of assistance in the process. After all, even a carefully performed CBA is normative and subjective, due to the large array of explicit and implicit assumptions that normally have to be made.
3.1 CBA THEORY24
In order to find out when social welfare is increased, and when it is not, the theory of welfare eco-nomics can be applied. The criteria most commonly referred to are the criterion of Pareto
effi-ciency and the potential Pareto criterion, also known as the Hicks/Kaldor criterion, and they can
be said to serve as possible theoretical foundations of the CBA analysis.
According to Pareto, a change is an improvement to social welfare only if at least one person is made better off from it, while no one is made worse off. Such a change is per definition desirable. If there are no longer any possible changes that can fulfill this, a Pareto-optimal state has been reached, and implicitly, status quo should be aimed at. Although social welfare is the goal, the util-ity of the individual is in focus. However, nothing is said about changes that make some better off and others worse off. Whether a change has effects on the distribution of income in society is, in effect, considered to be of no importance, other than that the individual might place a value also on the welfare of others.
The Pareto criterion is hardly fit for practical use since few, if any, policy changes fulfill it. Never-theless, economists Kaldor and Hicks remodeled it into the potential Pareto criterion, thereby in-creasing its applicability. The Kaldor/Hicks criterion states that a change is desirable if its winners could hypothetically compensate its losers, so that the latter group consider themselves to be just as well off as before the change. Notwithstanding that in this way the number of policies passing the efficie ncy test is increased, allowing for hypothetical compensation makes also this criterion lack in consideration of income distribution. To make up for this in practice, though, a weighting system can be added to the analysis, valuing a monetary unit differently depending on what groups or regions are affected.
3.1.1 The nature of CBA
The aim of the CBA method is to compare any net social benefits of investing in a particular pr o-ject with the net social benefits of an alternative. This alternative might well be hypothetical, and it will not be implemented should the proposed project be undertaken. The alternative is denomi-nated the counterfactual project and is often equal to status quo (‘zero alternative’). Different de-signs of one single policy proposal may also constitute the object of analysis.
24
What is searched for is
C
B
NSB
=
−
,where B denotes benefits and C costs. NSB denotes the net social benefits.
An analysis can be made during different phases of a project, either ex ante when no decision has yet been made, or ex post when the project has been implemented. While the first alternative can be woven into decision-making, the second might give useful information for future pr ojects. The analysis may also serve during the implementation of a project to consider further developments, or compare ex ante and ex post of the same project.
A proper CBA should quantify and monetize every single effect of a project, as long as they relate to efficiency. However, lack of data or other problems might make this unachievable, and as sec-ond-best alternatives other applications of the method can be chosen. Most common of these is the
cost-benefit assessment. Here, all impacts for which it is feasible are monetized, while qualitative
estimations are made of the relative importance of those that remain.25
The results received from cost-benefit assessments are of course not only subjective, but also ap-proximations. Their accuracy is largely dependant on the effort that is put into quantifying, which is in turn contingent on the importance of exactness in each case.
3.1.2 Time, risk, and uncertainty
When the adoption of a policy implies impacts over longer periods of time, the analysis is compli-cated by our time preferences. Usually, we value an amount of money that we pay or receive today more than the same amount in the future. Such rates of time preferences need to be considered in the analysis, and they can be so by discounting future costs and benefits and turning them into pre-sent values, PV. A cost or benefit in year t is transformed to its prepre-sent value by dividing it by
t
r)
1
(
+
, where r is the social discount rate. Thus,∑
=+
=
T t t tr
B
B
PV
0(
1
)
)
(
, and ) ( ) (B PV C PV NPV = − .If economic efficiency is the only goal to be considered, the project should not be undertaken unless
0
>
NPV
.Although this is straightforward, the choice of social discount rate is still a matter of debate. In most cases, a constant discount rate is assumed also for long time periods. Critics often claim that the chosen rate is too high, and that it would likely be lower if future generations were represented in the decision-making. With a high discount rate, future values might become so low as worth next to nothing in the eyes of today. A constant discount rate also implies that people are believed to have stationary time preferences. While assuming this to diverge from reality, advocates of
hy-perbolic discounting allow instead for higher annual discount rates for short-term costs and
bene-fits, while using lower rates for effects that are expected in the distant future.26
25
The Swedish counterpart to ‘cost-benefit assessment’ would be ’samhällsekonomisk bedömning’, as o p-posed to cost-benefit analysis; ’samhällsekonomisk kalkyl’. See Mattsson (1988).
26
Every CBA is based on a number of assumptions, which might involve small or large amounts of uncertainty and risk, since future may bear other scenarios than those we believe ourselves to be able to predict. One way to cope with this in the analysis is to carry out a sensitivity analysis, where the assumptions are changed within reasonable bounds to see how the NPV changes with them. A risk value may also be added to the discount rate if a policy or investment is believed to be venturous; the profitability (net utility) requirements of the project are thus set higher.
3.1.3 General procedure
Although analyses diverge in degrees of complexity, the outline of a CBA is usually as follows: Before commencing with the analysis, it has to be defined how one intends to measure welfare change, usually by one of the criteria of welfare change presented above. When this is done, the policy or project to be analyzed must be defined and depicted, and a counterfactual project should be selected. Thereafter, all costs and benefits believed to affect individuals/citizens are identified and valued. Assumptions must be made on future values and their longevity, and a suitable dis-count rate should be chosen before disdis-counting to eventually form a net present value.
The last step of the analysis should be to make a sensitivity analysis to compensate for uncertain-ties in the made assumptions. In order to increase the credibility of any CBA, a large amount of transparency regarding the assumptions should follow the whole procedure.
3.2 CBA IN SWEDEN
There is for the Swedish scene no commonly accepted definition of CBA or of how it should be carried out. Nor is it as commonly used as in the US, UK, or Canada. Out of the Swedish Govern-ment authorities, it is only the transport agencies and the Swedish Institute for Transport and Communications Analysis, SIKA, that use the method to any significant extent.27 The same institu-tions have also elaborated common procedures and socio-economic values for a few of the exter-nalities relevant to the sector.
In the US, the UK, and Denmark, constant risk values are added to the recommended social dis-count rates (7, 6, and 6 percent respectively),28 while in Norway an adjustable risk value is added to the discount rate, leaving the total rate at 3.5, 4, or 8 percent depending on the perceived risk (i.e. uncertainty in future costs and revenues) of each policy alternative.
The 4 percent discount rate applied within the Swedish transport agencies differs from all these by not being risk adjusted. Risk and uncertainty should according to SIKA’s recommendations in-stead be explicitly accounted for and judged at the planning and decision states. According to the theory of net present value, however, the discount rate should be risk adjusted in compliance with the risk of every actual project. It may also be questioned whether a non-risk adjusted discount rate should be as high as 4 percent.
27
Frykblom & Helgeson (2002).
28
4. ECONOMIC VALUATION
We all have to make choices, and to do this we preferably want to know what benefits and/or costs these choices give us; we want to know their net value. Yet, when a choice implies effects involv-ing goods that are not sold in any market and that have no price tags, the situation might become quite complex. This is often the case for environmental goods and goods that have no use values, but non-use values, i.e. values that exist without actually using the good. For instance, how do we value clean air, the very existence of gorillas, or a decreased risk of getting killed in traffic? Com-mon to most such goods or effects is that they are public and/or connected to goods involving ex-ternal effects.
In order to provide a good or a choice with a price tag although it has no market, we can apply economic valuation. Before presenting some of the theory behind this, the implications of the mar-ket failures called public goods and externalities will be touched upon.
A public good is something that is more or less non-rival and non-excludable. The non-rival fea-ture implies that the marginal cost of providing the good to one additional consumer is zero. Non-excludability signifies that people cannot be excluded from consuming the good. For this type of goods, private property rights are difficult to organize, since very few are likely to be willing to take responsibility for something from which everyone can profit. The solution is usually state regulation. However, for a public good such as clean air, which is non-excludable but only partly non-rival, regulation to prevent the air from becoming polluted is additionally complicated since there is such a large number of agents polluting it.
External effects, or externalities, are said to be present when one agent’s activity affects the utility or possibilities of another agent, and no compensation is made from the agent responsible for the activity to the other. The externality is positive if the activity implies a benefit to the passive agent, and negative if the passive agent bears a cost (not necessarily monetary) from it.
As will be seen, the use of studded tires has several externalities that involve at least one public good: clean air. Studded tires save lives and property, benefiting not only the driver of a particular car, but also other drivers and society at large. Nevertheless, the studs on all studded vehicles to-gether also imply negative externalities, influencing people’s health and comfort, possibly harming the roadside environment, and increasing the need of cleaning and road maintenance.
4.1 VALUATION THEORY29
The idea of economic value is founded on neoclassical welfare economics. This in turn rests on the principle of consumer sovereignty, implying that the individual is believed to be the best judge of her own preferences. Involved is also utilitarianism, according to which a change or deed is judged as to the utility it entails, and anthropocentrism, meaning that only human preferences are consid-ered. This does not altogether exclude the preferences of other living beings, but it is humans that value them, for egoistic or altruistic reasons.
An economic value of a good can be extracted by looking at the trade-off we are willing to make in order to obtain it. These value measures can be defined as either a willingness to pay (WTP) to obtain or avoid something, or a willingness to accept compensation (WTA) in order not to obtain or avoid something. WTP and WTA do not have to be expressed in monetary terms, but can be stated in the shape of any good that the individual is willing to substitute for the good being va l-ued.
29
A considerably more thorough exposition of valuation theory may be found in Freeman (1993), on which this introduction is loosely based.
It should be observed that WTP and WTA do not convey any ‘true’ values of whatever is being valued, but a more or less precise approximation of a ‘true’ theoretical value that can count for a certain context and period of time.
4.1.1 Finding WTP and WTA
Theoretically, WTP and WTA may be found through calculating the economic concepts of Com-pensating variation (CV) and Equivalent variation (EV), which provide monetary or other meas-ures given certain levels of utility and the good in question. Briefly, they can be defined as fol-lows:
Compensating variation is the amount of money that makes the equality
)
,
,
(
)
,
,
(
p
y
CV
z
1V
p
y
z
0V
−
=
hold, where V denotes the level of indirect utility, p is price, y is income, and z the state or level of the good (e.g. health or environmental quality) before (0) and after (1) an improvement or a deterioration.
If the change is an improvement, the CV shows the maximum amount of money that can be taken from the individual while leaving her as well off as before the change. In this context, CV is the individual’s willingness to pay for the improvement (WTP). If on the other hand the change is a
deterioration, the measure shows the minimum amount of money that must be given to the
indi-vidual to fully compensate for the change. Here, CV is instead the willingness to accept compensa-tion for the deterioracompensa-tion (WTA).
Equivalent variation is the amount of money that satisfies the equality
)
,
,
(
)
,
,
(
1 0z
EV
y
p
V
z
y
p
V
=
+
.This measure can be said to work the other way around. For an improvement, the EV shows the minimum amount of money that must be given to the individual to make her as well off in the in i-tial state as she would be should the improvement take place. Here, EV is the minimum compensa-tion needed for the individual to accept that the initial state is not changed (WTA). For a
deteriora-tion, the EV shows the amount of money that must be taken from the individual to make her as
well off as she would be with the deterioration. And thus, the EV is the maximum amount of money the individual is willing to pay to prevent the change (WTP).
Implicitly, the CV implies that the individual has no right to an improvement and has to pay for the change, but that she has a right in status quo and has to be compensated for a deterioration. Con-trary to this, the EV implies that the individual has a right in a change. If the change is an im-provement, she has to be compensated if status quo prevails, but since she has no right to stay in the in itial situation, she must pay to avoid a deterioration.
In all but a few special cases, WTP and WTA do not equal each other, partly because the WTP measure is restricted by the individual’s income. Which one is correct to use depends on the im-plicit property rights in each context, and on the nature of the change (positive or negative).
4.2 VALUATION METHODS
In practice, there are several methods to estimate WTP/WTA depending on the type of value that is sought for and on the type of information that is within reach. Each has its own advantages and drawbacks, and they either use connections between the good to be valued and one or several mar-ket goods, or imply the creation of hypothetical marmar-kets in which the good can be studied.
Com-mon to them all is most likely that their users consider an approximate value better than no value at all.
4.2.1 Indirect methods
Even though a good is not traded in any market, it might in some way be linked to one or several other goods that are. And if so, the markets of these other goods can be studied to estimate a value of the first good. However, by doing this it is only the value for those actually using the good that is considered, i.e. the good’s use value. Its non-use value is not included.
These methods require a lot of sometimes hard-fetched information, and how to find the CV and EV values is often far from obvious. On the positive side is that they are based on actual market behavior. Below, a short presentation of one of them, the hedonic method, will follow. Other indi-rect methods are the travel cost method, the replacement cost method, the defensive expenditure
method, and the production function method.30
When applying the hedonic method, a market for a good (y) is studied on which the good to be valued (x) is believed to have influence. To illustrate, the hedonic method has been used within the Swedish transport sector, exploring how noise seems to influence house prices. With such infor-mation, different noise levels can be given monetary values. It is implicitly assumed that those who do not live in a certain area or do not visit a certain place do not place any value on the noise level in these locations.
4.2.2 Direct methods
If there is no connection between any market good and the good that is to be valued, a market has to be hypothetically created. As opposed to the indirect methods, this implies hypothetical behav-ior, which might be considered as problematic if partaking actors have reasons to under- or overestimate their WTP/WTA. If that risk is considered, however, direct measures of CV and EV may be found, inclu ding both use and non-use values.
Most well known is the contingent valuation method, which uses surveys or interviews where in-dividuals’ are asked to state their WTP or WTA for a change or a service. To reach a fair estima-tion of the ‘true’ value, the quesestima-tions have to be carefully prepared and background informaestima-tion is usually included. The questions can either be discrete, where the interviewee is asked to answer yes or no to a given monetary value, or open-ended, where the interviewee chooses any sum. Important to note is that the stated WTP/WTA is only ‘correct’ in the context of how the interviewee was told that the change or service should be paid for, although an actual market transaction never takes place.
The contingent valuation method has been the most widely used and researched upon of all the presented methods, but also the most debated. More than anything, its hypothetical form has been criticized as it is said not to reveal the individuals’ actual market behavior, but induce ‘hypotheti-cal bias’. Depending on the context of the value to be found, but often related to environmental disputes, it is also being questioned whether a non-expert is really fit to estimate her WTP for a complex matter she is not expected to fully understand.
4.2.3 Other methods
There is also an array of valuation methods that do not use the concept of willingness to pay/accept. When based on other theoretical or ethical concepts, they are usually seen as comple-ments instead of substitutes to the direct and indirect methods.
30
Within the Swedish transport agencies, political decisions have sometimes been used to see ‘backwards’ how much the state is willing to pay for something that is beneficial to society.31 The idea is that polit icians are elected by the people and therefore should reflect the people’s willin g-ness to pay. If, therefore, the government sets an environmental goal, the actual cost to reach it would be the total WTP for the changes needed. If society is not willing to pay the amount re-quired, the goal will not be set. The accurateness of the value is likely to be at least partly depend-ent on how well the politicians represdepend-ent their voters and on the number of differdepend-ent interests that were included in the discussions foregoing the decision.
4.3 VALUATION METHODS OF THE SWEDISH TRANSPORT SECTOR
SIKA has estimated values for some of the externalities common within the transport sector, such as time and quality, road safety, noise, air pollution, and CO2 emission. The values are used by the
transport agencies and are based on several valuation methods, such as contingent valuation, po-litical decisions, and the hedonic method. The valuation project is named ASEK,32 and has until now been reviewed twice; ASEK2 in 1999, and ASEK3 in 2002.33 Below, the externalities road safety (accidents) and air pollution (particles) will be presented, emphasizing the reasoning behind their respective ASEK values. No other ASEK values have been applied in the present analysis.
4.3.1 Road safety
Since the late 1960’s, road safety has been valued by the SNRA as an average cost per accident. Initially, it was a purely material cost, composed of costs of health care, administration, and prop-erty damage, as well as of the costs associated with net falls in production.34 When estimating a value of road safety today, though, it is primarily the individual’s WTP for a decreased risk of get-ting hurt or killed in a traffic accident that is of interest. This can be transformed into the individ-ual’s ‘risk value’, to be described below. Note that this is not the same risk value as is sometimes added to discount rates. Accidents leading only to property damage are labeled with a calc ulated value of material costs, but are said to have no risk value.
Within the Swedish transport agencies, stated WTP values have been calculated through the
con-tingent valuation method based on open-ended questions. The WTP values have been divided by
the change in risk that the individuals had to consider, ?R, where R denotes risk level, and the quotient is the marginal rate of substitution between income and risk, MRS. This value is used as risk value: R WTP MRS ∆ =
The most widespread dispute with this procedure is probably that of giving a monetary value to a human life at all, thereby ‘degrading’ something that should be priceless. In theory, however, the valuation is never of the life of a specific person, but of a statistical life. As mentioned above, the application of the contingent valuation method has been much criticized, and this also when used to value road safety.
When conducting the contingent valuation surveys of road transport risk used by SNRA, it seemed to be that the interviewees had problems with the ranking of different small changes in risk, which in turn led to large variations in the value of a statistical life (VOSL) that was used as basis for the final valuation. Also, signif icant parts of the stated WTP values were usually not connected to any particular change in risk, but interpreted as a willingness to pay for road safety in general.35
31
The current ASEK value for carbon dioxide emissions is based on political decisions.
32
‘Arbetsgruppen för samhällsekonomiska kalkyler’.
33
SIKA (1999) and SIKA (2002), respectively.
34
SIKA (2002).
35
In ASEK3, it was emphasized that the knowledge on what influences the individual’s comprehen-sion of safety is still scarce, and that the current recommended accident values are uncertain. It was suggested that further research should be carried through to increase knowledge before com-ing valuation reviews. And consequently, the recommended safety values in ASEK2 were adjusted only to the price level of 2001, while no other changes were made.
4.3.2 Air pollution
An individual’s state of health is often the result of interplay between different factors over long periods of time, making health valuation of air pollution difficult.
During the latter half of the 1990’s, the calculated values of air pollution emissions of NOx, VOC,
and SO2 were based on the environmental fee of emitting nitrogen within the energy sector, i.e.
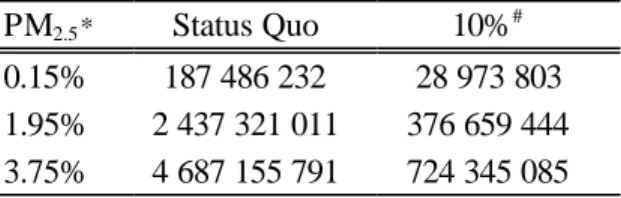
us-ing political decisions. The particle emission value (PM2.5) considered the increased risk of cancer
from PAH,36 attaching to and being transported by particles. In urban areas, estimated local health effects were added, and for particles also a value of soiling. The values of local effects and soiling were calculated from WTP surveys, i.e. using the contingent valuation method.37
When scrutinized in 1999, however, the bases of these values were considered weak. For instance, it was claimed that any WTP surveys of air pollution should concentrate on actual effects of emis-sions, and not on the emissions per se. A differentiation of health costs according to population size was also asked for.
In ASEK2, exposure-response links were introduced as bases for the valuation of health costs of air pollution from road transport. The most central factor was increased mortality due to pollution, which was valued through calculation and valuation of the number of lost years of life (VOLY; Value Of a Life-Year), the value being derived from that of a statistical death (VOSL).38 The VOSL was in turn derived from the Swedish risk value of road accidents; a value calculated through contingent valuation surveys with open-ended questions.39
For years at an already advanced age, a lower value was applied, and a discount rate of 4 percent was used. A value of morbidity was added to the value of mortality risk, set to 16 percent of the mortality value and estimated in accordance with the ExternE project (see below). Both the mortal-ity and morbidmortal-ity values are based only on effects of PM2.5.
40
The total value also includes soiling by particulate matter, but environmental costs of air pollution are no longer included due to lack of environmental exposure-response links.41
In ASEK3, no changes were made to the valuation methods, but the exposure unit values were ad-justed to price levels of 2001, according to consumer price index. Bertil Forsberg, researcher at Umeå University, claims that some extent of double counting might have slipped into the health valuations of particles.42 The connections behind calculated effects of particles might partly in-clude correlating pollution by nitric oxide. If, which Forsberg believes, this has not been adjusted for, the particle effects might have been somewhat overestimated.
36
Poly-Aromatic Hydrocarbons.
37 SIKA (1999). 38VOLY=VOSL/?L
acc, where ?Lacc denotes the discounted number of years of life lost for an average tra
f-fic -accident death. Leksell (2000).
39
This procedure is briefly discussed in section 8.1.2, p. 35.
40
See section 6.3.2, p. 23.
41
In the first ASEK Report, environmental costs of air pollution were valued according to political deci-sions. In ASEK2, it was suggested that this method was applied also hencefort h, but up to date this has not been done.
42
It has been suggested by SIKA that forthcoming ASEK values should be based on the methods of ExternE, a European Union project valuing external costs within the energy and transport sec-tors.43
5. EARLIER STUDIES AND HOW THIS ONE DIFFERS
5.1 CARLSSON ET AL. 1995The 1995 study ‘Studded tyres – socio -economic calculations’44 is to the author’s knowledge the only thorough Swedish studded tire CBA that has so far been carried out. The calc ulations were based on the winter of 1993/94 and on predictions for the winter of 1999/00, with the difference that during the latter, most studded tires would be lightweight, implying less pavement wear. It was estimated that compared to summer tires, studded tires reduce the risk of accidents by 40 per-cent in countryside areas and by 35 perper-cent in densely populated regions. Equivalent numbers for non-studded winter tires were set to 25 and 20 percent, respectively. Should there be a ban on studded tires, it was assumed that 80 percent of the former users would instead provide themselves with non-studded winter tires, while the remaining 20 percent would keep their summer tires all year round.
According to the model that was used, a ban would lead to net social costs. The accident rate would increase by almost 10 percent of the total number of police reported accidents involving at least one car during winter time, or 20 percent of the number of accidents during wintry road con-ditions. The death rate would increase by almost 20 people and the number of seriously injured would increase by almost 170. However, the uncertainty with these numbers was large.
The pavement wear from studded tires was estimated to be 300 000 tons (130 000 tons in 1999/00), and the resulting maintenance cost was calculated as the wear mass multiplied by an av-erage price per ton of pavement material. Other calculated effects related to tire costs, gasoline, and car cleaning. Health and environmental effects, except that of diminished need of car cleaning, were omitted from the calculations due to the difficulties in measuring them. All in all, most num-bers were highly uncertain, but no sensitivity analysis was made since the results showed so strongly that a ban would imply net costs to society.
5.2 THE NORWEGIAN ROAD GRIP PROJECT
The Norwegian Road Grip Project developed a model in the mid 1990’s to calculate socio-economic costs that would follow changes in the use of studded tires, salting of roads, and speed limits. Effects and costs of different scenarios were estimated, emphasizing road safety and health costs due to emissions of PM10, but also tire costs, time, road maintenance, and discomfort from
soiling. According to the model, a ban on studded tires in Norway would not be beneficial. How-ever, a decrease in the use of studded tires to 20 percent in the four largest city regions would im-ply net social benefits, with the use elsewhere unchanged.45
Uncertainties were principally connected to the calculated health costs; however, the results were still regarded as robust. Two thirds of the difference in accident rates when comparing studded with non-studded tires were ascribed to their divergence in friction levels, while the remaining third was attributed to impairment in road conditions. The given explanation to this latter effect was that when no studs are used, ceteris paribus, wearing ice and hard snow away takes longer time, and slippery ice turns more slippery.
43
The homepage of the ExternE project can be found at http://externe.jrc.es/
44
Carlsson et al. (1995).
45
The findings of the project resulted in incentives towards car owners not to use studded tires in Oslo/Akershus; each owner that put on non-studded winter tires was given 1 000 Norwegian
kro-nor, while those who used studs instead had to pay the equivalent amount. The goal of a studded
tire share rate of 20 percent was reached in 1999 and 2001, but when the incentives were taken away the following year, the use swiftly increased to 32 percent. In Trondheim, equivalent meas-ures were introduced in 2001, and it is planned that they shall remain until the goal has been reached.46
5.3 THE PRESENT ANALYSIS
The structure of the Road Grip project is far too large-scale to be imitated in this essay. Instead, the Swedish 1995 study was used as a sort of foundation, albeit with some changes.
In the 1995 study it was asked whether it would be socially beneficial or not to ban studded tires within the country. That is, the alternative to status quo would be zero percent studded tires. In the present analysis, no zero percent alternative will be considered. The reason for this is that the Road Grip project concluded that a Norwegian full-scale ban would not be beneficial, and it is assumed that the same applies to Sweden. In fact, due to the pavement roughening effect described in sec-tion 6.2.2, p. 21, a studded tire use level of below 20 percent is not advocated.
The reasoning behind the assumption is as follows: The pavement used on Norwegian roads is in general softer than in Sweden, and therefore wears more easily.47 Also, heavy trucks with studded tires are commonplace in Norway, while a fairly rare sight in Sweden. Consequently, studded tires should imply larger damage on Norwegian roads than on the Swedish road network. Thus, if a ban would not be beneficial in Norway, it should be even less so in Sweden.
Furthermore, the Swedish 1995 study did only briefly mention some of the effects involved, this due to lack of data. Still today far too much knowledge is missing in order to fully understand all the implications of studded tire use. However, the health cost of particle emission from road abra-sion has been estimated, the assumed environmental effects are somewhat more thoroughly pre-sented, and maintenance and soiling costs have been estimated through different procedures than those of 1995.
As counterfactual project48 stands the level of studded tire use as of 2001,49 i.e. ‘status quo’, while a decrease of ten percentage units in the use is considered as a possible alternative. All effects that have been bestowed with monetary values seem to be linear, and the results may easily be mult i-plied to reflect a larger decrease, or reversed to illustrate the monetary effects from an increase in the use (the benefits of a decrease become costs, and vice versa). Note that although not explicitly considered in the analysis, a total ban on studded tires may be evaluated by reversing the results of the status quo option.
That a decrease in the use has been chosen as primary alternative to status quo is in line with thoughts on studded tires in countries such as Norway, Japan, and Germany. It seems that it is only in Finland that studded tires are more common, and more readily advocated by the authorities, than in Sweden.
How could such a decrease be obtained? In Oslo, a decrease in the studded tire use level to 20 per-centage units was reached through concrete economic incentives, namely a fee bestowed on those
46
http://www.piggfritt.com
47
Torbjörn Jacobson, personal communication.
48
See section 3.1.1, p. 9, for a brief explanation.
49
2001 was chosen since the studded tire use level was estimated in this year (see Table 1, p. 19). The stud-ded tire use and all effects are assumed to remain approximately at the same levels as are presented in the analysis.
choosing to use studs, and an equally sized ‘reward’ to those refraining from it. The incentive worked satisfactorily, but the effect disappeared as soon as the stimulus was taken away.
A value added tax placed on studded tires could give similar results and be more in line with the kind of economic incentives that are commonly used to reach environmental goals in Sweden. However, such a measure would of course imply income distribution effects. Information on stud-ded tire externalities could be an alternative – it was successfully used in Japan around 1990 – but would not allow for any specific effects to be antic ipated.
6. ANALYSIS
6.1 A STUDDED CBA INTRODUCTION
For those effects of studded tire use that there is reasonably quantifiable knowledge, approximate monetary values have been stated, while those remaining are merely discussed. The Swedish soc i-ety, meaning the Swedish state and its citizens, is assumed to receive the benefits and pay the costs. ‘Benefits’ and ‘costs’ refer to positive and negative effects on social welfare and are ex-pressed in monetary terms. The final results are implicitly judged within the frame of the hypo-thetical Pareto criterion.50
All known effects of studded tires are divided into one direct effect, namely improved traffic safety, and a number of indirect effects, namely increased friction through pavement roughening, maintenance costs from road abrasion, health impacts, impacts on the environment, soiling of roads, verges, and vehicles, increased noise, and ‘miscellaneous’. It also happens to be that the im-proved traffic safety effect, directly as well as indirectly through pavement roughening, is the only known benefit from studded tire use, while the other effects are considered to be costs.
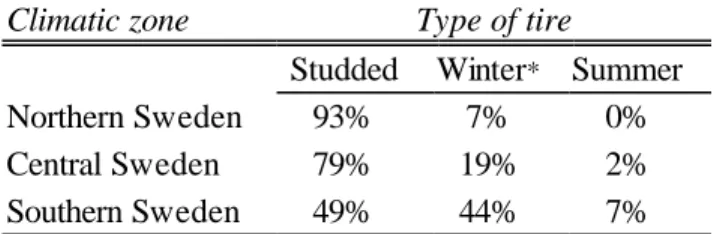
The accident statistics are dated January-March, and November-December of 2001, while the trav-eled distance data are of 1998, but have been approximately adjusted to 2001. The studded tire use rates applied as bases for the calculations are of February 2001 (see Table 1). Since the studded tire use varies over the winter season and that February normally has more of ice and snow on the roads than November and March, these rates are probably higher than the winter season average. And therefore, studded tire rates of 70, 40, and 60 percent have been used as approximates for cen-tral Sweden, southern Sweden, and Västra Götalands län,51 respectively.
Studded tire benefits and costs are estimated and discussed at the approximate studded tire use le v-els of 2001 (‘status quo’), as is the benefit/cost of decreases of 10 percentage units in these levv-els. The only known threshold level is at a studded tire rate of about 20 percent, below which the pavement roughening effect is believed to decrease.52 Other than that, the effects seem to be linear according to the models that have been used.
Table 1. Tire use in different climatic zones, February 2001.
Climatic zone Type of tire
Studded Winter* Summer
Northern Sweden 93% 7% 0%
Central Sweden 79% 19% 2%
Southern Sweden 49% 44% 7%
Source: Velin et al. (2002).
* Winter tires include non-studded and friction tires.
50
The hypothetical Pareto criterion is presented in section 3.1, p. 9.
51
See Table 2, p. 20.
52
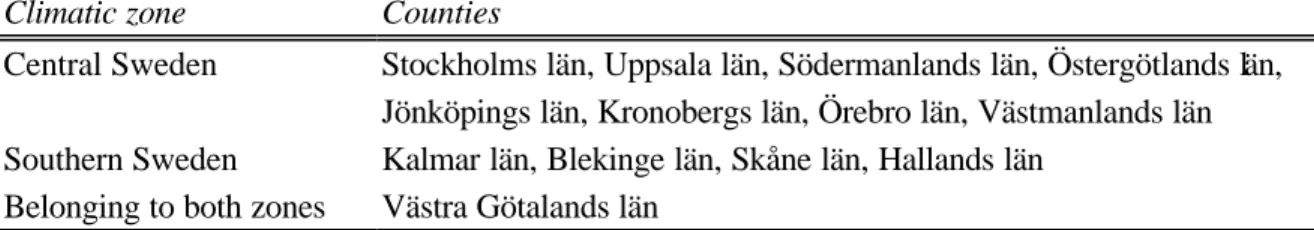
With reference to the population and climatic patterns of Sweden, it is assumed that the low popu-lation density and more of wintry road conditions in the north make a studded tire discussion less relevant for these areas. Consequently, only the 13 southernmost counties have been included (see Table 2).53 With the 1999 winter tire law in mind, it is assumed that all non-studded tires are win-ter tires, i.e. zero percent are summer tires. This is a simplification that is not in agreement with the numbers in Table 1. It is, however, argued that the traveled distance by cars with summer tires may be presumed to be very small on days with severe winter road conditions.
Table 2. Counties included in the analysis.
Climatic zone Counties
Central Sweden Stockholms län, Uppsala län, Södermanlands län, Östergötlands län, Jönköpings län, Kronobergs län, Örebro län, Västmanlands län Southern Sweden Kalmar län, Blekinge län, Skåne län, Hallands län
Belonging to both zones Västra Götalands län
As there are no reliable data for the local authority road network, including most urban roads, trav-eled distance estimations have been applied in order to calculate the wear masses relevant for the studded tire health and soiling costs. Also, the valuation model used was originally intended for exhaust PM2.5, while not for the road abrasion PM2.5 that is in focus here. These and other
uncer-tainties will be further discussed in the sensitivity analysis in section 7.1, p. 30.
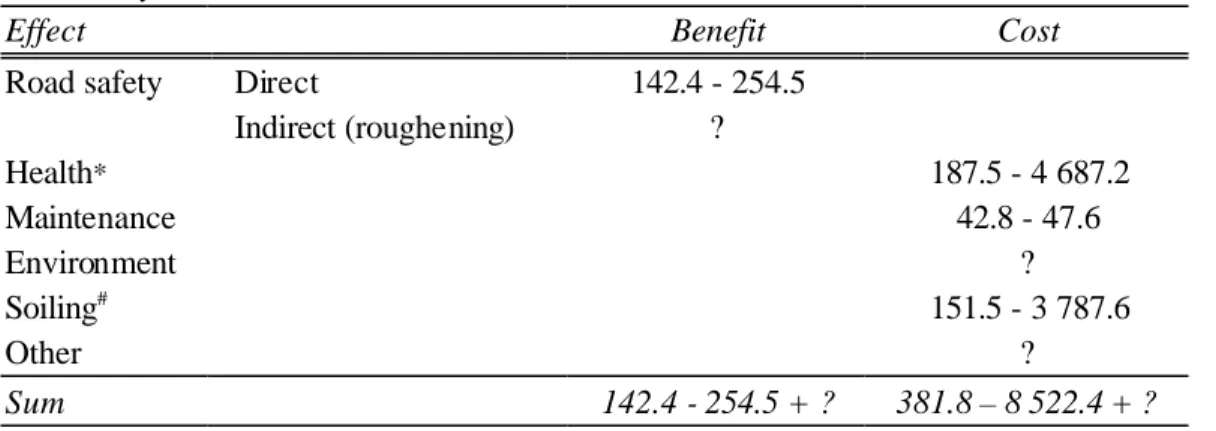
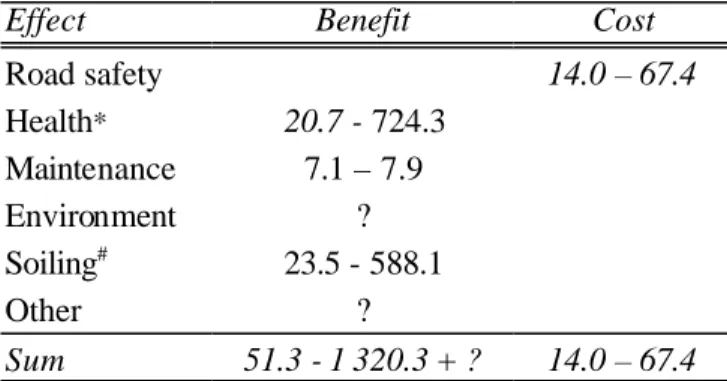
Monetary values have been calculated for direct safety benefits, maintenance costs (due to pave-ment rutting), health costs, and soiling. The calculation procedures for these can be found in Ap-pendix I, p.41. Actual and estimated accident statistics are presented in ApAp-pendix II, p. 46, while the operation conducted to estimate total wear masses, depending on the studded tire use level, is placed in Appendix III, p. 48.
It is claimed that there are several environmental costs due to the use of studded tires; however, no new monetary valuation of these has been embarked upon. Also, roughening of asphalt, noise, and possible other effects are briefly discussed, but not valued.
All stated costs/benefits reflect the calendar year of 2001, concern only the included counties, and are expressed in SEK at the price level of 2001.
6.2 STUDDED TIRE BENEFITS
6.2.1 Road safety
Studded tires are used to increase friction and thereby safety. Nevertheless, it is debated whether the higher friction rate of lightweight studded tires compared to other winter tires is of help only on icy roads, or whether the effect is as la rge also on snow. Studies have shown quite different re-sults.
In a Norwegian study, Fridstrøm (2000) concludes that the use of studded tires overall has only a rather slight significance for road safety – at least within more densely populated areas. With a hy-pothetical decrease of the studded tire use by 50 percent in the four largest city areas, the estimated average change in accident rates was three percent and within the normal variation of accident rates between Norwegian winter seasons.
According to Fridstrøm, one reason for this is that during wintry road conditions, drivers with studded tires tend to keep higher speed than drivers without. Thereby, the accident rate increases
53
Gotland has not been included, due to its distinct climatic patterns. This exclusion, however, is not be-lieved to have influenced the results to any significant extent.
with the studded tire rate where there is snow on the road and a temperature below zero degrees Celsius. The beneficial effect of studded tires is instead where roads are icy but do not seem to be so, or when there is a change in temperature that rapidly changes road conditions, surprising the driver. In these cases, the better friction of studded tires on hard snow or ice will decrease the risk of accident.
However, in an older Finnish study, although the same phenomenon was seen, it was claimed that the lower speeds of non-studded tire users do not fully outweigh the friction difference between the tires.54 And quite contrary to Fridstrøm’s results, in an Icelandic study (1989-95) drivers with
studded tires drove more carefully than others.55 If so, it might be suggested that risk averse people (that drive cautiously) are more prone to use studded tires.
The authors of the Swedish 1995 CBA56 claimed that the safety advantage of studded tires is rather substantial. It was estimated that during icy/snowy road conditions, studded and non-studded win-ter tires decrease the accident risk at certain rates compared to summer tires; see Table 3.
Table 3. Accident reduction effect on snow/ice
compared to summer tires.
Tire Countryside Urban areas
Studded 40% 35%
Winter 25% 20%
Source: Carlsson et al. (1995).
Consequently, the accident risk of studded tires would be 40 percent lower in countryside areas compared to that of summer tires. With these presumptions, Carlsson et al. used a model to calc u-late the number of car accidents on ice or snow that would have been if all cars used summer tires. It was assumed that there is no significant divergence in accident risk between different tires on dry road conditions. Although these numbers of accident reduction effects are seemingly rather uncertain, they have been applied also in this study as the best available alternative.
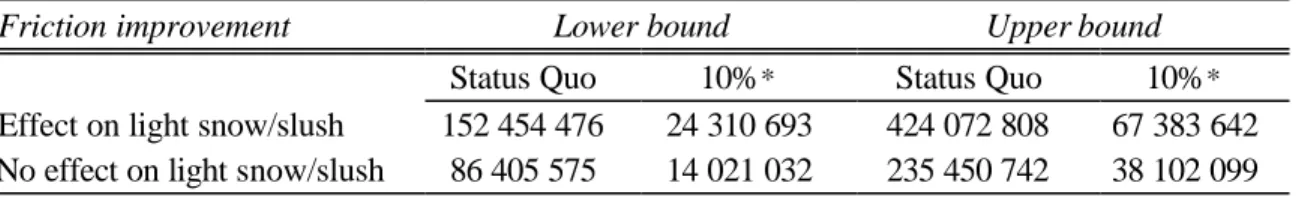
6.2.1.1 Results - road safety
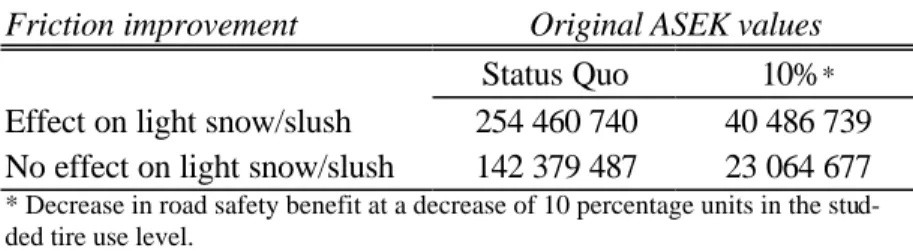
Due to the uncertainty of the safety benefit of studs on light snow and slush, calculations have been made both for the assumption that there is such an effect, and for the assumption that there is none. The original road safety ASEK values were estimated through the contingent valuation method, presented in sections 4.2.2 and 4.3.1 (pp. 14 and 15). The calculated results, presented in Table 4 below, are based on accident numbers exhibited in Appendix II, but divided also according to county, and the calculation procedure is presented in Appendix I A.
Table 4. Road safety benefit of the studded tire use of 2001. Included counties
only.
Friction improvement Original ASEK values
Status Quo 10%*
Effect on light snow/slush 254 460 740 40 486 739 No effect on light snow/slush 142 379 487 23 064 677
* Decrease in road safety benefit at a decrease of 10 percentage units in the stud-ded tire use level.
6.2.2 Roughening of asphalt
The use of studded tires gives an indirect safety benefit, roughening the pavement surface so that also vehicles with non-studded tires are given better friction. During the summer season, and 54 Carlsson et al. (1995). 55 Sigthorsson (1998). 56 Carlsson et al. (1995).
cially on wear-resistant pavements, heavily used roads may become polished, leading to poorer friction.57 With zero percent studded tire use, roughening would have to be done mechanically with machines to avoid diminished road safety. At a studded tire use level of approximately 20 percent, the roughening effect is believed to be sufficient and the cost of ‘manual’ roughening is effectively omitted.58
Mechanical roughening has not been done in Sweden, and its would-be cost is not readily avail-able. In this study, it is claimed that a studded tire use level of less than 20 percent would probably not be beneficial. Since it is only below that level that the roughening effect would be notic eable (i.e. it would decrease), no further effort has been put into a cost/benefit estimation.
6.3 STUDDED TIRE COSTS
6.3.1 Road abrasion - maintenance
All or nearly all of the abrasion that occurs on asphalt pavement over the year is an effect of stud-ded tire use during winter.59 In the early 1990’s, studded tire pavement wear amounted to ap-proximately 450 000 tons per winter season.60 Since then, the use of increasingly wear-resistant asphalt pavements, such as mastic asphalt, combined with higher stone contents and the develop-ment of lightweight studs, has significantly diminished the pavedevelop-ment wear from studded tire use. In the winter season of 1994/95, the wear was calc ulated to be 300 000 tons and in the late 1990’s, it had diminished to around 110 000 tons.61 As it seems, the development towards studs and pave-ment that entail less abrasion has at least temporarily slowed down,62 and the wear is again grow-ing with the increase in traffic. Another influencgrow-ing factor is the winter tire law, which has led to an increase in studded tire use. The estimated wear in 2001 was 118 000 tons.63 But due to the strong decrease in both absolute and relative (per studded vehicle) wear, road abrasion through the use of studded tires is no longer considered a large problem as for the maintenance costs it brings. The wear is measured through the SPS ratio (specific wear, grams of abraded material per vehicle with studded tires and kilometer). This is no constant for a certain pavement type, but an approxi-mate estiapproxi-mate of actual wear in specific conditions and during a specific period. The SPS average has decreased from 30 during the late 1980’s to an average of eight at the turn of the century.64 The most wear-resistant pavements have SPS ratios of 2-4.
Weather conditions and physical conditions on the roadways largely influence the extent of both wear and airborne particles. The wear is more intense (2-7 times)65 when the roadway is wet or moist, but it increases also with speed, axel load pressure, and tire pressure.66
57
Jacobson & Hornwall (1999).
58
Torbjörn Jacobson, personal communication.
59 Lindgren (1998). 60 Folkeson (1992).
61 Jacobson (1999). The actual wear may have been slightly lower, since lower speeds (30, 50 km/h) were
not considered in the calculations.
62
Torbjörn Jacobson, personal communication.
63
See calculation procedure in Appendix III, p. 48.
64 Jacobson (1999). 65 Lindgren (1998). 66 Folkeson (1992).