University of Mälardalen
School of sustainable development and technology Innovation program-MTO
Bachelor Thesis in Business Administration, EFO703
2010
Supervisor: Cecilia Lindh Authors: Martin Eriksson, 860730 Tobias Ohlsson, 830718Preface
This thesis is written in Mumbai, India. We spent one Swedish spring semester at Welingkar University in Mumbai, from January 2010 to May 2010. We were granted a scholarship from the Linnaeus-Palme institution and that made it possible for us to go to India. During the first half of this period we took four marketing classes together with 60 Indian students. This was a great opportunity for us to get new friends and to learn about the Indian culture. Together with two German students we were the only two exchange students at the University. The fact that there was so few exchange students was a good thing for us since we then had to socialize with Indians and learn more about their world.
During the second half of our stay we wrote this thesis. Our aim was to use our experience of India and implement it into this thesis. Since we have a good relationship with the CEO, Sven Isaksson at Autoform we contacted him and asked if he was interested in the Indian market. They gave us the assignment to investigate the Indian cargo tray market, which is a big part of Autoforms production. This also included an overview of the Indian automobile industry and the Indian business environment. We accepted this assignment and by making this market research we are giving Autoform and ourselves a great knowledge about India and we also get a deeper knowledge how to conduct a sustainable market research.
Acknowledgement
We would like to thank Sten Ekman, Anna-Lill Ekman and Christer Nygren at Mälardalens University for giving us the opportunity to go to India and write this thesis. We also so want to thank Welingkar University in Mumbai & Bangalore in India for their support, especially Dr Anuja Agarwal and Dr Anil Rao.
Abstract
Title: The Cargo Tray Industry in India – A Market Research Authors: Martin Eriksson and Tobias Ohlsson
Supervisor: Cecilia Lindh
University: University of Mälardalen
Department: School of Sustainable Development of Society and Technology Course: Bachelor thesis in Business Administration, 15 credits
Research question: Is the Indian cargo tray industry a promising place for Autoform to make future investments?
Target group: The primary target is Autoform. The secondary target group is other car accessories manufacturers who want to know about the Indian car industry. The third target group is any foreign company that wants to know about India and their regulations towards foreign companies entering India.
Purpose: The purpose is to give Autoform knowledge about the Indian car- and cargo tray market, as well as to give them an overview about India and their regulations towards foreign companies entering India.
Theoretical framework: The theoretical framework consists of a PEST analysis for the business environment, Porters five forces for the cargo tray industry and our model for the overview of the automobile industry.
Methodology: This thesis is based in both primary and secondary information that have been gathered within the frame of our theoretical framework.
Analysis/Discussion: The analysis consists of a comparison between the empirical content from each of the different models used for the empirical research. By highlighting the most relevant findings of the data from each model and put it together we can draw conclusions and make direct connections between the business environment in India and the car- and cargo tray industry.
Conclusions: The answer to the research question is that the Indian cargo tray industry is a promising place for Autoform to make future investments. However there are many factors and forces to consider and be aware of.
Table of Contents
1. Introduction ... 1
1.1 Research Question & Purpose ... 1
1.2 The Potential Market... 2
1.2.1 The Indian & Swedish market Exchange ... 2
1.2.2 The Indian Automobile Sector... 3
1.3 Target Group ... 3
2. Methodology ... 4
2.1 Research Method ... 4
2.2 Development of Analytical Framework ... 4
2.3 Secondary Data ... 5
2.4 Primary Data ... 6
2.4.1 Personal Interviews ... 6
2.4.2 Consumer Research ... 7
2.4.3 E-mail Interviews ... 8
2.5 Analyzing empirical findings ... 8
3. Theoretical Framework ... 10 3.1 Pest Analysis ... 10 3.1.1 Political-Legal Factors ... 10 3.1.2 Economical Factors ... 10 3.1.3 Sociocultural Factors ... 10 3.1.4 Technological Factors ... 11
3.2 The Automobile Industry ... 11
3.3 Porter’s Five Forces ... 11
3.3.1 Threat of new entry ... 12
3.3.2 The power of suppliers ... 13
3.3.3 The power of buyers ... 13
3.3.4 The Threat of substitutes ... 13
3.3.5 Rivalry among existing competitors ... 14
4. Empirical Findings ... 15
4.1.1 Political/Legal ... 15
4.1.2 Economical ... 17
4.1.3 Sociocultural ... 19
4.1.4 Technological ... 21
4.2 The Automobile Industry ... 22
4.2.1 Market Size & Growth Rate ... 22
4.2.2 Major Players ... 27
4.2.3 Future Trends ... 30
4.2.4 Distribution ... 32
4.3 Porter’s Five Forces ... 33
4.3.1 Threats of New Entrants ... 33
4.3.2 The Power of Suppliers ... 34
4.3.3 The Power of Buyers ... 34
4.3.4 The Threat of Substitutes ... 36
4.3.5 Rivalry Among Existing Competitors ... 37
5. Analysis/Discussion ... 39
5.1 India ... 39
5.2 Auto Industry- & India’s Growth ... 39
5.3 Cargo Tray Industry ... 40
6. Conclusions ... 42
7. Further Research ... 43
References ... 44 List of Pictures
Picture 1 Cargo Tray 1 – P.1 Picture 2 Cargo Tray 2 – P.2 Picture 3 Tata Caro Tray – P.35 Picture 4 Chevrolet Mat – P.35 Picture 5 Innova Cargo Tray P.36 Picture 6 Ujwal Car point – P.36 Picture 7 Auto Component Shop – P.36 Picture 8 Rubber Mat – P.36
Picture 9 Tata Indigo Boot Space – P.37 List of Figures
Figure 2 Analyzing Data (own adaption) – P.9 Figure 3 Porter’s Five Forces (own adaption) – P.12 Figure 4 Import Duty – P.17
Figure 5 GDP – P.17
Figure 6 Currency Exchange Rate – P.18 Figure 7 Population Age – P.20
Figure 8 Share of Automotive – P.23
Figure 9 Automobile Production Trends – P.24 Figure 10 Automobile Domestic Sales Trends – P.25 Figure 11 Automobile Export Trends – P.25
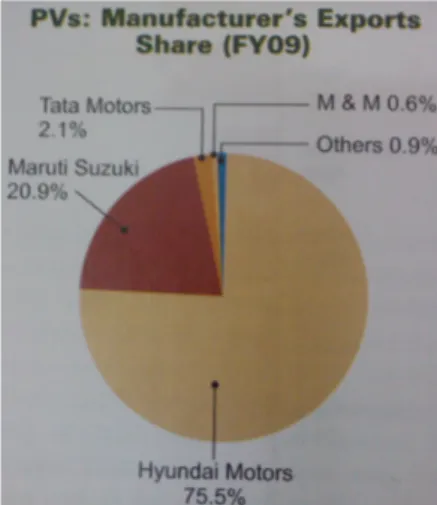
Figure 12 Export Share – P.25
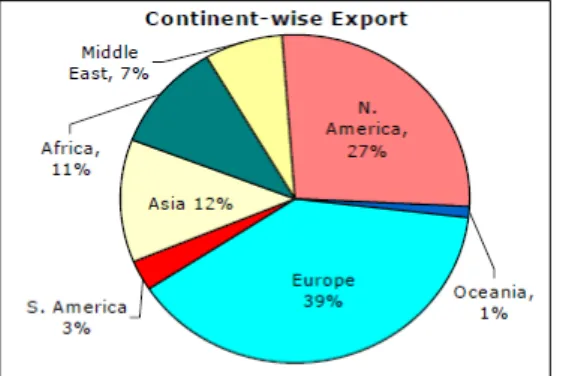
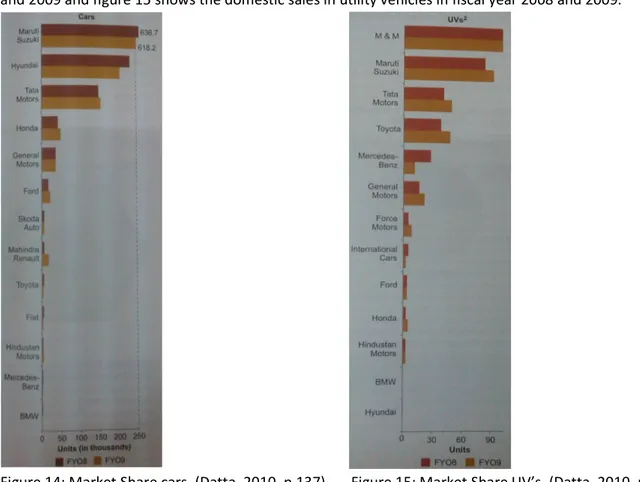
Figure 13 Continent-wise Export Trends – P.26 Figure 14 Market Share Cars – P.27
Figure 15 Market Share UV’s – P.27 Figure 16 Segment A2 – P.28 Figure 17 Segment A3 – P.28 Figure 18 Segment UV’s – P.29 Figure 19 Car Segmentation – P.31
Figure 20 Car Segment Sales Growth – P.31 Figure 21 Auto Affordability – P.32
List of Appendix
Appendix 1 Auto Component Shops – P.52 Appendix 2 Car Dealers – P.53
Appendix 3 Garage – P.54
Appendix 4 Manufacturers – P.55
Appendix 5 Further Research/Business Models – P.56 Definitions
FDI – Foreign Direct Investment WTO – World Trade Organization GDP – Gross Domestic Product PPP – Purchasing Power Parity SEZ – Special Economic Zones R&D – Research and Development RBI – Reserve Bank of India UV – Utility Vehicle
SUV – Sport Utility Vehicle MUV - Multi Utility Vehicle
Cargo Tray - Can be described in many words. Except from the word Cargo Tray, words like Trunk Tray, Cargo Liner, Cargo Mat, Anti Slip Mat and Trunk Liner are words used in Europe for the same product.
In India the word Cargo Tray sometimes means the tray that is between the boot space and the passenger coupé, as seen in the picture below. In India the words for Cargo Tray is Boot Space Mat, Dicky Mat, Rubber Mat, Boot Mat and Luggage Space Mat. In this thesis we have choose to use the word Cargo Tray.
1
1.
I
NTRODUCTION
Autoform is today one of Europe's leading manufacturer of vacuum formed plastic products to the global automobile and aftermarket industry for automobile parts. The company is a part of Calix Group AB, together with Pepe AB and Calix AB. They are located in Malung, Sweden and have approximately 85 employees. The Production is focused on vacuum forming of thermoplastics. Their main product groups are roof boxes, cargo trays, cargo cover, storage boxes for the trunk, and contract production of custom plastic components for various purposes. (autoform.se, about)
The production is located in Malung, and the export share is around 80 percent and is spread across Scandinavia, Europe and the U.S. Autoform currently has partnership with 19 of the world's leading automobile manufacturers who market their products as original accessories under its own brand, for example Ford, Toyota and Mercedes. Each product is customized for each vehicle model and their development team designs the products in 3-D environment in close Cooperation with their partners. They are also active in the aftermarket for car accessories in which they advertise cargo trays and cargo covers under its own brand. (autoform.se, about)
The Indian market is different in many ways from the European- and the US market. The government of India has a range of different regulations applied towards foreign companies that is important to have knowledge about when considering India as a potential market.
As mentioned above Autoform is currently working in the European- and the US market. As the Indian market has been growing over the last two decades, Autoform find this market interesting. Autoform is interested in either to export their products or to build their own factory in India to reach the Indian market. The problem is the lack of knowledge about India and the Indian car- and cargo tray Industry.
1.1
R
ESEARCHQ
UESTION&
P
URPOSEIs the Indian cargo tray industry a promising place for Autoform to make future investments?
The purpose of the thesis is to give Autoform knowledge about the Indian car- and cargo tray industry, as well as to give them an overview about India and their regulations towards foreign companies enter India. By doing this we will get answers on whether the Indian market is a potential market for future investment for Autoform.
This market research is focused on cargo trays. Autoform are using vacuum technique to form their cargo trays and the raw material they are using is PP (Polypropene). They are perfectly fitted to each car model, light weight, thin, stable and easy to remove and clean. As seen in picture 1 and 2 the cargo trays are formed with edges.
2
Picture 2: Cargo Tray 2 (autoform.se, about)
1.2
T
HEP
OTENTIALM
ARKETIndia is today the world’s biggest democratic country with almost 1.2 billion inhabitants and the worlds 12th biggest economy. Indian is a diversified country with 22 official languages and many different religions, the biggest religion is Hinduism and 80.5 percent of the population is Hindus. (swedishtrade.com, India Fact Pack)
1947 India became free from over 200 year rule by Britain. The following years after the proclamation of independence India adopted a nationalistic socialist posture towards the economy. The philosophy was self-reliance and self-sufficiency and to keep foreign companies out from India the government introduced high tariffs on imported goods. (Bharath et al 2007, p.68)
The 1980s was the start for India’s economic liberalization but it was not until 1991 the real breakthrough reforms started. 1991 is often mentioned as the year when new India was born and at that time various reforms where done to deregulate the economy and to open up the market towards international trade and investment. The reforms gained a positive effect on India’s economy and the GPD increased together with the foreign direct investment. (Parikshit, 2007, p.666) Since then various reform have been made, for example the modification of the tax structure in 1997, and the reform programs are still in progress (swedenabroad.com, Om Indien).
Since the beginning of the 1990s, India’s annual growth of GDP has been around six to seven percent except from 2005-2007 when the growth of GDP was more than nine percent. This makes India to one of the world’s fastest growing countries. The growth rate decreased in 2008-2009 partly because of the global financial crisis but the growth rate is predicted to stabilize around six to seven percent within the next few years. (swedenabroad.com, Om Indien)
Even though India is growing fast and the middle class segment is increasing rapidly, the poverty in India is a big issue. In 2009, 350 million people lived below the poverty line of less than one dollar per day, also called absolute poverty. This makes India to the country in the world with the highest number of people suffering from absolute poverty. (Kalyanaram, 2009, p.57-58)
1.2.1THE INDIAN &SWEDISH MARKET EXCHANGE
Sweden is a small trading partner for India, 0.8 percent of India’s import market is Swedish and 0.3 percent of India's exports go to Sweden. But this numbers are likely to change in the future as the
3
trading volume grew 17.7 percent between 2007 and 2008. (swedishtrade.se, India Fact Pack) The main Indian import from Sweden is engineering products, telecom fuel, chemical products and raw materials and because of the relatively cheap labor in India some of Sweden’s biggest company’s such as H&M, Astra Zeneca and Volvo have factories in India. Some of the main Indian export to Sweden is leather products, machinery and instruments, cotton, fabrics, carpets and handicrafts. (indianembassy.se, Indo - Swedish trade)
1.2.2THE INDIAN AUTOMOBILE SECTOR
India is now the 11th largest market in the passenger cars segment, and is expected to be the 7th largest market in the world by 2016. Since early 2008 the world is facing the impact of the cruelest downturn of the past 60 years. In the US and Western Europe all auto markets registered a decline in sales and orders. The automotive sales fell by 5 to 6 million units worldwide during the year of 2008 and the situation was at its worst the last quarter of the year. (Datta, 2010, p.131)
The Indian domestic auto industry had a double-digit growth for around five years in a row until 2008, but has slowed down and the growth for 2008-09 was around 3.4 percent in production. The worst period was in October 2008 when the fall was most evident and each segment ended up in negative. growth (Datta, 2010, p.135)
Despite the global automobile industry continued to decline in 2009, the Indian industry mostly went against the trend, launched new models for the domestic market and also registered a growth in exports. During 2007-08 the overall car market in India grew around 15 percent, and experts predict a similar pattern in 2010. (economictimes.indiatimes.com, Indian auto industry, 2009-12-25)
According to Ernst and Young the Indian passenger car market is predicted to grow at twelve percent annually over the next five years. That means from 1.89 million units at 2008-09 to around 3.75 million units by 2014. The growing auto industry in India is largely driven by the country's large middle class with growing disposable incomes. (economictimes.indiatimes.com, Indian auto industry, 2009-12-25)
Indian Auto component Industry is an emerging industry in India and the industry constitutes only around 0.4percent of the global auto component industry and is expected to increase to around 1.5percent by 2015 (Cygnus, Indian auto components, 2009, p.5). The industry is one of India’s fastest growing manufacturing sectors and between fiscal years 2004 and 2008 it had a compound annual growth rate of 27.8 percent but slowed down during the worst period of the financial crisis (ibid, p.6). The turnover in 2008-09 was over US$ 19.1 billion and the industry's is estimated to touch US$ 40 billion by 2015-16 (ibef.org, Auto components, 2010).
1.3
T
ARGETG
ROUPThe primary target is Autoform. The secondary target group is other car accessories manufacturers who want to know about the Indian car industry. The third target group is any foreign company that wants to know about India and their regulations towards foreign companies enter India.
4
2.
M
ETHODOLOGY
In this chapter we will present the different methods we have used to conduct the market research.
2.1
R
ESEARCHM
ETHODAll of the interviews we have conducted are qualitative except from those made in the garage. The aim with those interviews was partly to gather information about their perception and usage of the cargo tray and hence that gathering of information can be considered quantitative. We also use data based on numbers and diagrams in this thesis, especially in the chapter about the automobile industry. This can also be considered as a quantitative approach.
This thesis is partly about understanding and partly about prediction, understanding about India’s business environment and the cargo tray industry and prediction about what the future will look like in the automobile industry, indirect the cargo tray industry.
2.2
D
EVELOPMENT OFA
NALYTICALF
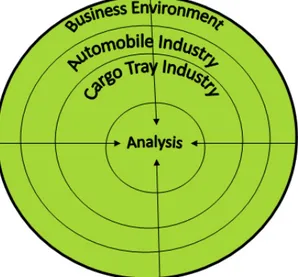
RAMEWORKThe cargo tray industry is a part of the automobile industry and both of them is a part of India’s business environment. To make a solid market research and to answer the research question we had to include the industry where the product appears and the environment in which it appears. With this in mind we searched for suitable methods for both industries and for the analysis of the business environment in India.
We came up with a PEST analysis for the business environment, Michael E. Porter’s five forces model for the cargo tray industry and our own model for the overview of the automobile industry. PEST analysis includes political, economic, sociocultural and technology factors (netmba.com, PEST Analysis). Porter’s five forces include suppliers, customer, potential entrants, competitors and substitute products (Porter, 2008, p.3). Our own model includes market size and growth rate, major players, future trends and distribution.
To identify the macro factors on the Indian market we decided to use a PEST analysis. The PEST analyze only considers the external macro environment around a company and the model is a good complement to Porter’s Five Forces (netmba.com, PEST Analysis). We used Michael E. Porters model, Porter’s five forces because the model is appropriate to determine the competitive intensity in different markets. We find that Porter’s five forces are an easy and effective way to describe a rather complex analyze. To answer the research question we had to gather information about competitors and their situation on the Indian market. To present this information in a simple and effective way we thought that Porter’s five forces was the best alternative. The cargo tray industry is a part of the automobile industry and in order to make a sustainable market research about the cargo tray industry the automobile industry is important to take in consideration and we used our own model to gather information about the automobile industry. Figure 1 describes the analytical framework.
5
Figure 1: Analytical Framework (Own adaption)
2.3
S
ECONDARYD
ATAChristensen (2001, p.87) has defined secondary data as information that already has been collected and is available in types such as magazines, research papers, articles, books, trade information and the Internet. The answer to many questions are often found in the reports from organizations or in other published materials. Secondary research is an established method for collecting secondary data, the advantages are that there is a wide range of sources, it is cost effective, time efficient, and can be performed with complete confidentiality (Chisnall, 1986, p.37). The disadvantages are that useful data may be missing (Christensen 2001, p.102). There is also a possible risk that some secondary data that is found is collected for a different purpose with lack of objectivity (Ghauri et al 2005, p.91).
The secondary data collection should be made in the initial phase of a research, because the information from this data may often be sufficient for the further research and will help to develop the overall research strategy (Chisnall, 1986, p.37). We started or work collecting data from the Internet, textbooks, research papers, journals and articles. To find articles and journals we used Mälardalens University databases Elin@malardalen, Emerald and also Emergin market information service (EMIS) database from Welingkar University. This gave us a good basis for how to plan the further research and what gaps we had to fill with primary data.
6
2.4
P
RIMARYD
ATAThe cargo tray industry is a small and very specific segment in the auto industry. The existing secondary data of this segment is limited which makes the work dependent on primary data. Primary data collection methods are decided and controlled by the researcher (Brannick, p.16). After gathering all the secondary data we saw were information was missing and where we needed to make effort to collect primary data. When secondary data is not good enough to answer your research question primary data becomes crucial to ensure the quality of the research. (Ghauri et al 2005, p.102) We had a hard time finding any secondary data on the cargo tray industry in India so most of the primary research was focused on this part.
One of the problems with primary research is to find companies that are suitable for the kind of survey that you are conducting (Chisnall, 1986 p.251). Help from an expert is valuable in forming hypotheses about certain market situations. Researchers should attempt to contact these experts who may be recommended to them by helpful sources. (Chisnall, 1986 p.252) We took advantage of the broad net of contacts that Welingkar University possesses and that helped us to collect some of the information we needed for the primary research.
The main focus of the primary data collection was to gather information about the cargo tray industry. We wanted to get information about different materials, different manufacturing methods, pricing, and concentration of cargo trays in Indian cars, etc. We gathered information from manufacturers, car dealers, auto component shops and from the final consumers that is the car owners. We chose to interview various parts of the chain of distribution of the cargo tray to get as much and reliable data as possible. During the interviews we have always been two persons to avoid that no information would be lost and to maintain objectivity.
2.4.1PERSONAL INTERVIEWS
There are a large number of interview techniques and it is important to be aware of the information the various interview forms tend to produce. We decided to use personal interviews with open ended questions where we had questions as a framework. When the personal interviews are used it provides a flexible situation which has several advantages. For example by performing this interview method any misunderstanding or ambiguity can be clarified because you can easier explain the meaning of the questions. Personal interviews also provides the advantages of open ended questions to be used in a more useful way and to have open ended questions contributes to a better understanding of the respondent’s personal experience. (Wärneryd, 1993, p.13-14)
We thought that the different respondents would give different facts and insights about the cargo tray. Therefore we used this interview technique so as not to limit the respondents to provide information only about the questions we asked. To make the interviews as smoothly and conveniently as possible one of us quoted aid schemes, while the other took care of the interview. The negative aspect of this interview method was that it sometimes became a bit difficult to keep up with the writings and sometimes the interviews lost focus.
7
We choose to interview four different car dealers representing five different major car brands and three different auto component shops in Mumbai, India. Below, we present the respondents.
The interviews were made on the basis of convenience sampling. All respondents are selected based on whether they had time to meet us or not. The respondents for personal interviews were auto component shops and car dealers and we used different framework of questions for these two. See (Appendix 1) for the auto component shops and (Appendix 2) for the car dealers.
Ujwal car point is an auto component shops in Sion, Mumbai. Sion is a district that is famous for their high concentration of car related shops on one of the streets there are 14 shops. At Ujawal car point we interviewed the manager and owner Sonu. Sonu spoke perfect English but was very stressed so the interview was over quick. These shops are usually very small so the interview situation was kind of noisy with people running around. Sonu will be referred to as Sonu at Ujawal.
Laxman is another auto component shop in Sion, Mumbai located only 20 meters from Ujawal car point. There we spoke to Rohit Gaupta who was the manager and owner. Rohit was a little bit difficult to understand and the same conditions prevailed there as at Ujawal car point. Rohit Gaupta will be referred to as Rohit at Laxman.
Lakshmi was the third and last auto component shop that we interviewed. Lakshmi is located at the same street as the two previous shops. There we spoke to Ankush Taiwar who was a very nice and helpful manager. Ankush Taiwar will be referred to as Ankush at Lakshmi.
Auto Hangar (India) Pvt. Ltd. is a certified dealer for Mercedes-Benz in Mumbai, India. At Auto Hangar we interviewed to Yash Mody who is a Sales consultant. Yash Mody was very helpful and gave us a lot of insights. Yash Mody will be referred to as Yash at Mercedes-Benz.
Jayabharat Automobiles Limited is a certified dealer for Hyundai in Mumbai, India. At Hyundai we interviewed Nayan Chauhan who was a Sales consultant. Nayhan Chauhan will be referred to as Nayan at Hyundai.
Concorde Motors (India) Limited is certified dealer for TATA Motors and Fiat in Mumbai, India. At Concorde we interviewed Pankaj Adrekar who was a senior executive. He was a very nice man and really took his time with us. Pankaj Adrekar will be referred to as Pankaj at TATA.
Nikhil Automobiles Pvt. Ltd. is a showroom for Chevrolet in Mumbai, India. First we interviewed Vaibah Mirajkar who is a senior sales consultant and when he could not answer the questions anymore, Sendeep Juvali who is Accessories In charge helped us out. Both of them were very helpful and accommodating. Vaibah Mirjakar will be referred to as Vaibah at Chevrolet and Sandeep Juvail will be referred to as Sendeep at Chevrolet.
2.4.2CONSUMER RESEARCH
As another part of the field research we decided to talk to the car owners of Mumbai, this was the first primary data collection that we did. The aim of this method was to find out what kind of cargo trays
8
people in India used and how many cars actually had a cargo tray. In addition to this we got insights about people’s knowledge and attitudes towards the cargo tray.
In order to carry out the study we used the garage in the basement of Welingkars University in Matunga, Mumbai, as the survey site. When a car owner (usually faculty of the university) came down to the basement to retrieve their cars we asked them if it was in order to ask a few questions and in 100 percent of the cases it was ok.
We used a framework of questions (Appendix 3) and took notes, but depending on how receptive the respondent was we held the interviews for different periods of time, usually 4-5 minutes. We asked all respondents if we could peek into their luggage compartments and in all cases except two it was ok. In total, we interviewed 48 car owners. This survey will be referred to as the garage.
2.4.3E-MAIL INTERVIEWS
In order to obtain information from the manufacturers of cargo trays we used e-mail interviews. We found three of the respondent on dir.Indiamart.com and alibaba.com. These two websites connect buyers and suppliers/manufactures by providing company- and contact information about various companies in different branches. The main aim of contacting the manufacturers was to get information about manufacturing methods and materials used. We sent a total of five emails and got answer from three of them which means a loss of 40 percent. We also contacted Zareer Pardiwalla who was given by the Dean of Welingkar University Bangalore, Dr. Anil Rao. He is responsible for Mahindra & Mahindra’s second hand car market so we gave him the same questions (Appendix 2) as the car dealers. We sent e-mails to the following:
Gurdeep Singh, Senior Rubber PVT.Ltd. Param Solanki, Hans Rubber Industries Sadaquat Hossain, VIP Auto Industries
Zareer Pardiwalla at Mahinidra & Mahindra. He is responsible for the second hand car market of Mahindra & Mahindra. We asked him the same the same questions (Appendix 2) as we asked the car dealers.
All of the respondents will be referred by their first name plus company name.
We used a mix between close ended questions and open ended questions and we choose to write the questions directly in the email (Appendix 4) and not to attach a document or survey, just to facilitate the response process from the respondents.
2.5
A
NALYZING EMPIRICAL FINDINGSThe analysis consists of a comparison between the empirical content from each of the different models used for the empirical research. The analyze focus on the most beneficial aspects and the most negative aspects from Autoforms point of view. By highlighting the most relevant findings of the data from each
9
model and put it together we can draw conclusions and make direct connections between the business environment in India and the car- and cargo tray industry.
By objectively looking at the analysis we can make suggestions to Autoform how and if to enter India. Figure 2 shows how we interweave the three different areas to create an analysis.
10
3.
T
HEORETICAL
F
RAMEWORK
In this chapter we will present the theoretical framework that we have used to conduct the market research.
3.1
P
ESTA
NALYSISThere are many factors in the macro environment that will affect the decisions a company has to take when entering a new market. These factors are dynamic, in most cases uncontrollable and differ around the world. To investigate these factors we have chosen PEST analysis. The P stands for political factors, E for economical factors, S for sociocultural factors and T for technological factors. Sometimes is legal and environmental factors added but we decided to not include those because political and legal is best described together and in this research the environmental factor is not crucial. In some cases the PEST- or the PESTLE factors is divided into Local, National and Global (oup.com, pest-analysis, 2007). We have focused on the National aspect. The content in the four factors are very different depending on who the investigator is.
3.1.1POLITICAL-LEGAL FACTORS
The political system existing in a country decides, promotes, encourages, shelters, directs and controls the business activities in a country. A political system that is efficient, stable and dynamic, by democratic principles ensures citizens involvement in politics is a primary factor for economic development (Aswathappa, 2009, p.130) Sometimes change in the laws can create new opportunities in business. For example have the regulations of recycling and environmental - friendly products and fuels in U.S given the recycle industry a boost lately. (Kotler et al 2005, p.93)
The political approach towards foreign companies and trade is another aspect of political environment. On what level is the government accommodating to foreign firms and what are the policies towards foreign direct investment (FDI) and trade. The FDI in a country can generate competition among companies and in that way lower the prices for consumers. (Aswathappa, 2009 p.130) To protect domestic industries some countries like India for an example have regulations towards FDI.
3.1.2ECONOMICAL FACTORS
A profitable market requires purchasing power. The purchasing power in a country depends on current income, prices, inflation, savings, debt etc. The power of different consumer segments in different countries is constantly changing so as a marketer you have to pay a lot of attention to these trends (Kotler, et al 2005 p.87).
The PPP (purchasing power parity) often goes hand in hand with the employment situation in the country and this factor is also important to consider in order to know how much to pay for labor. The buying power of customers is affected by savings, debt and credit availability. (Kotler, et al 2005 p.87) To move raw material, labor, machines and goods effectively within a country you will need a well developed road- and railroad system. To run for example a factory you will need reliable electricity and to send mail, packages, use internet and make phone-calls you’ll need a modern communication system. Those factors of infrastructure are taken for granted in many western countries but they should not be ignored when looking at new markets. (Aswathappa, 2009 p.326)
11
The society in which people live is a complex and important factor to keep in mind when investigating the business environment in a country. Society shapes beliefs, values and norms that define different tastes and preferences. Unconsciously people living in a certain way that defines and affects their relationship to themselves, citizens, society, companies and the nature (Kotler, et al 2005 p.88).
3.1.4TECHNOLOGICAL FACTORS
New technology can reduce costs, improve products quality and lead to improvements and innovations in the way we do business. The development of new products usually benefit the consumers as well as the companies providing the products, online shopping, bar coding and online tickets are examples of such innovations. On the other hand lack of technology or obsolescence technology can make it difficult and expensive to produce goods (oup.com, pest-analysis, 2007).
The amount of money spend on Research and Development, R&D, from a country can give a glimpse of their strategy towards science and on which area they want to focus their R&D (Kotler, et al 2005 p.93). Sweden for example is the country in Western Europe that uses the highest percent of GDP to R&D, 3.7 percent. Of these 3.7 percent 45.7 percent is used to finance research via universities (norden.org, science and technology).
3.2
T
HEA
UTOMOBILEI
NDUSTRYThe cargo tray industry is a part of the automobile industry and is therefore affected by the number of manufactured cars. One example of this is the global financial crisis that affected the automobile industry very hard in 2008 and 2009. Supplier companies who focused on the automobile industry was hit very hard of the downturn and those who was dependent on one or few big customers was hit even harder (sverigesradio.se, svårare kris, 2009). It can be a smart move to look in new markets, but it also comes with a big risk. Companies branching out into new markets might bet on the wrong things or the timing might be off. If the suppliers do not make a careful research, the starting the costs entering a new market will not pay off (online.wsj.com, German parts suppliers, 2009).
In the automobile industry research we have chosen to include market size and growth rate, major players, future trends and distribution. How big is the automobile industry in India, what is the expected growth rate. This is the major factor that gives a broad overview of how big the market is. Who are the major players, which car models are most sold. This factor helps to understand which companies to focus on trying to establish business relationship. What about the future trends, new models, midsize cars or small size cars. Future trends are important to know in case of how to plan your market strategy. How is the distribution in India working? This gives an overview how the distribution channels are working. All these factors must be taken care of. Despite there is a fast growing industry, profitability cannot be guarantee if customers are strong or substitutes are attractive. A common mistake is that fast growing industries always are attractive. A narrow focus on growth is one of the big mistakes that cause bad strategy decisions. (Porter, 2008, p.22) Therefore we have chosen to look at a broader view of the industry, as a supplement to the Porters five forces, and a PEST analysis.
3.3
P
ORTER’
SF
IVEF
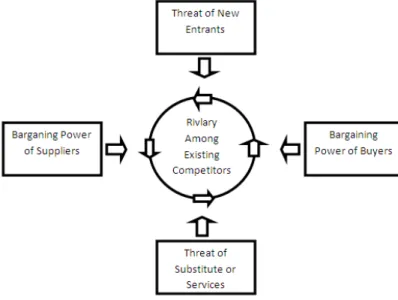
ORCESCompetition is often defined too narrow, as if it occurred only among today's direct competitors. To go beyond established industry rivals four other competitive forces are included as well: suppliers,
12
customer, potential entrants and substitute products, see figure 3. These five forces define an industry's structure and shape the nature of competitive interaction within an industry. (Porter, 2008, p.3)
Understanding of the five competitive forces, and its underlying causes, shows the foundation of an industry's prevailing profitability, while giving it a framework to predict, and influence the competition and profitability over time. It is also important to understand an industry's structure to effective the strategic positioning. It is therefore crucial for a company's strategy to defend against the competitive forces and shape them to the company's advantage. (Porter, 2008 p.4)
Figure 3: Porter’s Five Forces (Own Adaption)
3.3.1THREAT OF NEW ENTRY
Above-average returns will always attract potential entrants into an industry. With new entrants come new capacity and a desire to win market share. That puts pressure on costs, prices and the rate of investments that is needed to compete. The threat from new entrants in an industry depends on how high the barriers are and the reaction of the incumbents when newcomers enter. Defending high profitability means there have to be barriers to entry. (Porter, 2008, p.8)
Entry barriers are the advantages that the existing companies have towards new entrants. There are some major sources like supply-side economies of scale, capital requirements, incumbency advantages independent of size, unequal access to distribution channels, restrictive government policy. (Porter, 2008, p.9)
Supply-side economies of scale, these economies of scale arise when companies that produce at a large volume get lower costs because they can spread their fixed costs over more units, use more efficient technology, or create better terms from suppliers. This forces new entrants to come into the industry on a large scale or to accept a cost disadvantage. (Porter, 2008, p.9)
Capital requirements, if the entry needs large financial investments in order to compete, it can deter newcomers. For example, expensive facilities extend customers credit, research and development and
13
technology etc. It is important to realize that the capital requirements not deter all new entrants. If the industry's profitability is attractive and expected to be, and if capital markets are efficient, investors will give newcomers the resources needed. (Porter, 2008, p.11)
Incumbency advantages independent of size, established companies may have different advantages not available to potential newcomers. It can be cost or quality advantages such as patented technology, strong brand identity, experience, best geographic location or access to the best raw materials etc. (Porter, 2008, p.11)
Unequal access to distribution channels, when a new entrant plans to enter a new market, distribution channels for its product or service is important. The more limited distribution channels are and the more established companies have tied them up, the higher the barriers to enter will be. (Porter, 2008, p.11) Restrictive government policy, government policy can prevent or support new entry. That means that they can add or remove barriers to entry (Porter, 2008, p.12). The government can reduce or even foreclose entry into industries; this can be done through licensing or foreign direct investments regulations. Barriers to entry can also be higher through expensive patent rules or safety rules. This increases the scale of economies. (Porter, 2008, p.12) The government can also make the barriers to entry easier through subsidies or make funding from basic research available to both new and old companies. This will reduce the scale of economies (Porter, 2008, p.12).
3.3.2THE POWER OF SUPPLIERS
Powerful suppliers can charge higher prices, shift the costs for the buyers or limiting services or quality. Powerful suppliers can also squeeze profitability out of an industry if the company cannot pass the higher cost in its own prices. (Porter, 2008, p.13) Products that are being supplied are differentiated, if the products which are supplied have no substitute, if the suppliers do not depend on their customer for its revenues, or if the supplier has the possibility to integrate forward into the industry (Porter, 2008 p.14). Labor must also be considered as an important supplier (Porter, 2008, p.13).
3.3.3THE POWER OF BUYERS
Powerful buyers can force down prices, require better quality or more service and choose between suppliers. The buyers are powerful if they have negotiating power to the industry or if they are price sensitive, using their power to pressure down price. (Porter, 2008, p.14) A buyer has negotiating power if there are few buyers or if the buyer purchases a large proportion. If the products are undifferentiated or standardized and has few switching costs. If the buyer get the possibility to do a backward integration and produce the products themselves, their power increase. A buyer is price sensitive if the product represents an important part of the buyer's budget. The buyer will definitely compare suppliers and bargain hard. If the buyer needs to lower their costs because they are earning low profits or if they in some way are under pressure to lower their purchasing costs. (ibid, p.15)
3.3.4THE THREAT OF SUBSTITUTES
Competition comes not just from within the industry it also comes from products which perform the same function outside the industry. Video-conferencing may be a substitute for business travel.
14
Industries profitability will suffer if the threat from substitutes is high. (Porter, 2008, p.17) The threat of a substitute is high if the substitute offers a better price range than the industry's product. If the cost of switching to the substitute is low the threat from substitute will be high (ibid, p.17).
3.3.5RIVALRY AMONG EXISTING COMPETITORS
Rivalry among existing competitors is everything from new product introductions, price discounting, advertising campaigns and improved service etc. If there is high rivalry the profitability will be limited. An industries profit potential depends on the intensity among the competitors and also on the basis on which they compete. (Porter, 2008, p.18) The basis of competition has a major influence on profitability. Price competition is most likely to occur if there is lack of differentiation between products or services and there are few switching costs for buyers. Firms cut their prices below average cost to steal individual customers, this is created if the fixed costs are high and marginal costs are low. Excess capacity and pressure to raise sales often leads to price cutting. (ibid, p.19)
Other competition dimensions than price can be product features, support services, brand image, or delivery time etc. This improves customer value and can support higher prices, so it is less likely to erode profitability. (Porter, 2008, p.20)
15
4.
E
MPIRICAL
F
INDINGS
In this chapter we will present the empirical findings from both the primary and secondary research.
4.1
PEST
In following part we will present the empirical findings about India’s business environment.
4.1.1POLITICAL/LEGAL
India is a democracy based on constitutionally guaranteed civil rights and freedoms such as an independent judiciary and a diverse and active free press. Under the constitution India is secular republic even though religion plays an important role both in daily life and in the political debate. India is a federation consisting of 28 states. In addition, there are seven Union Territories. Provincial governors are appointed by the president, whom is elected for five year periods, while the Chief Minister is elected by the regional parliament. The Union Territories are governed by one governor, appointed by the president. From the many excising political parties, only Congress and Bharatiya Janata Party are considered to be national parties. The strong regional influences have made it difficult to pursue policies at a national level. The influence of the regional parties has led to that the provinces have more freedom. This makes provinces with strong economy and good management richer and stronger meanwhile the poor provinces are getting poorer. (swedenabroad.com, 2009, Om Indien)
In the Indian elections 2009 the Congress became the most popular party. The ideology of the Congress can be described as Indian nationalism/social liberalism and secularism (wikipedia.com, Indian National Congress). Together with a coalition of allies called United Progressive Alliance (UPA) the Congress party was able to gain majority and form the government. The coalition government gives priority to agriculture, water, education, health, employment, urban renewal and infrastructure. (swedenabroad.com, 2009, Om Indien)
1991 the Indian government launched a comprehensive economic reform program which is still in progress. The reforms aim at opening up the previously closed and protected Indian economy and increase opportunities for private investment and entrepreneurship. The reform policy has created stability and indicated the direction for India’s economic development. The main features of the reforms enjoy strong support across the political boundary blocks, which contributed to long-term stability and continuity. (swedenabroad.com, 2009, Om Indien)
India plays an active role in multilateral trade negotiations under the World Trade Organization (WTO). India sees itself primarily as an advocate for poor countries interests and for pushing the EU an U.S to open their markets and eliminate their subsidies to agriculture. (swedenabroad.com, 2009, Om Indien) India’s foreign trade has risen significantly from the year 2000 but globally India is still a small player with only 1.5 percent of the total world trade. For the sake of comparison it may be mentioned that China’s share of the world trade is 8.7 percent and Sweden’s 1.2 percent. India has a deficit in the balance of trade and the main reason for that is the dependence of oil from abroad which counts for almost 30 percent of the merchandise imports. Trade in services has risen sharply in recent years and today the
16
Indian service exports counts for nearly 40 percent of the country’s total exports. (swedenabroad.com, 2009, Om Indien)
Sweden’s relations with India has often been characterizes by friendship and partnership. The economic growth and the various reforms of the economy have made India an increasingly important market for Swedish companies. Because of this, the relation with India has been given higher priorities to increase sustainable contacts in a wide range of areas. Trade between Sweden and India has increased markedly over the past years. In 2008 the Swedish export to India increased with 18 percent while the Indian exports to Sweden increased by 20 percent. More and more companies discover India and its opportunities. According to a recent survey made by the embassy of Sweden 95 percent of the Swedish companies in India consider the business environment as favorable and 96 percent of them believe that they will expand their activities in India over the next three years. (swedenabroad.com, 2009, Om Indien) Companies situated in India are taxed by their worldwide income from all sources according to the provisions of Income Tax Act. A company is considered to be situated in India if it is controlled and managed entirely from India. Foreign companies are essentially taxed by the income made from business made in India or from other Indian sources. (Indianembassy.com, 2009, Fiscal taxation system) The tax system in India is of a progressive kind, the more money you earn the more tax you pay. A limited foreign company in India has a basic tax rate of 40 percent and in addition a 2.5 percent surcharge for incomes above 10 million INR, approximate US$ 222 100, as well as an education tax of three percent. The top effective tax rate in India for a foreign company is 42.23 percent compared to 33.99 for a domestic company. (worldwide-tax.com, India income taxes and tax laws)
India’s regulations towards Foreign Direct Investments (FDI) are getting more liberalized every year as part of the long term plan of deregulation of the economy. Before 1991 when the reforms started it was almost impossible for a foreigner to run his business in India. Over the years, FDI inflow in India is increasing. However India has great potential to increase the inflow even more in the coming years. (dipp.nic.in, Manual p 1) Today FDI is an important driver of growth in the country and the government is therefore making all efforts to attract facilitate foreign Investment in the country (dipp.nic.in, Manual p 7). FDI is freely allowed in almost every sector including the manufacture sector. Exceptions are retail trading (except single brand product retailing), atomic energy, plantations, lottery, gambling and betting or any sector that is not opened to the private sector investment. Exceptions are also made in sectors were industry license is required. (investmentcommision.in, FDI policy)
Government of India provides for setting up Special Economic Zones in India for the purpose of having internationally competitive hassle free environment for exports. Factories may be set up in SEZ for manufacturing goods and rendering services but domestic sales by the companies in the SEZ shall be a subject of full custom duty and import policy inflows. SEZs companies may import from domestic sources duty free and all their requirements of capital goods, raw materials, office equipment etc, for setting up of factories or further operations without any license or specific approval. The SEZs have a lot of benefits for example 100 percent income tax exemption for the first five years and 50 percent exemption for the following two. (indanembassy.org, Special economic zones)
17
100 percent FDI is allowed in setting up a SEZ and a SEZ can be set up in public, private, joint sector or by State governments. 100 percent FDI is allowed in manufacturing sector inside the SEZ even for small scale units except for sectors requiring industrial license. (indanembassy.org, Special economic zones) A major part of the Swedish companies exporting to India report that the high tariffs make it difficult to be competitive against domestic competitors. The duty for the majority of product categories is ten percent but different fees often raise the actual duty to somewhere between 30-40 percent. (swedenabroad.com, Utmaningar i Indien) Figure 4 shows the duty for Hs code 87082900 which is labored as other (in which cargo tray is included) in the category: Vehicles other than railway or tramway rolling stock and parts and accessories thereof.
Figure 4: Import Duty, (newdutytax.info, Duty tax information, 2010).
4.1.2ECONOMICAL
In 2008 India was the world’s fourth largest country in terms of GDP, US$ 2.816 billion (indexmundi.com, GDP). The largest industries of Indian in terms of contribution to GDP are agriculture sector 54 percent, industry 28 percent and service 18 percent. The main export products in India are engineering products, gems and jewelry, textiles, agricultural products and chemicals. The main import products are oil, machinery, edible oil, iron, steel, fertilizers, chemicals and gold. (chinindia.se, India)
India’s GDP per capita (PPP) is US$ 2 500 and that leave India on 166th place on the worldwide ranking, side by side with countries like Vietnam and Pakistan (indexmundi.com, GDP-per capita).
18
Over the past five years, the Indian salaries in average increased by 11.5 percent but compared to Swedish standards they are still very low. For example, a software engineer in Sweden earns on average US$ 53 600, compared to US$ 10 100 in India, an accountant earns on average US$ 56 100 in Sweden compared to US$ 5 600 SEK in India. (kinaochindien.se, Indien: Outsourcing)
India has 1.16 billion inhabitants and that makes India the second largest country in the world in terms of population (indexmundi.com, Population). With massive population comes a huge labor force of over 500 million people, only China has more (indexmundi.com, Labor force). India’s middle class has rapidly increased and is expected to be around 250 million people, and it´s estimated that about one percent of the poor manage to cross the poverty line each year. Despite the success of the middleclass in India It is estimated that two-thirds of the Indians living on less than two dollars per day. Almost a quarter of the world’s poorest people live in India. (Sida.se, Utveckling i Indien)
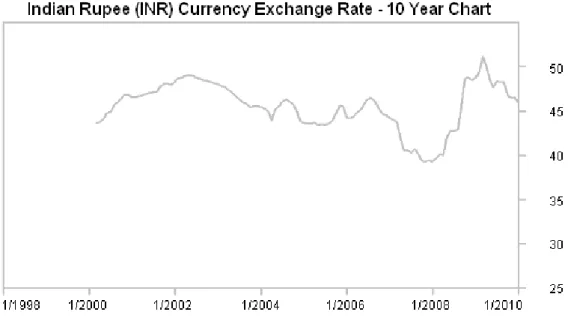
On March 30th, 2010 India’s inflation, was 9.90 percent (theglobeandmail.com, India struggles under rampant food inflation), and in May 2010 the exchange rate was Rs. 44.56 to US$ 1 (rbi.org, current rates).
Figure 6: Currency Exchange Rate, (forecast-chart.com, Currency).
The high inflation has led to that the central bank has raised the policy rate in India which has made it more expensive for individuals to borrow money (privataaffarer.se, Indisk ränta sänkte börs). The public debt in India is low in comparison to the whole world but at the same time India have the fourth biggest debt in Asia, 58.8 percent of GDP compared to Sweden’s 41.9. The future of Indian economics looks much brighter today then one year ago. The economy is expected to grow at 8.5 percent this year starting in April. This means that India have made a rapid recovery from the financial crisis that have surprised many experts. The key reason for India not getting hit so hard by the crisis is that exports only account for 20 percent of India’s GDP, a small percentage compared to many other Asian countries. The domestic demand has remained strong and to simulate the economy, the government has focused on
19
job programs in rural areas and major infrastructure projects. (e24.se, Indiens medvind slår hårt mot hushållen)
Most of the infrastructure services in India was until year 2000 provided by public monopolies and quasi monopolies. Those monopolies were facing huge problems regarding low productivity, lack of accountability, poor financial performances and over-employment. (Ashwatappa, 2009, p.326) To meet the challenges with rapid economic growth and peoples immigrations to the urban areas it is urgent to achieve greater efficiency and accountability and to do that the government allowed 100 percent FDI equity in infrastructure projects, ports, roads and highways. (ibid, p.72)
It is estimated that around three quarters of the increase in infrastructure investments outside the more current projects needs to be financed by private money (epochtimes.com, Bristande infrastruktur hämmar Indien). However, how to develop and to modernize India’s infrastructure system is one of the most important factors for India to consider in the future. The Indian government plans to spend US$ 1000 billion in the Indian infrastructure between 2012 and 2017. This is 33 times more than what the Swedish government planned for the same period. (swedenabroad.com, Infrastuktur Indien) This implies that India is taking heavy measures to build up a sustainable infrastructure but it also implies that the infrastructure today is very poor and limits the possibilities of growth.
The lack of good roads, electricity and water in many Indian regions prevents companies from building new offices, form investors to build shopping malls and hotels, as well as citizens from buying new houses. It is estimated that around three quarters of the increase in infrastructure investments outside the more current projects needs to be financed by private money. If the infrastructure issues could be resolved the growth would accelerate, if It is not solved the growth eventually reaches a point where it will decelerate. (epochtimes.com, Bristande infrastruktur hämmar Indien)
4.1.3SOCIOCULTURAL
When talking about culture in India It is important to remember that India is among the most diverse societies in the world (Mahajan, p.111). 72 percent of India’s population lives in rural areas and 28 percent lives in urban areas (family.jrank.org, Cast system).
India has people from most of the major religions in the world, Hindus, Muslims, Buddhists, Sikhs, Christians, Jains and Zoroastrians. 82 percent of India’s population is Hindus but there are also almost 150 million Muslims in the country which contributes to the second largest population of Muslims in the world. With religious diversity comes linguistic diversity. 1991 were 114 languages spoken by 10.000 people or more. Of the 114 languages were 22 spoken by more than one million. Today Hindi and English together with 18 other languages are the official languages. The government only uses English in all cases of administration even though only ten percent of the population speaks English. (Mahajan, p.114) With a huge population it is important with peace and understanding between the religions (cia.gov, India). To facilitate this India have no official or established state religion. India’s constitution protects religious liberty and gives all religious communities the right to profess, propagate and practice their religion. (Mahajan, p.112) Knowing this it becomes clear that Indians identify themselves with a certain religions but also with specific geographical or state in India. Religion specifies and guides their day
to-20
day behavior while the region they live in generally indentifies their language, literature, art, music, food and clothes. (family.jrank.org, Cast system)
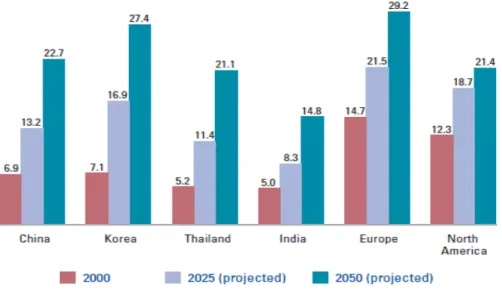
India is not just a religious diverse country it is also a young nation, 30.5 percent is between 0-14 years (indexmundi.com, India age structure). Only five percent of the population is over the age of 65 (kpmg.fi, Consumer markets in India p.10).
Figure 7: Population age, (kpmg.fi, Consumer markets in India p.10).
But at the same time it is important to know that the average life expectancy in India at birth is only around 70 years and that put India on 143th place worldwide (indexmundi.com, Life expectancy).
India had 48.7 million graduates in 2004 which is more than 100 percent increase from 1991 when the number was 20.5 million (rediff.com, graduates in India). India graduates, for example, more engineers than any other country in the world, each year about 1 million (avanza.se, Indien). Although many are educated in India only 61 percent of India’s population can read and write and that places India on 168th place worldwide regarding literacy in nations (indexmundi.com, literacy).
Of India’s labor force 52 percent is working in the agricultural sector, 14 percent in the industry sector and 34 percent in the service sector. It is notable that the agriculture sector only contributes to 17.5 percent of India’s GDP. (cia.gov, agriculture)
The Indian, Hindu family system is like most other less industrialized, traditional eastern countries based on collectivism which implies family integrity, loyalty and unity. Historically the preferred family systems are the joint family. A joint family often consists of four generations and includes uncles, aunts, nieces, nephews and grandparents. This results in that family affecting most aspects of life including career choice, mate selection and marriage. Indian families adhere to the patriarchal ideology and endorse
21
traditional gender roll preferences. Male children are raised to be assertive, less tolerant, independent, self-reliant, demanding and domineering females on the other hand are raised to be self-sacrificing, docile, accommodating, nurturing, altruistic, adaptive, tolerant, religious and to value family above all. (family.jrank.org, family life)
When looking at the crime rates in India It is important to remember that India have the second largest population in the world. India have about 1.63 crimes per thousand people and place itself on 59th place worldwide compared with Finland who is third with 101.5 per thousand people. (nationmaster.com, Crime statistics)
However, India is the country in the world where most murders takes place every year. 2007-2008 almost 33 000 incidents of murder were reported in India compared to about 9 500 in USA. (timesofindia.indiatimes.com, India tops) The risk analysis firm, Mapelcroft recently published a list of countries where it is most likely that a terrorist attack will take place. Nine countries are classified as extreme risk nations and India is placed sixth on the list next before nations as Algeria and Colombia, the list is topped by Iraq. (aftonbladet.se, Thailand ett av de farligaste)
Corruption is a big issue in India and there are major flaws in the rule of law regarding this problem. On Transparency Internationals list over corrupted countries is India on 85th place of 180 countries. Poor people and minority groups with less political and social status have because of these limited opportunities to run legal cases in court. (regeringen.se, Indien, p.9) As a result from this many Indians believe that politicians are corrupt, ineffective or have criminal links (Tripathi, 2009).
Several measures have been made by the Indian equivalent to FBI called Central Bureau of Investigation to stop the corruption in India. Lately dozens of bank managers, bureaucrats, engineers and contractors have been arrested on the suspicion of crimes including accepting bribes and forging documents. The agency have included the citizens of India in their anti corruption crusade. By making a countrywide campaign where people can use their cell phones to send messages to the agency about suspicions of corruption, the agency hopes to get led’s that will help them in their case against corruption. (nytimes.com, In India)
4.1.4TECHNOLOGICAL
When India entered the modern world, after the British rule, it was in a state of economic backwardness and poverty of a large section of its people. It was then obvious that technology must be focused on basic need such as clothes, food, health and housing. But at the same the latest technology in the industrial sector was necessary to catch up with the developed countries. (Ashwathappa, 2009 p.123) More than 400 million people do not have electricity in India. India’s power shortage is a barrier to the country’s development. For example, 2008, 60 percent of the Industrial consumers had to make their own arrangements for securing a reliable power supply. In 2009 some 80 percent of the electricity supplied to Indian homes and factories came from coal-fired generation plant and one-third of those were old, inefficient and spread harmful gases into the atmosphere. In 2009 The World Bank approved a US$ 180 million loan to the government of India, designed to renovate and modernize the coal plants. The project is also supported by the Global Environment Facility whom granted US$ 45.4 million dollar
22
and the aim of the project is to lower carbon emissions and boost power production. This is the first step in a decade-long plan that the Government of India have made to increase the power supply by modernize a range of old coal-fired plants and move the country to more climate-friendly options for energy generation. (thegef.org, 2009)
India has one of the world’s fastest growing telecom industries. The mobile sector has grown more than tenfold since 2001 but the usage of internet is still limited, only 7 percent of India’s population has access to internet compared to Sweden 89.2 percent. (internetworldstats.com, Internet users) This affects the way companies can reach their customer through marketing, they way people pay their bills and also the way people and companies buy and sell goods and services.
India is well aware of their need of R&D and several measures have been made since the liberalization started. Government of India have established space research centers, medical research centers, agricultural research centers, power development projects, industrial research etc. Besides that several universities have been set up provide higher education in science, technology and management. The Government have also established a series of research establishments and granted recognition to in-house R&D centers run by private industries and for this purpose many monetary and fiscal sops has been offered. (Aswatappa, 2009, p.123)
The development of the Indian industrial sector has not been a smooth one and today its industry-efficiency is far behind their neighbor China. Before 1991 the Indian industries were protected through various restrictive laws and regulations from the competition of modern technology-based industries. But they were also inhibited by the government to compete globally. With rigid laws Indian firms were stopped from attaining efficient size. Both these factors inhibited the Indian market from developing. (Bhandari, et al 2007, p. 71)
When India opened up the market in the early 90s the problems of the underdeveloped industries came to light. Fortunately, policy makers have realized the shortcomings of earlier strategies and the urgency for Indian industries to become efficient so they can withstand the pressure of foreign competition. Improved performance of the industrial firms is now being called for and efficiency of a factory is now supposed to be a prerequisite for growth or even mere survival. Over the years several measures have been taken by the government to help domestic industries achieve efficiency. These include for example financial measures and liberalization of tax laws and rates. (Bhandari, et al 2007, p.74)
4.2
T
HEA
UTOMOBILEI
NDUSTRYIn this part we will present the empirical findings about the Indian automobile industry.
4.2.1MARKET SIZE &GROWTH RATE
The automobile sector is a significant player in the Indian economy and contributes 5 percent of the nation's GDP. The Indian market has over the past few years attracted global automakers. This is mostly because of the growing middle class and the growth of the economy in India. Except from this, India also provides trained manpower at competitive costs and this makes India to an attractive global manufacturing hub. (Cygnus, Indian automobile industry, 2009, p.4)
23
The Indian automobile market is working hard reaching international standards to meet the needs of the global automobile giants and become a global car hub. The automobile sector is today one of the key sectors when it comes to employment. It employs more than 10 million people excluded the auto component and auto ancillary industry. (Cygnus, Indian automobile industry, 2009, p.4)
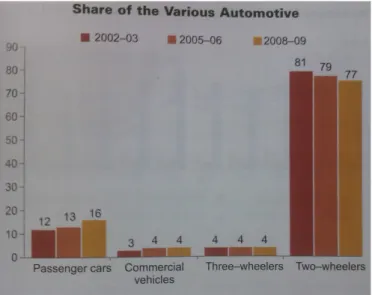
The Indian automotive industry is dominated by wheelers, but as shown in figure 8 the two-wheelers are slowly losing market share while the passenger car segment is growing.
Figure 8: Share of Automotive, (Datta, 2010, p.135).
India is now the 11th largest market in the passenger cars segment, and is expected to be the 7th largest market in the world by 2016 (Datta, 2010, p.131). Despite the global downturn and the fact that automobile industry was deep in recession worldwide in 2008–2009 the Indian automobile industry was slowed down but continued to show a positive growth of 3.4 percent of the production in 2008-09. The demand for India’s small cars drives the growth in the export market. (Tinwala, 2010 p.26) The growth in the domestic market is largely driven by the country's large middle class with growing disposable incomes (economictimes.indiatimes.com, Indian auto industry, 2009). According to Ernst and Young the passenger car industry is predicted to grow at twelve percent annually over the next five years, from 1.89 million in 2008-09 to around 3.75 million units in 2014. (ibid, p.27)
The current FDI (Foreign Direct Investments) regulations make it profitable for multinationals to set up manufacturing industries in India. Apart from FDI regulations, low production costs contribute to the positive growth and attract huge investments. All this is bodes well for the Indian automobile industry. (Tinwala, 2010 p.26)
During 2009, the major automobile markets across the world witnessed a fall leading to an overall decline of 14 per cent (economictimes.indiatimes.com, Indian car exports, 2010). India’s automotive (passenger vehicles, commercial vehicles, three wheelers, two wheelers) industry reported a rise of 26.41 percent in fiscal year 2009-10, the industry recorded sales of 12.3 million units, highest ever. With a helping hand from government’s stimulus package, lower interest rates on auto loans and the