School of Education, Culture and Communication
Read-a-paper-bility: can you read this paper for me?
A readability study of The Daily Telegraph and the Daily Mail
Degree project in English Studies ENA309 Erik Jonsson
Supervisor: Thorsten Schröter Spring 2018
Abstract
In our information age, it is of the highest importance that information is easy to understand by as many members of the potential target audience as possible.
The present study analyses and compares the readability of 20 newspaper articles, half from the tabloid Daily Mail and the other half from the broadsheet The Daily Telegraph. The methods used to analyse the articles are mathematic readability formulas based on sentence and word length, as well as analyses of the use of the active and the passive voice, type-token ratio, number of clauses per sentence, and linking words.
The results do not completely align with each other. Three of the five methods – the
readability formulas, the use of the passive voice, and clauses per sentence – suggest that the Daily Mail articles are easier to understand, whereas the type-token ratios imply the opposite, and the linking words results did not show a difference in readability.
Keywords: readability, newspaper readability, readability formulas, the active voice, the passive voice, linking words, clauses per sentence, type-token ratio
Table of contents
1. Introduction……….1
2. Background……….2
2.1 Why is readability important?...2
2.2 Ways to measure readability………2
2.2.1 Readability formulas………...……….2
2.2.1.1 Flesch-Kincaid and SMOG………...………...4
2.2.1.2 The Gunning Fog Index………...………5
2.2.2 Active and passive voice………...………...5
2.2.3 Type-token ratio………...6
2.2.4 Clauses per sentence………...…….7
2.2.5 Linking words………..7
2.3 Previous readability research………...8
3. Methods and material………..9
3.1 Material………..10
3.2 Calculating formula scores and type-token ratio………...10
3.3 Identifying voice and counting clauses per sentence……….11
3.4 Finding linking words in each article……….12
4. Results………...12
4.1 Readability formula scores……….12
4.1.1 FKGL……….12
4.1.2 SMOG………13
4.1.3 GFI……….14
4.2 Frequency of the passive voice………..15
4.3 Type-token ratio……….15
4.4 Clauses per sentence………..16
4.5 Frequency of linking words………...17
5. Discussion……….18
5.1 Readability formula scores.………18
5.2 The passive voice frequency………..19
5.3 Type-token ratio……….20
5.4 Clauses per sentence………..21
5.6 Comparison of results………...……….22
5.7 Material discussion…..………..22
6. Conclusion………23
List of references………...24
1. Introduction
Access to information is one of the pillars of a democratic society, and for information to be accessible it has to be readable for whoever reads it. Readability is about how easy it is to understand a written piece of text. High readability in any text is important: “To maximise readability is a goal that every writer, technical or otherwise, should strive to achieve. To argue otherwise is tantamount to arguing that we do not write to communicate, a bizarre view to say the least” (Marnell, 2008, p. 1). Assuming this is true, it is also important for
newspapers, both print and online ones, to maximise readability in order to best communicate news to their readers.
There are two main types of readability: one which is about the format of the text, such as line length, margins, and the like, and one which is about how easy it is to understand the actual formulations. The present study focuses on the latter, as it investigates the linguistic qualities of text. More specifically, this study compares the readability of some articles in one of the biggest tabloids in the United Kingdom – the Daily Mail – to that of articles in one of the country’s biggest broadsheets – The Daily Telegraph. Tabloids and broadsheets are the two traditional categories British newspapers have been divided into. The Oxford English Dictionary (n.d.) notes that tabloids are “typically popular in style and dominated by
sensational stories”, whereas broadsheets are “regarded as more serious and less sensationalist than tabloids”. As newspapers are increasingly consumed online, all examined articles are from the respective paper’s website.
The presumably biggest study that has dealt with readability was based on 2.5 million news articles in 498 online English-language news outlets, which were analysed with the help of artificial intelligence. Perhaps unsurprisingly, it was found that tabloids are, in general, more readable than broadsheets (Cornish, 2012). Although that study is quite recent, there is still a point in comparing its results with even more recent data to see whether the results still hold true. Moreover, that study used only one method for comparing readability, the Flesch Reading Ease Test (see the background section), whereas the present study uses several methods and analyses more aspects related to readability.
A selection of 10 articles from each newspaper was analysed in order to measure their readability. The present study’s research question is as follows:
- Does there appear a difference in readability between The Daily Telegraph and the Daily Mail?
2. Background
In this section, readability is discussed more thoroughly. First, a section on why readability is important is presented, followed by a description of the methods this study relies on, and finally a presentation of some previous reability research.
2.1 Why is readability important?
Readability is important in order to convey what one is writing in an understandable manner. It is crucial that readers understand the information as intended, as Marnell argues (2008, p. 2): “We want the sick to understand the documentation that accompanies their medicines and the machinist to understand how to operate their machine and not injure themselves and others around them.” Partly for such reasons, readability formulas (see section 2.2.1) are used in some areas, including “science, medicine, law, education, the military, and business” (DuBay, 2007, p. 7). There are also legal reasons for trying to achieve high readability: in 1999, an American hospital and a university were successfully sued for $3.8 million dollars as their consent forms were too difficult to understand (DuBay, 2007, p. 2).
Rollins & Lewis (2013, p. 149) point out that liberal immigration laws can make a population more diverse, with increased variation in reading abilities as a consequence, making
readability an even greater concern than otherwise. Moreover, they state that technological advances make the web more accessible for people with disabilities, and online writers should take this into account. On newspaper readability, they acknowledge that as U.S. newspapers are more globally read now thanks to the internet, there is a wider audience that needs to be accounted for (Rollins & Lewis, 2013, p. 149); this would presumably also apply to British newspapers.
2.2 Ways to measure readability
There are a multitude of factors that affect a text’s readability. This section will look into and explain the factors that this study employs when examining the newspaper articles: readability formulas, active and passive voice, type-token ratio, clauses per sentence, and linking words.
2.2.1 Readability formulas
One common way to measure readability is through mathematical formulas. These formulas normally take into account the average sentence length in a written piece of text as well as the number of long words (Lenzner, 2014, p. 43). The first formulas were developed in the 1920s,
and by the 1980s there were over 200 of them. They have been used in over a thousand studies, and courts accept them as evidence (DuBay, 2007, p. 6).
Despite their widespread use, it is important to acknowledge that the results provided by readability formulas are merely estimates. Kouamé (2010, p. 133) notes as much when he stresses that readability formulas indicate how easy any given document is to read. Therefore, readability formulas gathered criticism over the years, with Marnell (2008, p. 8) stating that readability formulas are “fundamentally flawed” and that “writers should therefore resist the gathering pressure to judge the readability of their writing on the basis of such formulas”. Marnell’s (2008) reasoning is that sentence length, for example, is not a good measure of readability of the following sentences: “The cat shook. It sat. It licked. It hissed. Then it slept” (p. 4). These are in fact harder to read than if they had been merged into just two sentences instead. Furthermore, Marnell (p. 4) provides an example of two nine-word sentences where the one with fewer syllables (“Electrons jump a level when hit by a photon”) is harder to read than the other (“Mummy always washes the dishes after breakfast every morning”). He also discusses other factors that make a text hard to understand but go unnoticed by readability formulas, such as poor grammar, vagueness and non-sequiturs, as well as logical
inconsistency. Jabbari (2011, p. 37) makes similar points: “readability formulas are considered to be predictions of reading ease but not the only method for determining
readability and they do not help us evaluate how well the reader will understand the ideas in the text”.
However, a lot of Marnell’s criticism, though he makes some valid points, does probably not apply to more formal pieces of text where one can assume a certain standard has been met in terms of language use and coherence. In any case, readability formulas are widely used (DuBay, 2007, p. 7) and if treated as indicators or predictors regarding a text’s readability, rather than providers of absolute truth, they are not without value. Moreover, as Kouamé (2010, p. 135) notes, there is a lack of alternatives: “Before other reasonable alternatives are invented, readability testing for text reading level prediction remains essential.” Kouamé further suggests using more than one formula on a given text, as that offers more thorough insights into the text. Backman (2015) notes that using three formulas – instead of two, which she did in her study – might be advisable, for if the results provided by one should differ from those of the other two, the majority principle can be applied. DuBay, however, is striking in his positivity towards the formulas when he argues that they are “highly predictive of the difficulty of a text” (2007, p. 6). The present study uses three readability formulas as well as
four additional methods to examine the readability of the newspaper articles investigated. In 2.2.1.1 and 2.2.1.2, the three formulas used for the present study are presented and explained.
2.2.1.1 Flesch-Kincaid and SMOG
The Flesch-Kincaid Grade Level (FKGL) index was developed in 1976 by the US Navy and is based on the Flesch Reading Ease (FRE) formula, developed by Rudolph Flesch in 1948 (Readability Formulas, n.d.). The FRE formula yields a readability score from 0 to 100, whereas with FKGL a score is given on the basis of how many years of education the reader will need to have gone through to understand the text in question (Wasike, 2016). The present study will use the FKGL index. The exact mathematical formula is as follows:
FKRA = (0.39 x ASL) + (11.8 x ASW) - 15.59
FKRA = Flesch-Kincaid Reading Age
ASL = Average Sentence Length (i.e., the number of words divided by the number of sentences)
ASW = Average number of Syllable[s] per Word (i.e., the number of syllables divided by the number of words)
(Readability Formulas, n.d.) The scores are, thus, fairly straightforward to interpret. A score of 6.0 means that the reader will have needed to have gone through six years of education on average, while a score of 9.3 means approximately nine years are needed and so on. There are precedents for using the FKGL formula in newspaper readability research, with both Rollins & Lewis (2013) and Wasike (2016) using the method (see section 2.3 for a description of their research). However, the FKGL formula has been claimed to potentially underestimate the textual difficutly
(Stossel, Segar, Gilatto, Fallar, & Karani, 2012, p. 1169; Wasike, 2016, p. 14).
Regardless of whether it is true that the FKGL index underestimates the grade reading level or not, but especially if it is, it is advisable to use more than one formula, as stated in section 2.2.1. The Simple Measure of Gobbledygook (SMOG) index, for example, works similarly to FKGL; the scores give an approximation of how many years of education are needed to read any written piece of text (Readability Formulas, n.d.). The SMOG mathematical formula is:
1.043 * SQRT (30 X Polysyllables/Sentences) + 3.12911
(Stossel et al. 2012) Polysyllables refers to polysyllabic words, which are words with three or more syllables. SMOG is a popular method when analysing texts that provide health information, though it was originally created by a former journalist with a PhD in psycholinguistics, G Harry McLaughlin (Readability Formulas, n.d.). According to one relatively recent source, SMOG is recommended by three health organisations: Health Literacy Advisor, National Cancer Institute, and Center for Medicare and Medicaid Services (Stossel et al., 2012). As regards the claim that FKGL might underestimate the difficulty of a text, Stossel et al. proposed that might explain why SMOG predicted a higher grade level than FKGL did (2012, p. 1169).
2.2.1.2 The Gunning Fog Index
The third readability formula this study uses is the Gunning Fog Index, which is attributed to Robert Gunning, who thought newspapers and business documents were unnecessarily complicated (full of “fog”) (Readability Formulas, n.d.). Unlike FKGL and SMOG, Gunning Fog does not predict the years of education needed to read a text. It yields a score on a scale where 7 or 8 is deemed ideal and anything above 12 too difficult for most people to read (Readability Formulas, n.d.). The mathematical formula is as follows.
Grade Level = 0.4 (ASL + PHW)
(Readability Formulas, n.d.) As previously stated, ASL is Average Sentence Length. PHW is Percentage of Hard Words, where a hard wordis a polysyllabic word, i.e. a word with three or more syllables,
(Readability Formulas, n.d.). Gunning Fog is a commonly used formula in readability studies, for example in Stossel et al.’s (2012) research (see section 2.3), as well as both Jabbari’s (2011) and Backman’s (2015) translation studies.
2.2.2 Active and passive voice
The active voice is more common and natural than the passive voice in the English language (Ballard 2013, p. 128). Active voice is when the subject of the clause is performing the action described by the verb. In the passive voice, however, the subject of the clause is being acted
1 SQRT means square root. To clarify, one is to multiply the square root of 30 X Polysyllables/Sentence by 1.043; 3.1291 is added after that.
upon (p. 128). Consider this sentence: The player passed the ball. Here, the player is the subject of the sentence and performing the action (passing the ball). In the passive voice, it would be as follows: The ball was passed by the player. Here, the ball is the subject and is being acted upon (by the player). The passive voice is generally seen as more formal than the active voice, and sometimes as unnecessarily formal: “the passive voice is often seen as merely a stylistic choice which results in writing which lacks clarity” (Millar, Budgell, & Fuller, 2013, p. 394). Similarly, Zipoli (2017, p. 219) states that the passive voice is a sentence structure that could be hard to understand for the reader. He states that the sentence “the bear was tricked by a fox”, taken from a Hungarian folktale, would be easier to
understand for middle school students if it was in the active voice (“the fox tricked the bear”). In some cases, however, the passive voice might be more suitable to enhance readability. Millar, Budgell. & Fuller (2013, p. 395) suggest that the first sentence below, which is written in the passive voice, might be more readable than the paraphrase in (2) (original bold face for the verb phrases):
(1) The warm-up programme was developed by medical staff from the Oslo Sports Trauma Research Center and coaching staff from the Norwegian Handball Federation, ...
(2) Medical staff from the Oslo Sports Trauma Research Center and coaching staff from the Norwegian Handball Federation developed the warm-up programme, …
The first sentence is arguably easier to read as the verb phrase comes earlier in the clause; in the second sentence the length of the subject (everything until developed) may confuse the reader. Another case where using the passive voice need not harm readability is the so-called short passive, which is when the agent – the person performing the action – is omitted from the sentence (Millar, Budgell, & Fuller, 2013, p. 395). The short passive is perhaps most commonly used in scientific writing when the writer wants to omit him- or herself from the writing. Backman (2015, pp. 9-10) addresses this and gives the construction “The data was analysed by using…” as an example.
2.2.3 Type-token ratio
Miliander (2003, p. 27) describes the type-token ratio as follows:
It measures how many different words there are in a spoken or written text in relationship to the total number of words. The ratio of words in a text is calculated by dividing the number of types (different words) by the number of tokens (occurrences). The result is then multiplied by 100 to get the ratio expressed in percent.
A high ratio would thus suggest that the text is stylistically varied and that there is little repetition (Miliander, 2003, p. 27). I think it seems reasonable to assume that a text with a high type-token ratio is more advanced. To illustrate what a type-token ratio can look like, this paragraph up until this sentence has a ratio of 58% (64 unique words of a total 111)2, which is fairly low compared to Miliander’s results of written material, where the averages were at 76% and 79% per 100 words.
One should not blindly trust the type-token ratio as a measure of a text’s difficulty, however, as the ratio depends on text type and sample size (Miliander, 2003, p. 27). She notes that a longer text is likely to have a lower ratio than a shorter one, as it is probable that words are repeated more (p. 27). With regard to text types, the ratio is higher in news than in fiction and academic writing, according to corpus findings (Miliander, 2003, p. 28).
2.2.4 Clauses per sentence
Sentences with three or more clauses can be a source of confusion for the reader (Zipoli, 2017, p. 220). According to Owens (as cited in Zipoli, 2017, p. 221), people who are learning English and students who have problems with attention, working memory and processing speed might find it more difficult to understand sentences with multiple clauses. A clause normally contains a subject and a verb, but can additionally include objects, complements, and/or adverbials (Ballard, 2013, p. 118). In the example sentence used in section 2.2.2 – The player passed the ball – the player is the subject of the clause, with passed being its verb and the ball its object. If this sentence were extended by another clause it could read: The player passed the ball, but his opponent cleverly intercepted it. In this sentence, the word but introduces a new clause in which his opponent is the subject and intercepted the verb. Cleverly acts as an adverbial and it as an object. As previously stated, however, a clause can consist of just a subject and a verb, as in I am running. Here I is the subject and am running is the verb element. Clauses are, however, not always as straight forward to analyse and
sometimes it might arguably be more difficult to identify them. A general rule when one identifies, and perhaps counts, clauses would be that one verb phrase equals one clause.
2.2.5 Linking words
A linking word is here defined as a word that connects two or more clauses or sentences. Such items go by different names. For example, Fry (as cited in Hoke, 1999, p. 1) refers to them as
signal words when he describes them as one important factor in increasing readability. DuBay (2007, pp. 77-78) also lists signalling as a component in making the text more organised, which in turn supposedly increases readability. As Backman (2015) mentions, it is probably more accurate to refer to them as linking items as “some of them consist of more than one word, for example in addition, on the other hand, for instance etc” (p. 8). The type of linking words the present study focuses on are so-called transition words, which Mohamed-Sayidina (2011, pp. 255-256) divides into four categories:
(i) Additive: In this type of relation, [propositions] are added to preceding ones. Typical
additive transitions include and, also, furthermore, moreover, besides, in addition, for example. (ii) Adversative: Here a clause or sentence expresses a proposition contrary to expectation,
when viewed within the context of a preceding proposition. Common adversative transitions include but, yet, however, nevertheless, although, despite.
(iii) Temporal: In this type of relation, a proposition is presented as following or preceding
another. Temporal relation also includes the ordering of argument in discourse. Typical temporal relations include then, next, previously, before, after; first, second; the first point, the
second point, the final point.
(iv) Causative: In a causative relation, a proposition is viewed as a cause or result of
another. Common causative transitions include so, therefore, hence, because, as a result,
consequently, for this reason.
It is important to note that there are more linking types than these, but these are the four categories that are used for this study.
2.3 Previous readability research
Readability has been subjected to study since at least the late 19th century when Sherman (1893) concluded, among other things, that the average sentence in English prose was shorter in his lifetime compared to Elizabethan times. Sherman does not mention the term readability, but states: “Ordinary modern prose […] is clear, and almost as effective to the understanding as oral speech” (p. 256), which suggests that his studies would today be falling within
readability research.
A lot of the research on readability has been conducted in the field of medicine, as it is a jargon-heavy field. Stossel et al. (2012) measured readability in patient education materials (PEMs) from different sources against the background that the average American citizen reads at the level of an 8th grader and the suggestion that PEMs should be “written at or below
material would require a higher educational level than that. They measured readability using three readability formulas: FKGL, Gunning Fog, and SMOG. The results varied both
depending on the source and on the formula used. For one type of material, the FKGL measurement suggested that 31% of the material required an education above 8th grade, whereas the Gunning Fog data suggested 74% and SMOG 96%. For material from the other two sources, scores ranged from 63% to 100%, each time with the FKGL formula yielding the lowest percentage and SMOG the highest.
Readability has also been a subject studied in translation studies. Backman (2015) made it part of her study when she manually translated a number of Red Cross texts and compared the readability of the original texts to her translated ones. To examine the texts’ readability, she used the FRE and the GFI formulas, and looked into the use of linking words and frequency of the passive voice. The two formula scores were in sync, yielding results suggesting that the translated texts were easier to understand, which was Backman’s aim. The use of the linking words decreased from 9% to 5% in the translated texts, however, and the passive voice frequency stayed the same at 4% of all verb phrases.
Research on newspaper readability includes two American studies, both using the FKGL method. Wasike (2016) examined readability in county level news articles in Texas,
compared it to public literacy, and found that on average 11.63 years of schooling would be required to understand an average news article according to the FKGL, and a score of 47.78 on the FRE index, which corresponds to “very difficult” (Readability Formulas n.d.). With 77 percent of the population completing no more than high school, this means that “the news articles were written at a level marginally comprehensible to a majority of potential readers” (p. 1). Rollins and Lewis (2013) analysed newspaper columns written by National Journalism Award winners, and they specifically compared recipients of the award who wrote
commentary columns to recipients who wrote business/economics columns. The Flesch-Kincaid grade levels ranged from 3.9 to 13.8 for the commentary columns and from 5.6 to 14.4 for the business/economics ones. On average, the scores for the business/economics columns were 2.5 grade levels higher. Rollins & Lewis (2013, p. 152) suggested that this might be due to the writers of these columns expecting the readers of business/economics columns to be more educated or to have come from a relevant professional background and to thus able to understand columns featuring more complicated language.
In this section, the material is presented, and then the methods used to analyse the material are explained.
3.1 Material
As previously stated, this study compares articles from the Daily Mail and The Daily
Telegraph. The two newspapers have a similar reader demography, both in terms of age and gender (Taylor, 2017). This is one of the main reasons why these two papers have been chosen for this study, in an attempt to keep as many factors equal besides the
tabloid/broadsheet distinction. This also includes the fact that all articles are not only about Brexit, i.e. the process of Britain leaving the EU following the referendum in 2017, but about the same events regarding Brexit. In other words, considerable time has been invested into finding pairs of articles. They may vary in depth and length, but each article has a
corresponding article in the other newspaper. Furthermore, the shortest article is 277 words long, so all articles are analysed in terms of the first 270 words or up to the nearest end of a sentence. Links to the articles can be found in the Appendix, where first all ten The Daily Telegraph are listed and numbered in chronological order from 1 to 10; then all Daily Mail articles are listed where each number corresponds to that of the articles from The Daily Telegraph. In other words, the two Article #1 in both lists represent a pair in terms of subject matter, as do the two Article #2, and so on.
It is important to note that as the articles are from the newspapers’ websites, they may have been edited after publication, which means that the text that has been analysed in this study represents just one out of several possible versions. Another important note to make is that The Daily Telegraph has some of its content behind a paywall, which means that a monthly fee needs to be paid to access all their articles, and some of the articles chosen for this study may require a paid subscription to read. Additionally, only the body of the text in each article has been analysed, while headlines, image captions and the like have been excluded because headlines in particular do not always follow normal sentence structure; they often just feature a short phrase without all components of “normal” sentences, or clauses.
3.2 Calculating formula scores and type-token ratio
The three readability formulas mentioned in sections 2.2.1.1 and 2.2.1.2 – FKGL, GFI, and SMOG – were used in the present study to calculate readability scores. The relevant excerpt from each article was entered into the Readability Formulas website form for readability
scores: http://www.readabilityformulas.com. The website calculates the scores almost
instantly and automatically. It describes itself as "a non-commercial ‘passion project’ created by freelance writer Brian Scott” (Readability Formulas, n.d.). Backman (2015) also used this website for her readability studies when gathering formula scores.
The website also provides type-token ratios under “Show Word Statistics”, where it gives a number and percentage of "unique words", i.e. types. This percentage has been used as the type-token ratio. A couple of things need to be clarified regarding the method, however:
• The website counts hyphenated words and compound words as separate items. For example, type-token ratio counts as three words even though it arguably represents one concept.
• It does not take into account that one word can have different forms, such as the singular and plural forms of nouns or different tenses of verbs. This means that in the sentence I have one green shirt and three blue shirts the word(s) shirt and shirts are counted as two separate words (types) even though they are part of the same lexical item (shirt). With regard to verbs, the words watched and watching in the sentence I watched the man watching me are counted as separate. Conversely, the verb watch and the noun watch would be counted as one word even though they are different lexemes. • Contractions of two words, such as I’m, don’t, and there’s, would be treated as one
word by the website calculator.
There are other, perhaps more reliable (or at least more commonly used), ways of gathering type-token ratio, which will be further discussed in the discussion section.
3.3 Identifying voice and counting clauses per sentence
As stated in section 2.2.2, the use of the passive voice normally raises the difficulty of a text and thus negatively affects its readability. Therefore, each sentence and clause in the 20 articles was manually analysed in order to identify what voice it is in. Then the percentage of passive clauses was calculated by dividing the number of clauses in the passive voice by the total number of clauses. When this was done, the scores for the Daily Mailarticles and those of The Daily Telegraph were compared and compiled into a table. It is important to point out that all occurrences of the passive voice were counted, even in the case of the short passive, which does not necessarily decrease the text’s readability (see section 2.2.2).
The number of clauses was calculated by counting the number of verb phrases in the texts, or perhaps more precisely the number of lexical verbs. This means that the sequence vowed to challenge from the context of Mr Sutherland spoke of his anger at the decision and vowed to challenge it (The Daily Telegraph, Article #5) was counted as two verb phrases, as vowed and challenge are both lexical verbs. Furthermore, -ing forms acting as adjectives were considered just that and not verbs, for example disappointing and surprising in the sentence I find that a disappointing and surprising decision (The Daily Telegraph, Article #5)
Moreover, as identifying active and passive voice included a count of the number of clauses, a lot of the work in terms of counting clauses per sentence had already been done, and the number of sentences in each article was automatically calculated by the Readability Formulas website (see section 3.2). Sentences with a quote within them, even if it constitutes a sentence in its own right, were regarded as one sentence. This means that the following example has been counted as one sentence: Speaking to BBC Radio 4's Today programme, he said: "I find that a disappointing and surprising decision.”. (The Daily Telegraph, Article #5) The number of clauses was divided by the number of sentences to calculate the average number of clauses per sentence. These results were then compiled into a table.
3.4 Finding linking words in each article
The use of linking words – or linking items – has been known to increase a text’s readability (see section 2.2.5). The articles were manually analysed to identify and count the number of linking words. Then the number of linking words was divided by the total number of words to calculate the percentage of linking words in the articles. As mentioned in section 2.2.5, the type of linking words that is counted in this study is what Mohamed-Sayidina (2015) calls transition words (for further explanation, see 2.2.5).
4. Results
In this section, the results are presented according to the methods described in section 3 in the following order: the readability formula scores, the frequency of the passive voice, type-token ratio, clauses per sentence, and the frequency of linking words.
This section presents the readability indexes with text and tables, to be explained in more detail below. First the FKGL scores are presented, followed by the SMOG scores, and finally the GFI ones.
4.1.1 FKGL
The results from the FKGL test are presented in Table 1 below. The numbers 1-10 represent the articles, ranked from lowest readability score to highest readability score (according to this measure), and Mean is the average of all articles from each newspaper combined. TDT stands for The Daily Telegraph, and the numbers in that row are the FKGL scores for the articles from that newspaper; DM stands for the Daily Mail and the same applies there. In other words, even though pairs of articles were analysed they were not compared
individually. This is because this study aims to compare the readability of the two newspapers as a whole rather than the individual articles. Presenting the scores this way arguably gives a better overview of each paper’s readability scores. In other words, the numbers 1-10 do not stand for each article pair, they are merely there to show what rank the scores have within their newspaper.
Table 1. Results from the Flesch Kincaid Grade Level (FKGL) index
1 2 3 4 5 6 7 8 9 10 Mean
TDT 11.4 11.9 12.7 12.8 14.2 15.4 16.0 16.4 16.7 18.4 14.6 DM 9.6 10.9 11.5 11.7 12.8 12.8 13.2 14.2 14.6 16.0 12.7
To reiterate, the numbers predict how many years of education the readers will have needed to go through to understand the text (see section 2.2.1.1). The law regarding compulsory
education in the United Kingdom states that everyone has to go through education from ages 5 through 18, though until recently it was only compulsory between ages 5 and 16. This corresponds to 13 and 11 years of school, respectively. In other words, according to the FKGL index, to understand the average Daily Telegraph article (of those analysed) most British adults will have needed to go through more than 3 years of additional education aside from the obligatory 11. With this in mind, some of these results are striking in their high numbers, and it could be good to remember that the accuracy of readability formulas is questioned (see section 2.2.1) and that this should not be viewed as absolute facts. As regards the Daily Mail, the results suggest that an average of 12.7 years of tertiary education are needed for full comprehension. These results indicate that the articles in The
Daily Telegraph are more difficult to read on average than the Daily Mail ones, as almost two more years of education are needed for the former, according to FKGL.
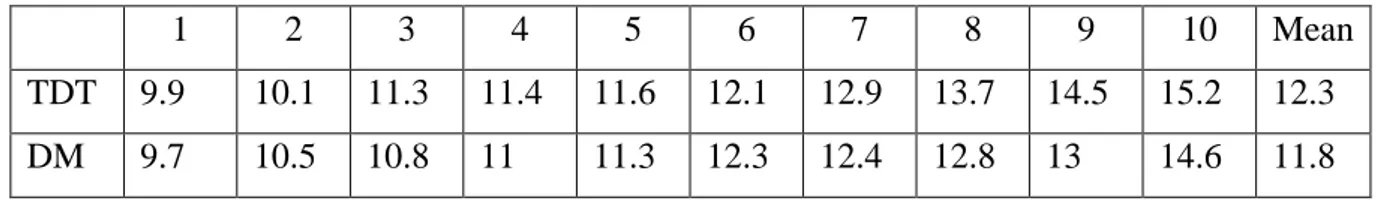
4.1.2 SMOG
Table 2, below, presents the results from the SMOG readability test, according to the same principles as adopted for Table 1. The measure is similar to FKGL in that it indicates how many years of education are needed for the average reader (see section 2.2.1.1). Here, the difference between the two newspapers is not as clear as in connection with the FKGL test. In fact, with a mere 0.5 difference between the respective mean, one could argue that the
difference is negligible and that the two papers instead are similar in readability, according to the SMOG test. In terms of education, readers will, for complete understanding, need around one additional year on top of the compulsory 11.
Table 2. Results from the Simple Measure of Gobbledygook (SMOG) test
1 2 3 4 5 6 7 8 9 10 Mean
TDT 9.9 10.1 11.3 11.4 11.6 12.1 12.9 13.7 14.5 15.2 12.3
DM 9.7 10.5 10.8 11 11.3 12.3 12.4 12.8 13 14.6 11.8
4.1.3 GFI
The results from the GFI are presented in Table 3 below, which is to be read according to the same principles as Tables 1 and 2. As stated in section 2.2.1.2, the GFI does not predict how many years of school are needed for comprehension of a text, but it rather yields a score where 7 or 8 is deemed ideal and anything above 12 is deemed too difficult for most people to read. With only one article scoring below 12, the numbers here are striking in how high they are. Apart from this, the results are similar to those based on the FKGL index, in that the mean for the Daily Telegraph articles is 1.9 points higher than that for the Daily Mail ones. Another noteworthy result here is that as many as five of The Daily Telegraph articles score higher than the Daily Mail article with the highest score.
Table 3. Results from the Gunning Fog Index (GFI)
TDT 11.4 13.2 15.1 15.4 16.0 17.5 17.6 19.2 19.3 20.8 16.5 DM 12 12.7 12.7 12.8 14.0 15.4 15.5 16.6 16.7 17.1 14.6
4.2 Frequency of the passive voice
The results regarding the frequency of the passive voice can be found in Table 4 below. The table should be read the same way as Tables 1-3, except that the results are in percentages here: each number represents the percentage of verb phrases in the passive voice. As can be seen, the mean of the articles from The Daily Telegraph is over twice the mean of the Daily Mail articles.
Table 4. The frequency of the passive voice (in %)
1 2 3 4 5 6 7 8 9 10 Mean
TDT 0 2.7 2.7 2.8 4.8 7.3 10 13.8 17.6 19.4 8.1
DM 0 0 0 2.3 2.5 2.9 2.9 7.7 8.1 10.7 3.7
However, as the analysed texts all are around 270 words, they do not feature an overwhelming number of verb phrases. The Daily Mail articles feature a total of 375 verb phrases, equalling an average of 37.5 per article. This means that the average verb phrase in the average Daily Mail article represents 2.7% of the total number of verb phrases in that article. The articles from The Daily Telegraph feature a total number of 367 verb phrases, bringing the average to 36.7 per article – here, too, one verb phrase corresponds to 2.7% of the total per article, due to rounding effects. Table 5, below, gives the number of passive verb phrases per article in absolute numbers.
Table 5. The total number of passive verb phrases
1 2 3 4 5 6 7 8 9 10 Mean
TDT 0 1 1 1 2 3 3 4 6 7 2.8
DM 0 0 0 1 1 1 1 3 3 3 1.3
The articles of The Daily Telegraph have, thus, an average of 2.8 verb phrases in the passive voice and the Daily Mail articles 1.3. As can be seen, three of The Daily Telegraph articles stand out by featuring as many as 4, 6 and 7 passive verb phrases, respectively.
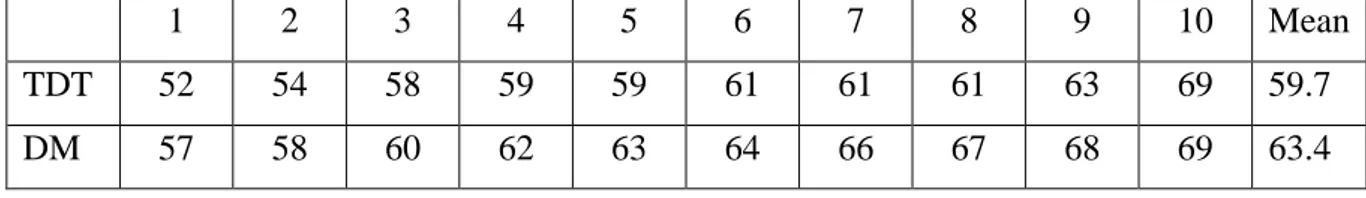
4.3 Type-token ratio
The results regarding type-token ratio can be found in Table 6 and should be read the same way as Table 4, with scores being given in percentage. To reiterate, a higher ratio suggests that the text is stylistically more varied and could thus be expected to be more difficult to read (see section 2.2.3).
Table 6. Type-token ratio (in %)
1 2 3 4 5 6 7 8 9 10 Mean
TDT 52 54 58 59 59 61 61 61 63 69 59.7
DM 57 58 60 62 63 64 66 67 68 69 63.4
In other words, for the first time in this results section the Daily Mail articles rank as less readable than those of The Daily Telegraph, with a Mail mean that is 3.7 percentage points higher.
4.4 Clauses per sentence
The results from the clauses per sentence analysis are presented in Table 7 below, which should be read in the same manner as Table 5. As stated in section 2.2.4, sentences with three or more clauses may cause confusion for the reader, yet all 20 articles either exceed that average or come very close to it.
Table 7. The number of clauses per sentence
1 2 3 4 5 6 7 8 9 10 Mean
TDT 3.3 3.8 3.8 4.1 4.1 4.1 4.2 5 5.1 5.1 4.3
DM 2.6 2.7 2.9 3.1 3.2 3.5 3.5 3.7 3.8 4.1 3.3
The articles from The Daily Telegraph average one clause more per sentence than the Daily Mail ones and, strikingly, the broadsheet’s average is higher than all individual Daily Mail results. In Table 8, below, the number of clauses per article is presented. The table should be read like Table 7.
Table 8. The number of clauses per article
TDT 29 30 36 37 37 37 38 40 41 42 36.7
DM 28 35 35 35 37 38 41 42 42 45 37.8
As can be seen, the higher clauses per sentence average in the articles from The Daily
Telegraph does not mean that there are more clauses in those articles; their average is actually 1.1 clauses less than that of the Daily Mail articles. The number of sentences per article is presented in Table 9, which should be read similarly to Tables 7 and 8.
Table 9. The number of sentences per article
1 2 3 4 5 6 7 8 9 10 Mean
TDT 7 8 8 8 9 9 9 11 11 12 9.2
DM 8 10 10 10 11 11 12 13 13 15 11.3
On average, the number of sentences per article is 2.1 higher in the Daily Mail articles compared to those of The Daily Telegraph. In Tables 8 and 9 it becomes clear that even though the articles from The Daily Telegraph have more clauses per sentence on average, it is not because they have more clause than the Daily Mail ones do. The reason for that result is that there are fewer (but necessarily longer) sentences in the Daily Telegraph articles.
4.5 Frequency of linking words
The frequency of linking words in percentage is presented in Table 10 below, which should be read in the same way as Tables 4 and 6. To reiterate, a high score supposedly increases the texts’ readability (see section 2.2.5).
Table 10. Linking words per article (in %)
1 2 3 4 5 6 7 8 9 10 Mean
TDT 1.8 1.8 2.2 2.5 2.5 2.6 2.9 3 3.2 3.8 2.6
DM 1.7 1.8 2.2 2.5 2.5 2.6 2.9 3.1 3.3 4.6 2.7
The results are strikingly similar, with no clear difference between the averages for the two newspapers. Moreover, all results from the second lowest to the seventh are identical and it is only in the articles with the highest frequency of linking words that a reasonably clear
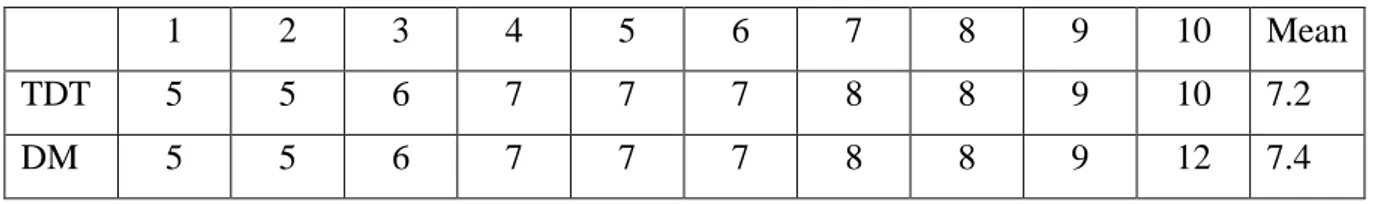
difference can be identified. Table 11, below, presents the number of linking words per article from low to high.
Table 11. The total number of linking words
1 2 3 4 5 6 7 8 9 10 Mean
TDT 5 5 6 7 7 7 8 8 9 10 7.2
DM 5 5 6 7 7 7 8 8 9 12 7.4
Table 11 shows even more clearly than Table 10 how similar the results for the two newspapers are: the lowest to the second highest scores are identical.
One of the most common linking words that appear in the articles is and. How the word is used varies, however. In The Daily Telegraph Article #5 it is used in the following context: I find that a disappointing and surprising decision. Here, and simply links the adjectives disappointing and surprising to assert that the decision was, according to the quoted person, both those things. In the following sentence from Daily Mail Article #5, and is used as a conjunction to introduce a new clause, i.e. to smoothly make a transition to the next clause: Under EU rules, the Government could not favour a British company and had to choose the best-value bid. These are examples of additive linking (transition) words (see section 2.2.5). The linking word after is common, too, in the articles. In The Daily Telegraph Article #10 there is an example of how it is often used: Theresa May has conceded that her plans for a customs partnership with the EU are “dead” after senior Cabinet ministers turned on her during a crunch Brexit meeting. Here, after links two events and highlights that one event happened before the other did. Other linking words feature too, of course, in the articles, such as but, because, and however.
5. Discussion
In this section, I first discuss the results from the different methods one by one, followed by a combined discussion of all the results to see whether a consistent pattern can be detected or whether there are some discrepancies. After this, I discuss the material used in this study.
5.1 Readability formulas
The FKGL results appear to overestimate the articles’ textual difficulty, which is actually the opposite of what Stossel et al. (2012, p. 1169) and Wasike (2016, p. 14) suggest they might.
Regardless, that some newspaper articles would need 16 years of education or more seems to be implausible, as that would correspond to a Master’s degree. Stossel et al. (2012), who also used both FKGL and SMOG, saw higher scores yielded from SMOG than from FKGL, unlike the results in this study. To reiterate, they analysed patient education materials from three different types of sources; the FKGL averages ranged from 7.7 to 8.5, whereas the SMOG scores ranged from 9.4 to 10.4, whereas this study saw results of 14.6 for The Daily Telegraph and 12.7 for The Daily Mail.
However, all three readability formulas aligned in that they ranked the articles from The Daily Telegraph as less readable, in terms of how easy it is to understand the articles, than the Daily Mail ones. However, SMOG calculated a noticeably smaller difference between the two papers than FKGL and GFI, whose results are comparable. The difference in the SMOG results are so small that no conclusive pattern can be detected. Furthermore, the four highest Daily Telegraph FKGL scores either equalled or exceeded the highest Daily Mail score. Similarly, that number according to GFI was five, but just one according to the SMOG index. Applying the majority principle, as Backman (2015) suggests, it is then advisable to accept the results of FKGL and GFI, and disregard SMOG. However, using the majority principle when applying three formulas is fragile because if a fourth formula is applied and yields similar results to those of SMOG, or something else entirely, the majority principle is no longer applicable. Nevertheless, only the methods used and their results can be fully discussed within this context, and the general pattern in these formula results is that the Daily Mail articles are more readable than those of The Daily Telegraph according to those methods. However, as discussed in section 2.2.1, the merits of these readability formulas is an oft-debated topic with contrasting views in evidence. The results cannot be seen as absolute measures of the articles’ readability. They measure certain aspects of the texts, namely
average sentence length in relation to average word length, which may not always be accurate measures of readability. Furthermore, that one method gave higher scores than the other for one study and the opposite is shown in another (see first paragraph of this section) arguably brings the legitimacy of these readability formulas further into question. Still, as DuBay (2007, p. 6) notes, they have been used in over a thousand studies and they are deemed accurate enough to be used in courts as evidence. In other words, nothing conclusive can be said about these results given the question marks regarding the method as such, but they suggest that the articles from The Daily Telegraph are more difficult to read than the Daily Mail ones.
5.2 The passive voice frequency
With a frequency of twice as many passive voice constructions in The Daily Telegraph on average, in terms of both percentages and absolute numbers, this method yielded perhaps the clearest result of all methods, suggesting rather strongly that the Daily Mail articles are more readable than those of The Daily Telegraph. However, as pointed out in section 3.3, all instances of the passive voice were counted, including short passives, which do not necessarily affect readability negatively. Discounting all occurrences of the short passive would probably improve this method and study further, and is recommended for future studies. In hindsight, that could have been done for this study, especially considering the overall low numbers of verb phrases in the passive voice, but going into the analysis I did not know what to expect in terms of numbers and time was an issue, so counting all occurrences was deemed a time-efficient move.
The Daily Mail average of 3.7% (1.3 in numbers) verb phrases in the passive voice is
comparable to Backman’s (2015) results in her translation studies (see section 2.3). Both her source texts and the translated texts had an average of 4% passive verb phrases. The average of The Daily Telegraph, 8.1% (2.8), is, thus, not only twice the average of the Daily Mail, but also compared to Backman’s results. However, as the material differs – Backman used
information texts from the Red Cross – nothing major can be said about the similarities, or dissimilarities, of her results to those of this study’s.
Furthermore, even if the passive voice is more than twice as common in the articles from The Daily Telegraph, it is still not overwhelmingly common, except perhaps in the articles where it represents 17.6% and 19.4% of all verb phrases. Twice as many passive verb phrases sounds, thus, perhaps like a bigger difference than it is. After all, the difference is only 1.5 passive verb phrases more, on average, in the Daily Telegraph articles. Had there been higher numbers, say averages of 5 and 10 passive verb phrases per article, then a score of twice as many arguably would have carried greater significance. Nonetheless, the numbers are clear in that the passive voice is clearly less frequent in the Daily Mail articles, which then suggests that they are more readable than their The Daily Telegraph counterparts.
5.3 Type-token ratio
Measuring the type-token ratio is the only method that might suggest, with a margin of 3.7 percentage points, that the Daily Mail articles are more difficult to understand on average than
those of The Daily Telegraph. However, variation does not automatically mean that the text is more advanced, so these results cannot be taken as absolute proof of that. Moreover, the results are fairly streamlined in that all but two articles fall within the range between 57% and 69%, which would seem to support Miliander’s (2003, p. 27) claim that the results are partly dependent on sample size. This is also reflected when comparing this study’s results with Miliander’s results, whose averages for written texts normalised at 100 words were 76% and 79%. It is thus hard to compare her results with these, as the analysed texts in this study are around 2.7 times as long.
It is also debatable how much of a difference 3.7 percentage points is; exactly how significant it is in terms of readability is hard to say, so no broad claims can be made on the matter, especially given that there is no absolute connection between variation and readability. At most, what can be said is that these results seem to suggest that the Daily Mail articles are harder to understand than the articles from The Daily Telegraph.
Moreover, as mentioned in the methods section, there are other, perhaps more reliable, ways of measuring type-token ratio. The corpus-based software Wordsmith, for example, is widely used – it has been employed to analyse the British National Corpus and Miliander (2003) used it in her study. However, Wordsmith and the website Readability Formulas (used in this study, to reiterate) work similarly when calculating type-token ratio, except with Wordsmith you can decide how it should count hyphenated words and numbers. The reason the
Readability Formulas website was used for this study is because it was a time-efficient move; it is arguably easier to navigate than for example Wordsmith, and gathering both type-token ratio and readability formula scores in one place was convenient.
5.4 Clauses per sentence
Along with the readability formula scores and those regarding passive voice frequency, the number of clauses per sentence also seem to suggest that the articles from The Daily
Telegraph are more difficult to understand than those of the Daily Mail, as it appears to be a fact that sentences with three or more clauses are a source of confusion for some readers (Zipoli, 2017, p. 220). With an average of one clause per sentence more (4.3 compared to 3.3), and seven of ten Telegraph articles having as many clauses per sentence as the Daily Mail article with the highest score, or even more, the difference here is clear. That the two newspapers had similar averages of clauses per article arguably suggests that the Daily Mail
writers are, either consciously or unconsciously, writing shorter sentences, with increased readability as a consequence.
5.5 Linking words frequency
The frequencies of linking words in the two papers were notably similar. With the exception of the two articles with the highest number of linking words, one from each paper, the numbers aligned entirely, and the difference between the two papers’ averages of 0.1
percentage points (2.6% and 2.7%) is negligible. Comparing with Backman’s (2015) results, who looked at the same types of linking words, these frequencies are 1.3 and 1.4 percentage points lower than both her source texts and translated texts (both had averages of 4%). It is also important to remember that this study does not count all types of linking words, but only transition words. If all types of linking words had been counted, the differences might have been more compelling. However, the newspapers’ use of linking words, or at least these types of linking words, do not seem to differ barely at all.
5.6 Comparison of results
In sum, this study was based on five different methods to analyse the investigated articles’ readability. Three of these methods – the readability formulas, the analysis of passive voice use, and the calculation of clauses per sentence – suggest that the Daily Mail articles are more readable on average, in the sense of being easier to understand, than those of The Daily Telegraph. One aspect – the type-token ratio – implies that the articles from The Daily Telegraph are more readable than their Daily Mail counterparts. The fifth method – the
frequency of linking words – appears to suggest that there is no difference in readability at all, at least not in this particular regard.
5.7 Material
As stated in section 3.1, 20 articles in total were analysed – 10 from the broadsheet The Daily Telegraph and 10 from the tabloid Daily Mail. All these articles were about Brexit and pairs of articles were identified and analysed. It occasionally proved tricky to find such pairs, for while the respective paper’s online archive was full of Brexit articles, their choice of content varied rather clearly. The decision to only analyse pairs is thus debatable, as one might argue that choosing 10 Brexit articles at random from each newspaper might be more representative. On the other hand, if both newspapers deem an event worthy enough to report on it, that could
suggest that those events are of extra importance, which would mean that readability becomes even more relevant.
Furthermore, analysing Brexit articles only is also debatable in the sense that they do not necessarily represent each newspaper as a whole. The sample may be representative of the readability of all the newspapers’ Brexit articles, or possibly – at a stretch – of articles about politics in general, as they are presumably written by partly the same writers, but that is still just one topic area of several in the newspapers. To be able to say anything conclusively about the readability of the newspapers, more comprehensive studies would be needed where
several, if not all, parts of the papers are analysed, such as sports, culture, business,
technology, and perhaps even opinion-based articles like editorials. The present study could have included different types of articles as well, but given its limited size, that would probably mean one or two articles from each category, which would not have been representative, either. Focusing on one specific category, or possibly two, for a study with the size of this one is arguably preferable, as that at least gives the opportunity to draw certain conclusions about a type of articles.
6. Conclusion
On the basis of the methods used in this study, and their results, it seems that the Daily Mail articles are more readable than those of The Daily Telegraph. However, as there are many more aspects that affect readability than those addressed in this study, both linguistic and otherwise, no broad claims can be made. Readability is no exact science, which makes it a tricky subject to study; the mere fact that not all the results in this study align support this view. The field is arguably over-reliant on readability formulas, as they’re not fully accurate and because there are so many more factors that affect readability than word length and sentence length. Moreover, a more thorough analysis of more articles, and different types of articles, would be needed before making any general claims about the readability of the newspapers. However, studies such as this one are important to highlight the importance of readability and to educate others what one can do to try to maximise readability, such as keeping sentences short, avoiding “big” words, writing in the active voice, and connecting parts of the text with the help of linking words. Maximising readability is not only essential for the reader, but also for the writer: the easier it is to understand the text, the likelier it is that the writer succeeds in getting the message across as intended.
References
Backman, P. (2015). Achieving readability: Red Cross texts and their English translations. BA thesis, Mälardalen University. Retrieved from
http://www.diva-portal.se/smash/get/diva2:840799/FULLTEXT01.pdf
Ballard, K. (2013). The frameworks of English: Introducing language structures (3rd ed.). New York: Palgrave Macmillan.
Broadsheet. (n.d.). In Oxford English Dictionary. Retrieved from https://en.oxforddictionaries.com/definition/broadsheet
Cornish, D. (2012 November, 28) Algorithm deems The Sun easiest tabloid to read, comparable to CBBC. Wired. Retrieved from http://www.wired.co.uk/article/analysis-of-news-articles
DuBay, W. (2007). Readers, readability, and the grading of text. Costa Mesa, California: Impact Information.
Hoke, B. L. (1999). Comparison of recreational reading books levels using the Fry Readability Graph and the Flesch-Kincaid Grade Level. Ph.D. thesis, Kean University. Retrieved from ERIC. ED428333
Kouamé, J. (2010). Using readability tests to improve the accuracy of evaluation documents intended for low-literate participants. Journal of MultiDisciplinary Evaluation, 6(14), 132-139. Retrieved from http://journals.sfu.ca/jmde/index.php/jmde_1/article/view/280
Lenzner, T. (2014). Are readability formulas valid tools for assessing survey question difficulty? Sociological Methods & Research, 43(4), 677-698.
Marnell, G. (2008). Measuring readability. Retrieved from https://www.abelard.com.au/readability%20statistics.pdf
Millar, N.. Budgell, B., & Fuller, K. (2013). Use the active voice whenever possible: The impact of style guidelines in medical journals. Applied Linguistics, 34(4): 393-414.
Miliander, J. (2003). We get the answer we deserve: A study of vocabulary in a spoken and written corpus of advanced learner in English. Doctoral dissertation, Karlstad: Karlstad University.
Mohamed-Sayidina, A. (2010). Transfer of L1 cohesive devices and transition words into L2 academic texts: The case of Arab students. RELC Journal, 41(3), 253-266.
Readability Formulas, (n.d.). Retrieved from http://readabilityformulas.com/
Rollins, M., & Lewis, S. (2013). A comparison of the readability of newspaper columns written by National Journalism Award winners. Journal of Organizational Culture, Communications and Conflict, 17(1), 149-153.
Sherman, L. (1893). Analytics of literature: A manual for the objective study of English prose and poetry. Boston: Ginn.
Stossel, L., Segar, M., Gliatto, N., Fallar, P., & Karani, R. (2012). Readability of Patient Education Materials available at the point of care. Journal of General Internal Medicine, 27(9), 1165-1170.
Tabloid. (n.d.). In Oxford English Dictionary. Retrieved from: https://en.oxforddictionaries.com/definition/tabloid
Wasike, B. (2017). Preaching to the choir? An analysis of newspaper readability vis-a-vis Public Literacy. Journalism, doi: 146488491667338.
Zipoli, R. (2017). Unraveling difficult sentences. Intervention in School and Clinic, 52(4), 218-227.
Appendix
Articles from The Daily Telegraph
Article #1: Crisp, J. (2018, February 6). 'Soft Brexit is dead': Nick Clegg admits his fight to keep UK in Single Market is over. The Daily Telegraph. Retrieved from:
https://www.telegraph.co.uk/politics/2018/02/06/soft-brexit-dead-nick-clegg-admits-defeat/ Article #2: Rayner, G. (2018, February 8). Cabinet still 'million miles away' from agreeing Brexit position as Theresa May insists she has 'no doubts' about EU withdrawal. The Daily Telegraph. Retrieved from: https://www.telegraph.co.uk/news/2018/02/08/cabinet-still-miles-away-agreeing-position-brexit/
Article #3: Maidment, J. (2018, February 9). UK must 'set in stone' commitment to no hard Irish border for Brexit talks to move forward, suggests Dublin. The Daily Telegraph. Retrieved from: https://www.telegraph.co.uk/politics/2018/02/09/uk-must-set-stone-commitment-no-hard-irish-border-brexit-talks/
Article #4: Malnick, E. (2018, February 10). Michel Barnier has 'fractured the EU by stepping up his aggression towards Britain'. The Daily Telegraph. Retrieved from:
https://www.telegraph.co.uk/news/2018/02/10/michel-barnier-risking-uk-walkout-eu-states-fear/
Article #5: McCann, K. (2018, March 22). Snubbed British firm demands answers from Theresa May as Cabinet minister hints blue passport contract not a done deal. The Daily Telegraph. Retrieved from: https://www.telegraph.co.uk/politics/2018/03/22/snubbed-british-firm-demands-answers-theresa-may-cabinet-minister/
Article #6: McCann, K. (2018, March 27) UK workers 'lazier and more expensive' than migrants. The Daily Telegraph. Retrieved from:
https://www.telegraph.co.uk/politics/2018/03/27/british-firms-not-ready-loss-eu-migrant-labour-report-finds/
Article #7: Telegraph Reporters (2018, March 28). Britons could lose rights to urgent treatment in EU after Brexit, peers warn. The Daily Telegraph. Retrieved from:
https://www.telegraph.co.uk/politics/2018/03/28/britons-could-lose-rights-urgent-treatment-eu-brexit-peers-warn/
Article #8: Telegraph Reporters. (2018, April 3) British firm launches appeal to secure Government blue passport contract. The Daily Telegraph. Retrieved from:
https://www.telegraph.co.uk/politics/2018/04/03/blue-passport-british-firm-launches-appeal-secure-government/
Article #9: Swinford, S. (2018, April 26). DUP threatens to bring down Theresa May's Government if it crosses Customs Union red line. The Daily Telegraph. Retrieved from: https://www.telegraph.co.uk/politics/2018/04/25/dup-threatens-bring-theresa-mays-government-climbs-brexit/
Article #10: Rayner, G. & Swinford, S. (2018, May 3) Theresa May concedes customs partnership plan is 'dead' after Cabinet ministers turn on her. The Daily Telegraph. Retrieved from: https://www.telegraph.co.uk/politics/2018/05/02/sajid-javid-rejects-theresa-mays-plans-customs-partnership-days/
Articles from the Daily Mail
Article #1: Tapsfield, J. (2018, February 6). Nick Clegg blames EUROCRATS for Brexit in damning attack on their 'sneering' attitude to patriotism in member states. Daily Mail. Retrieved from: http://www.dailymail.co.uk/news/article-5357021/Nick-Clegg-blames-sneering-Eurocrats-Brexit.html
Article #2: Tapsfield, J. (2018, February 8). Davis slams Brussels for threatening to punish Britain during the Brexit transition as May's 'war Cabinet' fails to finalise a negotiating strategy. Daily Mail. Retrieved from:
http://www.dailymail.co.uk/news/article-5367013/Fears-mount-Cabinet-DEADLOCK-Brexit.html
Article #3: Sculthorpe, T. & Tapsfield, J. (2018, February 9). 'You can't have it both ways': Furious David Davis slams Michel Barnier's threats to block a transition deal if Britain refuses EU demands on the Irish border and free movement. Daily Mail. Retrieved from:
https://www.dailymail.co.uk/news/article-5371945/Barnier-warns-Irish-border-checks-unavoidable.html
Article #4: Tapsfield, J. (2018, February 11). Barnier faces backlash in EU states over 'aggressive' bid to force Britain to stay in the customs union. Daily Mail. Retrieved from: http://www.dailymail.co.uk/news/article-5377577/Barnier-faces-EU-backlash-aggressive-approach.html
Article #5: Tapsfield, J., Brown L., Drury I. & Doyle, J. (2018, March 21). 'They should be supporting British business': UK firm condemns ministers after the contract to produce post-Brexit blue passports is handed to a FRENCH company. Daily Mail. Retrieved from:
http://www.dailymail.co.uk/news/article-5529195/Iconic-British-blue-passports-DUTCH.html Article #6: Sculthorpe, T. (2018, March 27) Businesses in ALL sectors fear the loss of
migrant workers after Brexit because they can offer better skills at lower costs, Government is warned. Daily Mail. Retrieved from:
http://www.dailymail.co.uk/news/article-5548895/Businesses-sectors-fear-loss-migrant-workers.html#ixzz5B3Mzjfph
Article #7: Ferguson, K. (2018, March 28) Britons could lose rights to urgent medical treatment in the EU after Brexit, peers warn. Daily Mail. Retrieved from:
http://www.dailymail.co.uk/news/article-5553175/Britons-lose-rights-urgent-medical-treatment-EU-Brexit-peers-warn.html
Article #8: Churchill, D. (2018, April 3). Theresa May confirms British firm WILL get an extra two weeks to challenge decision to make new post-Brexit blue passports abroad. Daily Mail. Retrieved from: http://www.dailymail.co.uk/news/article-5573203/PM-confirms-British-firm-two-weeks-challenge-passport-decision.html
Article #9: Groves, J. (2018, April 26). DUP warn they will bring down the Government if Northern Ireland is forced to stay in the customs union after Brexit. Daily Mail. Retrieved from: http://www.dailymail.co.uk/news/article-5658085/Theresa-Mays-DUP-allies-issue-customs-union-threat.html
Article #10: Groves, J. (2018, May 2). May 'caves in to Tory Brexiteers': Customs partnership looks dead in the water after Sajid Javid tips the balance against the Prime Minister - just two days after she appointed him Home Secretary. Daily Mail. Retrieved from:
http://www.dailymail.co.uk/news/article-5684627/Brexiteers-trade-victory-Customs-plan-looks-dead-water.html#ixzz5EuM5Of00