1
1. Introduction
Water damage
Water has become the major source of damage to buildings in Sweden, but that has not always been the case. This problem was considered to be a minor problem during the first half of the 20th century, but it has increased since 1960 (Johansson B. G. Länsförsäkringar, personal communication 2012). Nowadays in Sweden, about 0.7 % of all buildings are subject to water damage annually (Johansson B. G. Länsförsäkringar, personal communication 2010). The reason for the increase in water damage could be both changing habits and different ways of building. It is obvious that living habits have changed. We use much more water today than in the 1950s, dishwashers and ice and coffee machines in kitchens, the habit of showering instead of bathing in the bathroom etc. Building materials and methods have also changed since the 1950s and buildings from the 1960s and 1970s seem to be more vulnerable to such damage (Vattenskade-centrum 2010), than earlier buildings. There is a common belief that buildings nowadays are tighter than in the beginning of the 20th century and that this may lead to water damage.
Building constructions
Tightness
Modern houses use less energy than houses built in the beginning of the 20th century, due partly to thicker layers of insulation in the building envelope. It is then very important that this envelope is very tight, otherwise warm humid air may penetrate into the envelope and lead to condensation in the outer part of the envelope. The condensed water will cause decay and mould and damage the house. Many materials used for the envelope such as the polyethylene foil are very tight, but oriented strand and gypsum boards also prevent air movements. As the latter materials are used in the inner house construction, they will prevent air movement in these structures and also prevent damage water from leaving these construction parts. Buildings in the early part of the 20th century used other materials such as matchboards and lining paper. These materials are not used today for economic reasons, but this type of construction may permit more air movement through the structure.
2
Mould
Water could cause mould growth if it leads to a high RH within the construction. Mould needs a satisfactory temperature, time and a relative humidity of at least 75 % to grow and if the humidity rises, the growth of the mould is more rapid, (Sedlbauer 2001, Viitanen 2002). A relative humidity of 75% RH is also considered to be the critical moisture limit according to BBR (Boverkets Bygg-regler 2006). In an exterior wall of a bathroom, even a small amount of water passing through a damp-proof membrane and trapped by the tighter vapor barrier, may cause mould growth on gypsum boards in the construction, (Jansson 2005). There are situations where mould growth can be hidden inside the construction and many mould toxins are also odorless (Larsson L, University of Lund personal communication 2010). Water damage and mould are also linked to allergic reactions among children (Emenius 2003). When water and mould-damaged houses are remedied, the users’ health is found to improve (Ekstrand-Tobin A.2003).
Costs of water damages
Vattenskadecentrum, a Swedish organization run by insurance companies and building trade associations that surveys water damage, estimated that water damage cost more than SEK 5 billion in the year of 2005. (Ström et al 2005). Now the costs seem to have escalated to SEK 10 billion (Kling R. VVS-företag-en personal communication 2012).
This sum includes:
1. Actual costs for the insurance companies. 2. Estimated costs for private deductibles.
3. Estimated costs for water damage in the large public real-estate companies.
This sum does not include:
1. Water damage costs for buildings owned by the public, such as hospitals, schools and other official buildings (Ström et al 2005).
2. Water damage that the insurance companies do not assure, such as water coming from the outside and condensation damage (Villahemförsäkring VH 07).
3. Health costs caused by water damage such as allergy and asthma. Investi-gations by Emenius (2003) and Hägerhed Engman (2006) show that there is a clear correlation between water damage and asthma/allergy.
4. Costs arising during the building process and paid by the building enter-prises. These costs are also difficult to estimate and no estimations are yet available, calculated by the building enterprises, although many builders are committed to solving the problem (Tuutti K. Skanska, personal communi-cation 2008).
3
Existing robust building constructions of today
The author of this thesis claims that most of Swedish dwellings are susceptible to water damage because moisture may become trapped within the building structure. There are however some good examples such as the Vaska concept, which is a regular building concept and also a number of ventilated construc-tions for floors and bathrooms.
The Vaska concept was developed by the county authority of Västerbotten and the insurance company, Länsförsäkringar-Västerbotten during the eighties. This method requires systematic water protection and especially a secure installation of pipes. The building costs increase by 1 %, but the water damage caused by broken pipes and floods in kitchens is drastically reduced (Andersson & Kling 2000).
The ventilating plastic membrane is purchased by different manufacturers, (see www.floordry.se and www.isola-platon.se ). The membrane creates an air gap of about 5 mm above the water damaged floor and this provides conditions for air ventilation, which should be achieved by mechanical appliances. The ventilation rate in this type of system was investigated by Elmroth A. et al (www.isola-platon.se) and by Hagentoft and Holmberg (2005). The floor joists (Nivell floor) is built on joists attached to the structural slabs of the building and creates an air-gap below the insulation, (www.nivellsystem.se). The floor system permits air ventilation in structure, which can be achieved by mechanical appliances. The manufacturer estimates that the air flow should be between 0.15 and 0.20 liters/m2·s.
A ventilated prefabricated bathroom is often an installed inside an old bathroom, with possible water damage (www.rumirum.se,). An air-gap is created between the old and the new bathroom, where ventilating air can pass. Construction moisture could dry after the prefabricated bathroom is installed. The time for this drying could, according to experience, be at about 6 to 9 months. (Tjulander H. CEO InWall personal communication 2010). The air flow is assumed to be very slow in this case.
4
The Air Gap Method
The Air Gap Method described in this thesis and shown in Figure 1 is a modification of the common way of building the infill wall houses. It is built by the same materials and manners, but the Air Gap Method is also an accomplished way of creating air flow through the whole construction. The flow is achieved by convection caused by a heating cable. The aim of the method is to remove dampness from the construction and thus protect it from moisture related damage such as mould. The dampness may enter the building construction either during the building phase or the maintenance phase, through leakage, flooding or condensation. As the Air Gap Method works with slow air flow, it is interesting to investigate the details about processes resulting in such a flow.
5
Figure 1. A principle draft of the Air Gap Method: It consists of air gaps in
floor and wall that are connected to each other, inlets and outlets to surrounding rooms and a heating cable in the vertical air gap. This picture was presented in DN 2 November 2007, graphic by Stephan Rothmaier.
1. Heating cable (15 watt/meter) Heats the air around the cable. The warm air rises and creates an air flow though the gaps
2. As air flows through the gaps, dry room air enters by the inlet.
3. The dry room air lowers the RH in the construction, Mould does not grow when the RH is lower than 75 %.
inlet
6
Characteristics of air flow
Reynolds number and laminar air flow
Air flow at a low velocity in a narrow air gap, may be laminar or turbulent. Turbulent flow has higher friction at the same velocity than a laminar flow (Levin P. 1991), which means a lower flow at a given pressure. Whether the flow is laminar or turbulent is determined both by the velocity of the medium and by the geometry and surfaces of the gap through which the medium flows. A flow remains laminar at higher velocities within a smooth rounded system than in a system that contains sharp edges. The air flow changes from laminar to turbulent when the velocity exceeds a critical limit. The conditions determine whether a flow is laminar or turbulent are described by the Reynolds number (Prandtl and Tietjens 1934) .
Slow air flow
There are at least four research fields where slow air movement is of interest: A. Air flow inside air gaps of enclosure walls, B. Convection air flow to cool electrical devices, C. Convection that causes natural ventilation in houses and D. Thermal plumes around persons or electrical devices.
A. Air flow inside air gaps inside a building envelope. These air gap systems play an important role in the drying of external walls. This has been shown both experimentally and mathematically (Davidovic 2006, Gudum 2003) and is a topic in basic educational material. (Johannesson 2006). The geometry of this type of air gap resembles the air gap of this thesis, but the air gap of the exterior wall has no heating cable. The temperature in these air gaps differ from the outdoor temperature because of solar radiation on the wall etc. and this difference in temperature causes an air flow as well as wind pressure.
B. Laminar convection in heated vertical channels is of interest in electronic cooling applications (Burch 1985, Campo 2005 and Androzzi 2002). These authors treat wall conduction, wall and air gap temperatures and air velocity, but the geometry of the gap and the amount of power added differ greatly from the conditions in the Air Gap Method.
C. Natural convection occurring in a heated column of air is described by the stack equation (Skistad 1995, Ashrae 1989). Foster (1987) has compiled a number of different expressions that describe this effect.
D. Convective air flow is the reason for thermal plumes around persons and electrical devices in dwellings. This flow has been measured (Mierzwin-ski 1981, Popiolek 1981) and calculated (Mundt 1996, Mundt et al in Skistad 2002). These works are interesting as they relate the flow to an estimated power from a line source.
7
Research questions related to the Air Gap Method
This thesis includes a theoretical concept with a mathematical model, laboratory studies, and full-scale studies of the Air Gap Method in different situations. It contains also an implementation part about how to construct a small detached house incor-porating the Air Gap Method. The research questions are as follows: 1. How does the moisture transport out of the construction depend on the
geometry of the air gap?
2. How does the moisture transport out from the air gap depend on the power of the heating cable?
3. How does the air flow in an Air Gap construction depend on the power of the heating cable?
4. Can the Air Gap Method reduce drying-out time in a water damaged building structure?
5. Can the Air Gap Method reduce the risk of mould growth inside a building structure?
8
2. Theory of the Air Gap Method
The theoretical part and the first Laboratory study are based upon a test rig with a connected air gap in the floor and wall section, see Figure 2. There is an air inlet in the floor section and an outlet in the wall section. The heating cable is placed in the wall part. The overall dimensions are displayed in Table 1.
Figure 2. A schematic picture of the Air Gap Method. The wall gap has the
heating cable at the bottom and the floor air gap has the water saturated surface that is to be dried out.
Theory
In the air gap system, there are two connected air gaps, one horizontal and one vertical and different physical processes take place in the two gaps.
The physics in the air gaps
In the bottom of the horizontal air gap, there is the wet surface. The physical processes taking place in this air gap are of four different kinds; evaporation, cooling due to evaporation, heat transport to compensate the cooling and air flow. The humid board with a water saturated surface lies on the bottom of the floor air gap. If the floor air gap is sufficiently long the air will become saturated when it passes towards the vertical air gap. When water evaporates, the surface is cooled, as is also the air above. When the air is saturated the cooling effect ceases and as heat is transported into the air gap, the temperature approaches to the temperature of the surrounding room. Hence; in a long humid air gap, the air at the end of the gap will be saturated, cooled and warmed again. In a shorter gap, the air will be more or less saturated and cooled.
In the vertical air gap there is a heat supply to the air from the heating cable and it is here assumed that all the heat is absorbed by the air. There is also a heat transport from the air gap through the wall materials to the surrounding room.
9
The heated air in the vertical air gap becomes lighter and rises, sucking the air from the horizontal air gap.
Humid air is lighter than dry air; the molecule weight of oxygen gas is 32, and of nitrogen 28, but the molecular weight of water is 18 . Air of 100 % RH is 0.4 % lighter than air of 50 % RH at 20 oC. Air that is three centigrades warmer is about 1 % lighter than air at 20 oC. Hence the air the vertical air gap is lighter both because of the higher humidity and because of the temperature increase caused by the heating cable. Both these factors contribute to suck the air from the horizontal air gap. The geometry of the air gap is also important, the air flow will for instance meet a friction that depends on the narrowness of the gap.
From physical to mathematical model
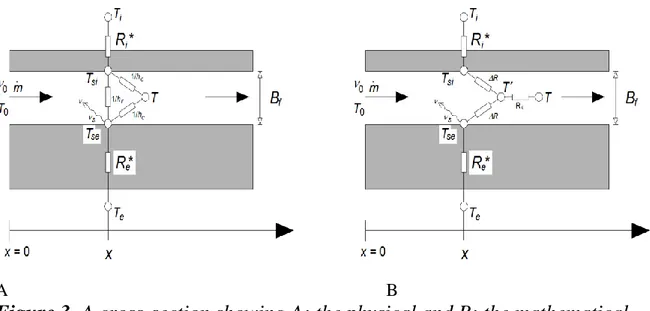
The physical flows of heat, air and humidity that in the horizontal and vertical air gaps are presented in the A part of Figure 3. These flows are however complicated to present in mathematical equations as the degrees of freedom are too many. The radiation and convection exchanges between the downside and upside of the horizontal air gap give degrees of freedom that are especially difficult to model. Through a delta-star transformation, it is possible to construct a mathematical model with a fictitious temperature T´ where the resulting heat flow from the upper and lower surfaces ceases and the interaction according to convection and radiation between the upper and lower surfaces may then be excluded. In the mathematical model shown at B in Figure 3, it is possible to express the flows in a total of only seven equations. The mathematical analyses are presented in article V in this thesis.
A B
Figure 3. A cross-section showing A: the physical and B: the mathematical
10
The Equation system of the mathematical model
Different equations concerning heat and mass balances, moisture content and the temperature influence of the heating cable are presented hereby. The following nomenclature is used.
Nomenclature
Abbreviation Explanation Denom.
First derivative of the saturated moist. cont. as function of temperature (kg·m-3·K-1). Width of the floor air gap (m)
Bf Depth of the floor air gap (m)
Bw Depth of the wall air gap (m)
se Surface coefficient of convective heat transfer (m·s-1),
cw Specific heat of the mixture of air and water vapor in the wall air gap (J·kg-1·K-1) cf Specific heat capacity, of air and water vapor in the floor air gap (J·kg
-1 ·K-1)
Lf Length of the floor air gap (m)
Hevap Heat of evaporation for water (J·kg
-1 )
Hw Height of the wall air gap (m)
̇ Mass flow rate in the air gap (kg·m-3)
Dynamic viscosity (Pa·s)
ν Moisture content of the air (kg·m-3)
( ) Saturated moisture content, depending on surface temperature (kg·m-3)
Pressure drop due to friction (Pa)
̇ Total effect from the hot wire (W)
Thermal resistance between inner layers and T´ (m2KW-1)
Rf,fluid Fluid resistance of the floor air gap (Pa·s·m-3)
Rfr,fluid Sum of the fluid resistances of the wall and the floor gaps (Pa·s·m-3)
Rw,fluid Fluid resistance of the wall air gap (Pa·s·m-3) Thermal resistance in upper layer (m2·K·W-1)
Rx Thermal resistance between T´ and T (m
2
·K·W-1) Density of the air-water mixture in the floor air gap (kg·m-3)
Increase in temperature provided by the heating cable (K)
T Temperature of the air gap (K)
T´ Fictive temperature according to delta star transformation (K)
Te Temperature in the room below the air gap (K)
Ti Temperature in the room above the air gap (K)
Tse Temperature of the wetted inner surface below the air gap (K)
Tsi Temperature of the inner surface above the air gap (K)
Six of these parameters are unknown in the given circumstances; ( ̇ ν T T´ Tsi
11
Equations
The equations are as follows:
The heat balance of the upper inner surface of the horizontal air gap is described by:
(1)
The heat balance for the fictitious node T´ yields:
(2)
The heat balance for the lower surface can be written:
( ( ) ) (3)
A heat balance for the air gap in the floor gives eq. 4: ̇
(4)
and a mass balance for the air gap in the floor results in eq. 5: ̇
( ( ) ) (5)
The saturated moisture content at a given temperature at the surface is given by: ( ) ( ) ( ) (6)
and the relation between the power of the heating cable and the rise of temperature caused by the cable is given by:
̇ ̇ (7)
The air flow depends also of the fluid resistances of the wall and the floor channels that can be calculated by eq. 8 and 9:
12
(9)
The fluid resistances affect the pressure drop at the inlet and the outlet, by:
̇ (10)
The total mathematical work is shown in article V in this thesis.
Results: Mathematical model
The solutions given by the equation system are thus the mass flow, the water content in the air flow and the temperature at the end of the floor air gap. The results are depending on the geometry of the air gaps and the power of heating cable. From these results it is also possible to calculate the RH and the evaporation from the humid floor air gap. This is illustrated in Figure 4 where the evaporation in the floor air gap is plotted against the height of the floor air gap.
Figure 4. Calculated rate of evaporation plotted against height of floor air gap.
The air gap is 3 meter long.
0 2 4 6 8 10 12 14 0 5 10 15 20 25 30 Series1 Evaporation rate ·106 (kg/s)
13
The figure shows a sigmoid relationship with an inflection point for a floor air gap with a height of 10 mm. It is also evident that there is only a minor differ-rence in evaporation rate between 15 and 25 mm. The results of the mathe-matical study are compared to those of the Laboratory study A in Table 5.
Figure 5. Calculated rate of evaporation for different heights of floor air gaps,
plotted against length of floor air gap, when the floor air gap is totally wet. Serie 1 represents a 5mm height of floor air gap, serie 2 a 15 mm height of the gap and serie 3 a 25 mm gap.
The evaporation rate is minimal when the height of the air gap is only 5mm and the evaporation decreases when the length of the floor increase. The optimal length of floor air gap seems to be ca. 4 m, when the air gap height is 15 mm. When the length is shorter the rate of evaporation is lower possibly because of the cooling effect of the evaporation. For 25 mm the evaporation increases with the length of the floor, according to the model.
0 2 4 6 8 10 12 14 16 18 20 0 1 2 3 4 5 6 7 Series1 Series2 Series3 Evaporation rate ·106 (kg/s)
14
3.
Laboratory study A
:
Test rig
The mathematical model described above is based upon some simplifications compared to how air gaps may be constructed into buildings. These simplify-cations are the design of the inlets and outlets and the assumption that no water disappears into the construction. The mathematical model also assumes that the evaporation takes place from an open water surface. In reality the evaporation may take place from a humid board as a gypsum board. This Laboratory study A was done for a comparison with the mathematical study, all the parameters being the same except for the wet surface. The mathematical model assumed an open water surface, in Laboratory study A, this was a wet gypsum board.
Tight construction with no constriction at inlet or outlet
Three pairs of test rigs were built, see Figure 6 with the measurements shown in Table 1. The dimensions of all the rigs were identical, except for the height of the floor air gap. There was room to place two wet gypsum boards measuring 12x70 mm in the floor air gap and the heights of the air gap above the boards is presented in Table 1. The inlet and outlet have the same cross section area as the corresponding air gap. All the surfaces facing the air gap were sealed with plastic (Plastic Padding 2012.) as shown in Figure 7.15
Each test rig consists of floor and wall parts assembled together so that the air gap passes through the whole construction. All the test rigs share a common heating cable; see Figure 6 and the rigs were placed in a chamber without a window, measuring 3x3x3 m. For this study the power of the cables were tested using a combined volt and ampere meter, Metra Hit 14s from Gossen Metra Watt, showing that the power was 15 W/m.
Table 1. Dimensions of test rig and air gap with and without the wet gypsum
boards.
Test rigs section Air gap measures without wet gypsum boards (m)
Air gap measures with wet gypsum boards (m)
Test rig measure (m)
Floor air gap length 1.41 1.41 Floor length 1.41
Floor air gap width 0.20 0.20 Floor width 0.29
Floor air gap height 0.037, 0.027 or 0.017 0.025, 0.015 or 0.05 Floor height 0.16
Wall air gap height 2.1 2.1 Wall height 2.1
Wall air gap width 0.20 0.20 Wall width 0.29
Wall air gap depth 0.025 0.025 Wall depth 0.13
Figure 6. Test rigs used in Laboratory Study A. The arrow
16
The test rigs were built on a wooden frame and the surfaces of the air gaps were covered with plastic, to prevent water transport into the construction. From the rear side in, the order is as follows; gypsum board, insulation, MDF board air gap, gypsum board and OS-board, as shown in Figure 7. The air flow is marked with arrows in the figure.
Study
The gypsum boards, see point 11 in Figure 7 were soaked with water, weighed and placed in position in the test rig. The chipboard was then mounted in place and after a measured period the wet gypsum boards were taken out and weighed again. Blank tests were also performed, during these tests the outlets and inlets were clogged at point 13 and 14, see Figure 7, and the heating cable was swit-ched of. The results regarded as wet loss are displayed in Figure 8.
Figure 7. Cross section of the test rig used in Laboratory Study A
8 4 4 3 2 1 4 6 8 7 1 6 6 6 4 1 9 9 5 1 7 1 10 1 2 11 11 12 1. Gypsum board 13 mm 2. Oriented strand board 13 mm 3. Bottom sill 145/45 mm 4. Mineral wool board surface 5. Floor beam 6. Air gap 7. Chipboard 8. Heating cable 9. MDF board 10 mm 10. weather strip
11. Wet gypsum board 13mm 12. MDF board 12 mm 13. Air outlet 14. Air inlet 15. Point A 13 14 Moisture barrier 9 9 15
17
Results of test rig study
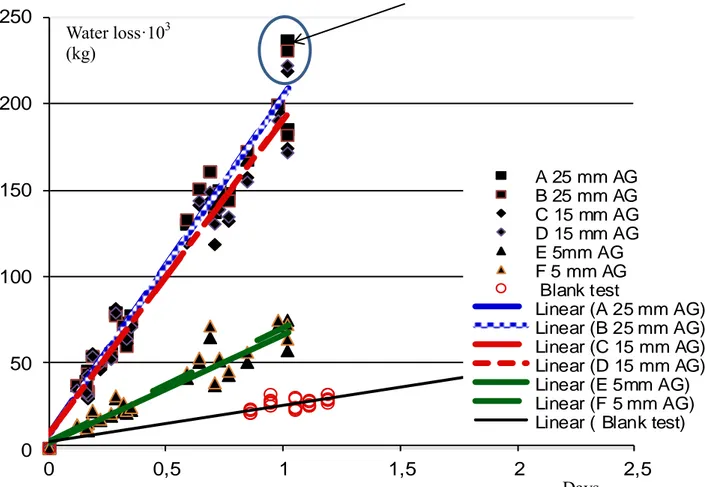
The water loss was considered to be due to mainly evaporation, but also to other leakages. The other leakages were considered to be measured with the blank tests. Each floor air gap height was represented by two test rigs and all these pairs showed a similar performance. There was only a small difference in the water loss between the 25 and 15 mm floor air gap heights, but the water loss from the height of 5 mm is considerably lower. The result is displayed in Figure 8 both in separate measurements and in trend lines.
Figure 8. Water loss versus time for different heights of the floor air gap and for
blank tests.
If the data displayed in Figure 8 are carefully analyzed, it is evident that different days with different RH give different results and that a low RH gives a higher dry out effect. The arrow points to a region with measured values from a day when the RH in the surrounding chamber was extra low.
0 50 100 150 200 250 0 0,5 1 1,5 2 2,5 A 25 mm AG B 25 mm AG C 15 mm AG D 15 mm AG E 5mm AG F 5 mm AG Blank test Linear (A 25 mm AG) Linear (B 25 mm AG) Linear (C 15 mm AG) Linear (D 15 mm AG) Linear (E 5mm AG) Linear (F 5 mm AG) Linear ( Blank test)
Days Water loss·103
18
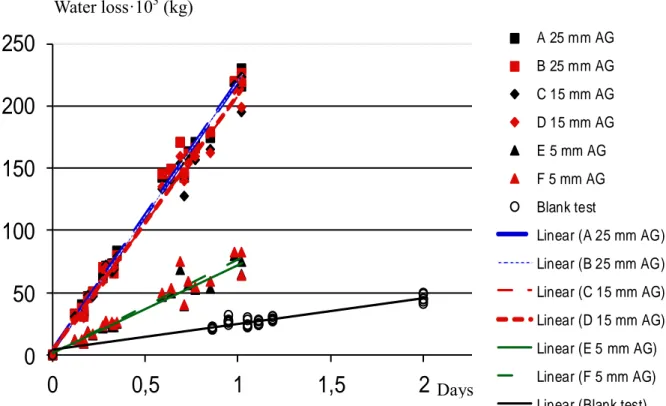
Figure 9. The data of Figure 8 adjusted with respect to the RH in surrounding
chamber.
Figure 9 shows the data of Figure 8 adjusted to a relative humidity of 40 % RH in the surrounding room. The points are more assembled, which is also evident in Tables 2 and 3, where the standard deviation of the water loss rate is lower after adjustment for variations in the RH in surrounding chamber. This argumentation works for the ordinary runs, but this correlation was not found for the blank tests, indicating that the loss of water in the blank tests was not due to evaporation into the chamber, but to other types of leakages.
Table 2. Results from the ordinary runs showing height of air gap, number of
runs, average water loss rate and standard deviation.
Height of air gap (mm) Number of runs (n) Mean water loss rate (kg/day) Sd
25 42 0.215 0.032
15 42 0.203 0.035
5 42 0.0735 0.017
Blank test 36 0.0248 0.003
Table 3. Results after adjustment for RH variations, showing height of air gap,
number of runs, average water loss rate and standard deviation. The blank test data are not adjusted.
Height of air gap (mm) Number of runs (n) Mean water loss rate (kg/day) Sd
25 42 0.228 0.020 15 42 0.215 0.020 5 42 0.078 0.014 Blank test 36 0.0248 0.003
0
50
100
150
200
250
0
0,5
1
1,5
2
2,5
A 25 mm AG B 25 mm AG C 15 mm AG D 15 mm AG E 5 mm AG F 5 mm AG Blank test Linear (A 25 mm AG) Linear (B 25 mm AG) Linear (C 15 mm AG) Linear (D 15 mm AG) Linear (E 5 mm AG) Linear (F 5 mm AG) Linear (Blank test)Water loss·103 (kg)
19
The evaporation rate is given when the blank test result is subtracted from the mean water loss rate, resulting in Table 4.
Table 4. Results of the “RH adjusted runs” after correction for the blank test,
showing height of air gap, number of runs, mean evaporation rate and standard deviation.
Height of air gap (mm) Number of runs (n) Mean evaporation rate (kg/day) Sd
25 42 0.20 0.020
15 42 0.19 0.020
5 42 0.053 0.014
Comparison between mathematical model and Laboratory Study A
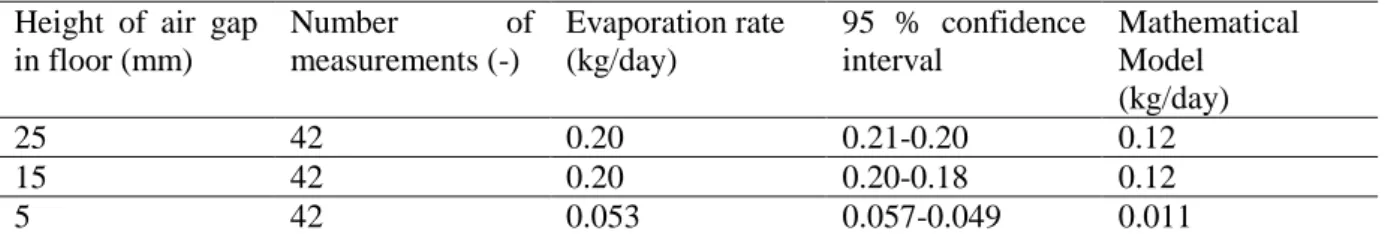
A comparison of the results from the mathematical model with those from the Laboratory study A, shows that the evaporation rate is considerably higher in the study. Both the calculated and the measured data show similar values for the 25 and 15 mm floor air gaps and much lower for the 5 mm gap, as shown in Table 5.Table 5. Measured and calculated evaporation rate for air gaps of different
heights.
Height of air gap in floor (mm) Number of measurements (-) Evaporation rate (kg/day) 95 % confidence interval Mathematical Model (kg/day) 25 42 0.20 0.21-0.20 0.12 15 42 0.20 0.20-0.18 0.12 5 42 0.053 0.057-0.049 0.011
Discussion: Comparison mathematical model and test rig
There are qualitative similarities when the results of the mathematical model are compared with the results of the Laboratory Study A. There is a large difference in evaporation rate between the 5 mm and 15 mm height of floor air gaps, but a very small difference when the height was increased to 25 mm.
The mathematical model assumes that the evaporation takes place from an open water surface and this was not the case in the Laboratory study A, where the evaporation took place from a wet gypsum board. The board has from a microscopic viewpoint a larger area with micro valleys and hills, whereas a water surface is completely flat in these circumstances.
20
4. Laboratory Study B
: Air velocity in the wall gap
Construction
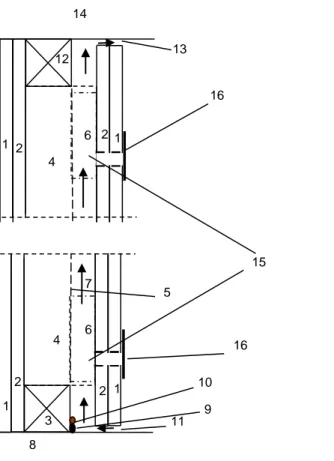
In this study the air velocity was measured together with temperature inside the wall air gap and the power of the heating cable. It is difficult to measure the slow air velocities involved so a special construction was build, consisting only of a wall section. This wall was 2.3 m high and the air gap measured 0.025 x 0.56 x 2.3 m, as shown in Figure 10. The inlets and outlets were 0.01 m in height.
Behind the air gap there were 0.095 m of insulation, one 12 mm OS-board and one 12 mm gypsum board. In front of the air gap there were one OS-board and one gypsum board. In the lower part of the air gap two heating cables with different powers were attached to the bottom sill, see Figure 10. Precautions were taken to keep the temperature in the room as constant as possible. In this room there were no windows, the lighting was minimal and the door kept closed during the tests.
Figure 10. Cross section of the test rig used in Laboratory Study B
1. Gypsum board 13 mm
2. Oriented strand board 13 mm
3. Bottom sill 45/70 mm
4. Stud 45/95mm
5. Mineral wool board surface
6. Cellular plastic-bar 30/25mm 7. Air-gap 8. Floor 9. T-18 heating cable 10. G-15 heating cable 11. Air inlet 12. Top sill 45/70 mm 13. Air outlet 14. Ceiling
15. Measurement point for T 16. Tape covering measurement hole
1 1 2 3 4 6 5 7 10 11 6 2 1 2 1 4 12 13 15 2 9 8 14 16 16
21
Heating cables
The cables attached to the bottom sill were of two different types, T-18 and G-15 giving different powers depending on the surrounding temperature. The heating cables were self-regulating and their surface temperature never exceeded 40 oC, so that the power depended on the temperature of the surrounding room. If the room temperature rose the power dropped. As the study was performed on two days with different room temperatures, the cables emitted different powers on these days, as shown in Table 6. As the temperatures were different on the two days, it was possible to perform six separate runs and two blank tests.
Table 6. Data for the two heating cables during the two days. lCab is the length of
the heating cable, U is the corresponding voltage, I is the amperage, qTot is the
total power of the cable and q is the power per meter.
Day Temp (oC)
Type of cable
lCab (m) U (V) I (A) qTot
(W) q (W/m) 1 15 T-18 6.0 217.5 0.43 93,3 15,5 1 15 G-15 5.8 217.5 0.18 39,5 6,8 1 15 Both 22.3 2 17 T-18 6.0 217.3 0.36 78.4 13,0 2 17 G-15 5.8 217.3 0.15 33.2 5,7 2 17 Both C 18.7
Measurements of temperature and air velocity
The temperature was measured under stationary conditions with Mitec thermi-stors at ten points in the air gap and at three points outside the wall. The results of one run are displayed in Figure 11 below.
The air velocity was measured with a hot wire anemometer TSI at the air inlet; see point 11, Figure 10. The anemometer registers air velocities down to 0.05 m/s.
Results: Temperature and air velocity
The rise in temperature due to the heating cable remains to 0.5-0-6 m, see Figure 11 and it is assumed that the surplus heat passes through the OS- and gypsum boards to the room. The difference in average temperature between the air gap and room leads to a difference in air density, which leads to an air flow through the system
22
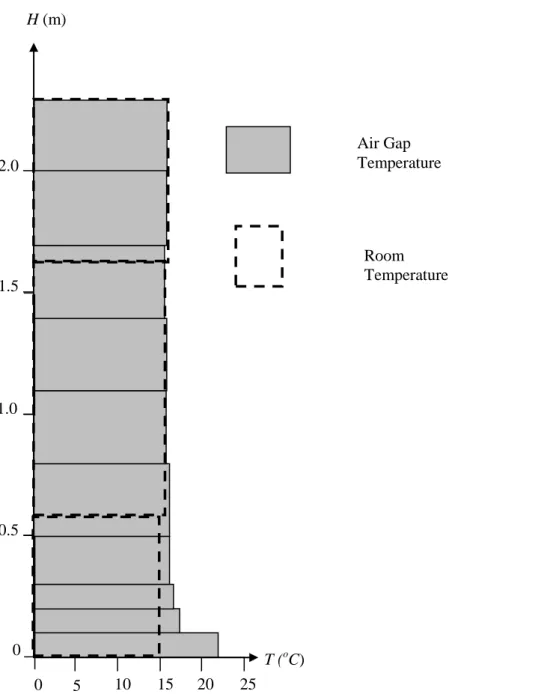
Figure 11. Laboratory Study B: Distribution of temperature inside wall air gap
(grey bars) and in room (dotted lines) according to test wall presented in Figure 10.
Here the temperature difference ∆T is defined as the average temperature inside the air gap minus the average temperature in the room. The air flow, calculated from the air velocity is plotted versus the temperature difference ΔT in Figure 12 and versus the power of the heating cable in Figure 13 for various experimental conditions. H (m) T (oC) Air Gap Temperature Room Temperature 0 5 10 15 20 25 0.5 1.0 1.5 2.0 0
23
Figure 12. Laboratory Study B: Air flow rate plotted against ∆T. The air flow was ca. 6∙10-4
m3/s and meter wall, which makes 50 m3/day and meter wall when the ΔT was as low as 0.2 o
C, and ca. 150 m3/day when ΔT is around 1 oC. This last flow was achieved with two heating cables of total 20 W/m. A flow less than 5∙10-4
m3/s could not be detected with this type of hot wire anemometer. -5 0 5 10 15 20 25 30 -0,2 0 0,2 0,4 0,6 0,8 1 1,2 1,4 No cable Day 1 G-15 Day 1 T-18 Day 1 Both cables Day 1 No cable Day 2 G-15 Day 2 T-18 Day 2 Both cables Day 2
Q∙104 (m3/s) per meter wall
24
Figure 13. Air flow rate versus power of heating cable. The line shows the result
of the mathematical model.
When the air flow rate is plotted against power of heating cable, as shown in Figure 13, the relationship is more linear than the of air flow rate against ΔT. The figure includes the line based on the mathematical model. In the experiment the wall air gap was 25 mm but the inlet and outlet was 10 mm. It is not possible to have an outlet of 10 mm with a wall air gap of 25 mm in the actual mathematical model. In the mathematical model the inlets and outlets have to be the same size as the air gap.
Discussion: Temperature and air velocity
This study was performed in a closed room without windows maintaining as stable circumstances as possible. This raises a question: “Is the heating cable necessary in an ordinary room with windows and a ventilating system?” An ordinary room gives temperature differences that create air flow in one direction or the other. If this is the case it would be important to have an air gap system in wall and floor connected to the room with inlets and outlets. ∆T needed to create an airflow is rather low, in fact down to 0.2 oC.
The power of a fan is given in SFP units (specific fan power, kW/(m3/s)), which may be understood as the power of the fan divided by the air flow. A lower SFP value indicates higher efficiency of the fan. In this case, if the cable of one meter gives 20 W the air flow will be ca. 2·10-3 m3/s and the SFP 10 kW/(m3/s). This may be compared with the SFP for an ordinary fan, which is ca. 3 kW/(m3/s).
0 5 10 15 20 25 30 35 40 45 50 0 10 20 30 No cable day 1 No cable day 2 G-15 day 1 G-15 day 2 T-18 day 1 T-18 day 2 Both cables day1
25
The heating cable is therefore very inefficient, but the advantage is that it creates a flow over the entire width of the wall. It is also silent and has no moving parts that can be broken.
26
5. Fullscale Study A
:
Drying of floor on top of a slab
There are obvious problems with fullscale studies. They are difficult to repeat as the external conditions change from test to test and there are often parameters changing contemporaneously that are hard to separate and thus it is difficult to calculate the importance of a single parameter.
The advantage of such studies is that it is possible to get an understanding of whether or not a certain method is feasible. It is also important to show to the public that the method works in ordinary conditions. For the Air Gap Method, two full scale studies have been performed. Firstly to study how to dry out a water damaged floor on top of a slab and secondly how to dry out a flooded intermediate floor.
Background
Swedish small detached houses built 1960-90
Small detached houses in Sweden, between 1960 and 1990 often used an insulated floor construction on top of a concrete slab. This is considered to be a risk construction (Harderup 1991) because water may enter the construction both from the ground through the slab and as regular water damage from above. During this period, more than 800 000 houses with this construction were built in Sweden (Ström et al 2005). The room in this study could be a bathroom in a house from this period. When water damage occurs in such a room, the wall facings and flooring are torn down and the room is dried during a period of 6-8 weeks. A new bathroom is then built.
General Construction
The tests were performed in two rooms, measuring 2.75x2.25 meter (6 m2), with 2.3 meter height to ceiling, schematic cross sections are shown in Figures 14 and 15. The heating cable was of type T-18, placed low in the vertical air gap. The concrete slabs, 0.1 m thick, were cast with PE film under the bottom and around the its sides in both rooms. Joists were placed on supports on top of the slab and mineral insulation was placed between the joists, with an air gap on top beneath the floor boards.
In this construction the main air movement shall take place in the air gap above the insulation. The assumption is that water molecules pass through the insulation by diffusion and will be transported from the floor construction by the air gap system.
27
Figure 14. Cross section of the Air Gap construction, used in the Fullscale
Study A for drying a wet concrete slab.
Studies
Three different studies were performed in these rooms. The first to measure RH inside the floor construction, the second was to examine how the dampness was driven out of the air gap construction. In the third study, the water content in the slab was recorded. An attempt was also made to measure the air velocity by the inlet, but it was not possible to obtain stable results.
RH and mould inside the floor construction
The presumption is that the Air Gap Method manages to dry out a humid concrete slab, while the room is being used. Mould may grow at the lower surfaces of the floor joists where there is a high RH caused by the dampness in the slab and the slow air ventilation through the mineral wool insulation. Some of the floor joist supports and also some of the joists were therefore covered with a concrete suspension. It has been reported that mould has difficulty in grazing on such a surface and also that mould not usually grows upon stone wool insulation (Must A. IVL, Aimex personal communication 2007). Cellular
1. Gypsum board 13 mm 2. Oriented strand board 13 mm 3. Bottom sill 45/45 mm 4. Stud 45/70mm
5. Mineral wool board surface 6. Cellular plastic-bar 30/25mm 7. Air gap
8. Chipboard
9. Heating cable T-18 10. Gap in chipboard
11. Mineral wool board insulation 12. Exterior wall
13. Top plate 14. Air outlet 15. Air inlet 16. Concrete slab
17. Lower surface of floor joist 18. Support of floor joist 19. Poly ethylene foil
9 5 1 2 4 6 7 8 10 11 7 7 16 14 15 12 6 17 18 2 1 3 13 19
28
plastic is avoided as this type of insulation is not allowing air flow through the material. The RH was measured in the floor air gap and in the surrounding rooms, during two months by a Vaisala humidity and temperature probe HMP76B. Tape samples were taken at joists and supports for mould investiga-tions by Aimex
Figure 15. Floor/wall constructions built by in traditional way (above) and by
the Air Gap Method (below). In this study the RH values inside the floor con-structions were compared.
Heating cable
Vapor barrier Chipboard
Wall boards
Mineral wool insulation
Concrete slab
29
Figure 16. RH as function of time in floor constructions shown in Figure 15.
Results: RH and mould in floor constructions
This study was performed over a period of 54 days during the summertime. The results in Figure 16 show that the RH was higher than 75 % for more than 20 days in the ordinary floor construction, with a considerable risk of mould growth (Sedlbauer 2001). In the floor construction built with the Air Gap Method, the
RH was below 75 % throughout the test period.
The humidity could however have been higher below the mineral wool insulation by the joists as the RH was recorded in the air gap just below the floor board. The joists and supports in the Air Gap construction that were not treated with concrete suspension showed a rich growth of mould (Ulocladium sp,
Altenaria sp and Acremonium sp). In the ordinary construction the mould
species were Cladosporium sp, Penicillium sp as well as a bacteria growth. When the construction parts were covered with concrete suspension no mould or bacterial growth were observed.
Moisture transport out of the Air Gap Construction
This study was performed in the Air Gap construction presented in Figures 14 and 17. The supposition was that the air enters at the inlet, see arrow A in Figure 17, passes through the air gaps of floor and wall and exits by the outlet, arrow L. The moisture content should increase in the air flow direction inside the floor air gap and be constant inside the wall air gap, if this supposition is correct. The
0 10 20 30 40 50 60 70 80 90 100 0 10 20 30 40 50 60
RH below air gap floor RH below ref. floor RH in ref. room RH in air gap room
RH (%)
30
study RH and temperature were measured with the combined RH and tempera-ture meter Vaisala HM 70 at the points indicated in Figure 17.
Figure 17. Measurement points used to study the moisture transport out of the
Air Gap construction.
Results: The water transport out of the Air Gap Construction
The study was performed over a period of 54 days during the summer time. The air velocity was too low to be safely detected by a hot wire anemometer. The RH and temperature were recorded at the points A-L as well as in the room and the moisture contents were then calculated. The difference in the moisture content (∆M) at each measuring point with respect to the inlet (point A) as reference value was then calculated. Results are presented in Figure 18 for day 28 and in Figure 19 for all the study for point K (according to Figure 17).
G
Polyethylene film
Chipboard Air flow in Air gap Wall boards
Insulation
Concrete slab
Air gap measuring point K J L I H F E D C B A Heating cable Room
31
Figure 18. Difference in moisture content ∆M with respect to the inlet value (A)
during the 28th day after water damage measured at the points, indicated in Figure 17.
The results in Figure 18 show that the moisture content rises from the air inlet as the air passes through the floor construction and remains constant as the air rises through the wall construction and this confirms the supposition presented earli-er. The moisture content was noticed to be lower at the air outlet, presumably because the air at this point had already been mixed with the room air. Hence the amount of water transported out of the system was assumed to be equal to the difference in moisture concentration of the outgoing air at point K and the ingoing air at point A (∆MK), multiplied by the air flow rate .
. 0 0,5 1 1,5 2 2,5 1 2 3 4 5 6 7 8 9 10 11 12 13 Series1 g/m3 luft Place Room A Air inlet B Floor 25 cm C Floor 75 cm D Floor 125 cm E Floor 175 cm F Floor 225 cm G Wall 20 cm H Wall 70 cm I Wall 120 cm J Wall 170 cm K Wall 220 Air Outlet ∆ M: Day 28
32
Figure 19. ΔMK, the difference between the moisture concentration at point K
and that at A, as a function of time.
On average with an air flow of 40 m3/day and meter wall in a room 2.25 m wide, more than 0.1 kg water per day on average will leave the floor construc-tion through the air gap. During 54 days, ca. 6 kg of water will be removed.
0 0,5 1 1,5 2 2,5 3 0 10 20 30 40 50 60
Moisture addition at point K
Days
Δ Moisture content (g/m3)
33
Dampness in concrete slabs
This study was run during 57 days in the same Air Gap and ordinary construc-tions as described in the fullscale studies above. A RH and temperature detector, Vaisala Intercap Humidity and Temperature Probe HMP5, were placed in each concrete slab, see Figures 20 and 21.
Figure 20. RH and temperature detector placed in concrete slab in ordinary
construction.
Figure 21. RH and temperature detector placed in concrete slab in Air Gap
construction
Vapor barrier Chipboard Air flow in Air gap Wall boards Insulation Concrete slab
Slab measuring point Heating cable
Vapor barrier Chipboard
Wall boards
Mineral wool board insulation
Concrete slab
34
Results: Dampness in concrete slabs
With the Air Gap Method the concrete slab was dried out faster when than from the ordinary slab. In the Air Gap construction the RH was below 90 % after 25 days and below 85 % at 57 days, compared with the ordinary construction, where RH never reached below 85 % during this period, see Figure 22. The 85 % limit is important since it is possible to build upon a slab when the RH is below this limit (Johansson 2003) as the risk of mould growth is negligible below this limit.
Figure 22. RH in concrete slabs in the two constructions as a function of time.
RH in slab Days 80 85 90 95 100 0 10 20 30 40 50 60
Ordinary floor construction
35
Figure 23. The desorption isotherm for concrete K 40. The points “A” and “B”
indicate the dry out level reached in A the ordinary floor and in B the air gap system respectively after 57 days.
Figure 23 (Nevander and Elmarsson 1994) shows a sorption isotherm for water in a concrete K 40, which is similar to the concrete used in the present study. According to this curve, one cubic meter of concrete contains ca. 102 kg of wa-ter at 92 % RH and ca. 89 kg of wawa-ter at 85 % RH. Since the volume of the slabs contains approximately 0.6 m3, the air gap system is thus calculated to succeed in evaporating ca. 8 kg more during this period, than the ordinary built system. This is to be compared with the results from “Moisture transport out of the Air Gap Construction” where the estimated transport by the air gaps was ca. 6kg.
92 85 102 89 A B Mass water in concrete (kg/m3)
RH % 100 100 50 50 0
36
6. Fullscale Study B
:
Drying of intermediate floor
This study has investigated what happens in an intermediate floor construction, built by the Air Gap Method, when it is flooded with domestic wastewater. This type of damage may occur by a sudden collapse of a sewer system or of an aquarium.
Construction
The intermediate construction is an ordinary construction type built on joists, as shown in Figure 24 which presents a cross section of the construction from two directions. There are two ways of introducing an air gap into this type of floor construction The first lies between the joists above the insulation and has an air inlet in the floor/wall angle. The second lies between the boards of the spaced panel below the joists and above the ceiling gypsum boards with an inlet situated in the ceiling/wall angle which also acts as a drainage opening for flooding water.
The first air gap goes to walls perpendicular to the joists through the floor boards and the air outlet is situated in the angle of the wall and the upper ceiling. The second air gap goes through the floor insulation, floor boards and wall when the wall is parallel to the joists. The wall construction is described above in “Laboratory Study B”, see also Figures 24 and 25. The heating cables were of type G-15, for which the power was said to be 8 +- 2 W/m.
37
Figure 24. Sketch showing Air Gap Method built into an intermediate floor
con-struction, wall perpendicular to joist.
Figure 25. Sketch showing Air Gap Method built into an intermediate floor
con-struction, wall parallel to joists.
.
3
1. Gypsum wallboard 13 mm 2. Oriented strand board 13 mm 3. Bottom sill 45/95 mm 4. Stud 45/120mm
5. Mineral wool board surface 6. Cellular plastic-bar 30/25mm 7. Air-gap in wall 8. Chipboard 9. Heating cable G-15 10. Slit in floor 11. Floor joist
12. Mineral wool in floor 13. Spaced boarding
14. Air inlet by slit at outer wall 15. Air-gap above mineral wool 16. Outer wall
17. Measurement point (a pair of screws) 18. Air-gap in spaced boarding
17 9 5 1 3 15 8 8 12 12 16 11 11 14 1 1 2 2 4 8 6 10 7 13 18 13 1. Gypsum board 13 mm 2. Oriented strand board 13 mm 3. Bottom sill 45/45 mm 4. Stud 45/70mm
5. Mineral wool board surface 6. Cellular plastic-bar 30/25mm 7. Air-gap 8. Chipboard 9. Heating cables G-15 10. Slit in chipboard 11. Floor joist
12. Mineral wool insulation 13. Air-gap in spaced boarding 14. Outer wall
15. Ceiling board 16. Inlet of air 17. Skirting
18. Air-gap above mineral wool
1 2 2 1 3 4 8 6 9 5 10 11 13 7 7 14 15 16 12 18 17
38
Study
This study was performed in a 24 m2 room, as four separate experiments during summertime, but the RH was different in each run. 120 liters of domestic water were poured into the construction through two holes, 60 liters in each hole. As the construction was drained, 90-105 liters went directly through the floor. Moisture ratios (by MMM scale) were registered by Moisture ratio meter Sur-veymaster SM at 98 points during each experimental period. During the first period two heating cables were in operation, during the second and third periods, one cable was in operation and during the last period, no cable was in operation. Samples for mould growth were taken after each experiment at the most humid places. During this type of experiment, evaporation occurred from the underside of the ceiling board, but this evaporation due to air movement and RH in room has not been estimated.
39
Figure 26. Above left: The author standing in front of the room used in
Fullscale Study B. Above right: Cross section of the intermediate construction, point 17 shows a measurement point. Below left: Plan of room used in Fullscale Study B, the floor area was at about 24 m2, the blue points show where water was poured into the construction. Below right: The crosses show where the measurement points were placed.
Results: Drying of intermediate floor
Drainage: Between 90 and105 liters drained out and were collected from the air inlet situated at the S 7 line in Figure 26 below right, see also point 16 in Figure 25. The remaining moisture after drainage was followed at the measurement points in the spaced boarding and recorded by the moisture ratio meter. The results are given as maps showing iso-humidity lines, where one example is displayed in Figure 27. 3 2 S7 S 1 S 2 S 3 S 5 17 9 5 1 3 1 5
40
Figure 27. Map showing iso-humidity lines, the third day after flooding.
The wettest point was situated at the crossing S2/12 and the process of damp-ness removal could be followed in all four experiments, see Figure 28. The floor construction was dry after eight days when two heating cables were switched on and after 12 and 13 days during experiment 2 and 3 respectively with one cable switched on. During the last of the four experiments, with no cable switched on, it took 21 days before the total construction was completely dry. No mould growth was registered during the first three experiments, but during the last, with no cable operating, there were a growth of Acremonium sp and
Clado-sporium sp.
1
2
3
4
5
6
7
8
9 10 11 12 13 14
S1
S2
S3
S4
S5
S6
S7
Experiment C D a y 3
90-100
80-90
70-80
60-70
50-60
40-50
30-40
20-30
10-20
0-10
41
The difference in drying capacity could be due to the heating cables, but it is also a fact that the RH in room was low during the first experiment and increa-sed during the other experiments. It was not possible to determine exactly how much water that was drained out in each experiment.
Figure 28. Drying performances at point S2/12, see Figure 27, versus time, in
the four experiments.
Discussion: Drying of intermediate floor
This second fullscale study showed that this intermediate floor construction did not become totally wet as a result of a flood, see Figure 28. Furthermore the dry-ing process seemed to go faster with a heatdry-ing cable bedry-ing turned on. If this con-struction had been built without air gaps and inlets, it can be assumed that the drying process would have been remarkably longer.
According to the mathematical model the maximum drying capacity for both the air gap systems, see Figures 24 and 25 would be 12.6 liters/day with two cables operating and 10.5 liters/day with one cable in operation. This is with the assumption that the whole surface was totally wet, which was not in fact the case, see Figure 27.
0 20 40 60 80 100 0 5 10 15 20 25 A1 2 heating cables A2 One heating cable A3 One heating cable A4 No heating cable
Days % MMM scale
42
7. Discussion
The Air Gap Method is useful in new buildings, the method could be a part in a strategy for building in a robust way. While renovating a water damaged house, the Air Gap Method makes it possible to dry out such damage without a separate drying period. The inhabitants could for instance be able to use a renovated water damaged kitchen 6-8 weeks earlier than with ordinary building concepts. The renovated house will also be more robust against such damages afterwards.
Application of the mathematical model
Table 5 presents values calculated from the mathematical model, presented in paper V, for different building constructions. This model assumes however that the bottom of the air gap is a water surface and this is not so of regular water damage.
Table 5. Performance of different Air Gap Method constructions in fully
deve-loped water damage. The air gap heights are 25 mm and the air temperature in the room and at the inlet are set to be 20 oC. Tf = Temperature at the transition
from floor air gap to wall air gap. RHf = RH at the transition from floor air gap
to wall air gap. Q = Air flow (m3/day) υ = evaporation rate.
Construction Floor length Floor width Wall height Tf o C RHf (%) Q (m 3 /day) υ (g/day) L test rig 1.41 0.205 1.89 17.4 89 26 120 L 1 m 1.41 1 1.89 17.4 88 130 580 L 1x 2.3 m 1.41 1 2.3 17.4 89 120 560 Floor/Wall a 4 1 2.3 18.5 95 180 1100 Floor/Wall b 6 1 2.3 19 97 200 1400 Floor/Wall c 8 1 2.3 19.4 98 210 1550
When room air goes through the air gap, the RH will rise and simultaneously its temperature will sink. There is also a heat transport to the air gap to compensate for this cooling process and the air gap temperature will gradually approach to the surrounding room’s temperature. As the air gap temperature by the floor/-wall transition rises, the air flow will also rise.
The results from Laboratory Study A showed higher evaporation rate than the mathematical model and there is also an ordinary water transport from a water damage construction, especially from an intermediate floor shown in Figures 24 and 25 above. It is believable that the drying processes are faster in reality, compared to the model.
The result from the mathematical model shown in Figure 5 indicates that it is possible to get a good function from a rather long air gap. This is believable
43
according to the result of fullscale study B as shown in Figure 28, where the floor air gap was 25 mm high and more than 4 m long.
However the inlets and outlets were only 10 mm wide, in the two fullscale studies, while they are 25 mm in the mathematical model and in Laboratory Study A. This reduction to 10 mm may however be more investigated according to Figure 4, showing that 10 mm is in the middle of the turning point.
44
8. Conclusions
A house built by the Air Gap Method is more resistant to water damage and mould growth, because the Method causes an air flow through a building construction. In the submitted papers included in this thesis a number of conclusions are presented. The most important are:
The magnitude of the air flow and drying rate inside an Air Gap Method construction can be calculated by a mathematical model for rooms of different sizes.
There is an optimal height of the floor air gap between 15 and 25 mm, according to method study.
The air flow has been measured, in an Air Gap wall construction, to be between 50 and 140 m3/ meter wall, day, depending of the power of heating cable, between 5.7 to 22.3 W/m.
A temperature difference between the vertical air gap and the room of 0.2-0.3 oC results in an air flow of approximately 50 m3 /meter wall, day.
The Method managed to dry out a flooded intermediate floor construction, which was drained, in 13 days.
The Method prevented all mould from growing in the above mentioned flooded intermediate floor construction when the indoor RH was below 65 %.
The Method succeeded in drying out water from a concrete slab beneath an insulated construction.
The Method succeeded in lowering the RH in the construction air inside the air gaps.
45
9. Implementation of the Air Gap Method
This section will describe experiences and notations related to implementation of the Air Gap Method.
The Air Gap Method built into a small house
The Air Gap Method has been mounted into a detached one-and-a-half story house loose timber located at Lidingö outside Stockholm, see Figure 29. The house was built with an insulated slab on the ground (Harderup 1991), equipped with hot water piping in the slab for underfloor heating. The concrete slab was polished and functions as the ground floor surface. A floor drain was installed in the slab floor of the kitchen, to provide protection for water damage.
The Air Gap System was built into the intermediate floor (as described in Figures 24 and 25) and in all walls with water tubes and sewers as bathroom, laundry room and kitchen. The air gaps in the external walls were built between gypsum and OS boards with a width of 12 mm.
Figure 29. Small house built with Air Gap Method inside. This picture shows a
half-finished house, the roof is now covered with tiles.
The house was built in 2005, before the Air Gap Method had been properly in-vestigated and it was therefore decided to close all inlets and outlets during the finish period. However all the air gaps and heating cables are mounted inside the structure. If water damage occurs it is possible to open the inlets and outlets, to switch on the heating cable and to dry out the dampness.
46
Basis for Economical discussion
This work was followed by an experienced project engineer, who made calculations of the material costs and working hours by lead times in the building trade. These calculations have three assumptions:
1. The house was a loose timber house; it ought to be cheaper to build a prefabricated house.
2. It was the first house incorporating by the Air Gap Method. The following houses should be cheaper to build.
3. The actual building hours are included in the calculation. No overheads, profit or risk were calculated.
The calculation was made by Tord af Klintberg together with Conny Bergström JM, 14 February 2006.
Extra costs
Work Hours
Drilling holes in floor 600 items 2
Mounting electric cable 6 items 1
Mounting heating cable 60 m 2
Cutting of insulation inside intermediate floor construction 30 m 2,5
Mounting of spacers in external walls 2,5
Mounting of keepers for insulation 5
Mounting of distances below gypsum and OS- boards 2
Total 17
Extra Material
CostsElectrical cables 500
Heating cables 3 000
Preparation costs for heating cable 1 600
External wall spacers 500
Bottom spacers 500
Insulation keepers 1 500
Total 7 600
Savings
Work Hours
Less drilling for electric cables 1
Material
47
Conclusion
With a working cost of SEK 400/hour, the overall cost will be 6 400+ 7 600 = SEK 14 000 to install the Air Gap Method in the whole house. If the savings are taken into consideration, the cost will be ca. SEK 12 000.
The damage
The house was built during the autumn of 2005, which was dry and warm. There was only one rainstorm before the roof was set and the external walls on place. Hence it was a very dry house that was almost finished in January 2006 and the Air Gap Method was not needed to dry out the construction.
However, an accident happened when the tap water was connected. The connection broke and water sprinkled the kitchen for ca. 90 minutes as the plumber had gone for lunch. Most of the water went through the floor drain, some went through the external wall below the bottom sill and caused ice banks outside the house. Some of the water also went into the external wall behind the kitchen cabinet. This dampness was detectable by a moisture ratio meter (Sur-veymaster SM” from Protimeter plc, England.) showing higher values for about 2 m2 on the external wall. The owners chose to rely on the Air Gap Method, not tearing down the wall. The drying out process was followed by the moisture ratio meter and within a month no dampness could be detected inside the wall.
48
Sifo survey
NCC investigated the market for “a building system making constructions robust towards water damage” The query was posed as follows:
*To whom it may concern:
If the house supplier were able to offer his customers a choice in the form of a complete new building system which costs approx. SEK 30 000, and which can prevent large-scale water damage in the event of an accident such as a leaking aquarium or water running from the refrigerator/freezer if there is a power fai-lure while you are away – the system would mean that the damage would be less and it would be easier and quicker to deal with it if an accident did occur – how interested would you be in installing this choice if you were to buy a new house? 1. Not interested at all 15
2. . . . 19 3. . . . 27 4. . . . 21 5. Very interested 13 Doubtful, don’t know 4 Mean value 3.0
I hereby certify that the above question was included in a SIFO-investigation which NCC carried out in 2007.
Solna, 29 August 2009
(signed) Peter Wahlström, NCC
Dust inside the air gaps
What will happen if dust goes into the air gaps, blocking the air gap system? It is quite possible that dust could go from a dusty floor into the inlet of an air gap at point 14 in Figure 24. However the air velocity should be much higher in the opposite direction if the floor/wall angle would be vacuumed.
The company InWall has built bath rooms with an air gap system with inlets under the threshold for more than 15 years. This company has investigated their old air gap systems with a fiber optic camera and found the air gap system dry and clean (Tjulander H. 2011), but this has not been scientifically investigated. *This text is a certified translation of the Swedish document. This is done by Dr. Anthony Bristow.
49
10. Future work:
Strategy for the Robust house
Water damage has been a great problem to house owners since the 60s and it would be desirable to create a strategy for a robust house according to water damage. All over Europe, there exist a significant number of buildings that need to be renovated to achieve energy savings consistent with the European goals for reduced energy consumption in the built environment. Some of these buildings are damaged by moisture, e.g. caused by different types of water leakage in the construction, flooding and heavy rain, which can be more common in the future because of climate changes.
When water penetrates a construction, which is quite possible during the lifetime of a building, the building materials in question should not be easily damaged by mould. It should further be possible for any water to easily leave the construc-tion. This will result in buildings being robust against water damage.
Moisture robustness is intended to be achieved by the following four principles: 1: Safe installations
2: Air gaps
3: Robust materials 4: Warning systems
A future strategy for the robust house should involve expertise from the domains of building materials, building services and building technology to investigate the development of different types of renovation systems that are more robust against moisture-/water damage. In this context also economic aspects of reno-vation and maintenance should be involved.