New Diabetes Questionnaire to add
patients’ perspectives to diabetes care
for adults with type 1 and type 2
diabetes: nationwide cross- sectional
study of construct validity assessing
associations with generic health- related
quality of life and clinical variables
Maria Svedbo Engström ,1,2 Janeth Leksell ,1,3 Unn- Britt Johansson ,4,5
Sixten Borg ,6 Bo Palaszewski ,7 Stefan Franzén,8 Soffia Gudbjörnsdottir,2,8 Katarina Eeg- Olofsson 2,9
To cite: Svedbo Engström M, Leksell J, Johansson U- B, et al. New Diabetes Questionnaire to add patients’ perspectives to diabetes care for adults with type 1 and type 2 diabetes: nationwide cross- sectional study of construct validity assessing associations with generic health- related quality of life and clinical variables. BMJ Open 2020;10:e038966. doi:10.1136/ bmjopen-2020-038966 ►Prepublication history and supplemental file for this paper is available online. To view these files, please visit the journal online (http:// dx. doi. org/ 10. 1136/ bmjopen- 2020- 038966). Received 31 March 2020 Revised 13 July 2020 Accepted 09 October 2020
For numbered affiliations see end of article.
Correspondence to Dr Maria Svedbo Engström; msd@ du. se
© Author(s) (or their employer(s)) 2020. Re- use permitted under CC BY- NC. No commercial re- use. See rights and permissions. Published by BMJ.
ABSTRACT
Objectives To study evidence for construct validity,
the aim was to describe the outcome from the recently developed Diabetes Questionnaire, assess the associations of that outcome with clinical variables and generic health- related quality of life, and study the sensitivity to differences between clinically relevant groups of glycaemic control in adults with type 1 and type 2 diabetes in a nation- wide setting.
Design Cross- sectional survey.
Setting Swedish diabetes care clinics connected to the
National Diabetes Register (NDR).
Participants Among 2479 adults with type 1 diabetes
and 2469 with type 2 diabetes selected at random from the NDR, 1373 (55.4%) with type 1 and 1353 (54.8%) with type 2 diabetes chose to participate.
Outcome measures The Diabetes Questionnaire, the
generic 36- item Short Form version 2 (SF- 36v2) health survey and clinical variables.
Results Related to the prespecified assumptions,
supporting evidence for construct validity for the Diabetes Questionnaire was found. Supporting divergent validity, the statistically significant correlations with the clinical variables were few and weak. In relation to the SF- 36v2 and in support of convergent validity, the strongest correlations were seen in the Diabetes Questionnaire scales General Well- being and Mood and Energy. In those scales, machine learning analyses showed that about 40%–45% of the variance was explained by the SF- 36v2 results and clinical variables. In multiple regression analyses among three groups with differing levels of glycated haemoglobin adjusted for demographics, other risk factors, and diabetes complications, the high- risk group had, in support of sensitivity to clinically relevant groups, statistically significant lower scores than the well- controlled group in most Diabetes Questionnaire scales.
Conclusions This nation- wide study shows that the
Diabetes Questionnaire captures some generic health-
related quality- of- life dimensions, in addition to adding diabetes- specific information not covered by the SF- 36v2 and clinical variables. The Diabetes Questionnaire is also sensitive to differences between clinically relevant groups of glycaemic control.
INTRODUCTION
Everyday life with diabetes as an adult is a complex challenge. Diabetes makes
indi-viduals responsible for self- management
to avoid serious short- term and long- term complications, while balancing self- perceived health and well- being in the present as well as in the future.1–6 To support skills for self- management is a central task of diabetes care, and the individual patient’s prerequisites, wishes and available evidence must be taken into account.1 4–6 An important step for the
Strengths and limitations of this study
► The cross- sectional study used a large,
heteroge-neous nationwide sample of adults with type 1 di-abetes and adults with type 2 didi-abetes selected at random.
► Respondents were representative of the 2015
pop-ulation in the Swedish National Diabetes Register.
► The Diabetes Questionnaire scales scores were
re-lated to relevant clinical variables and a well- known and often recommended measure of generic health- related quality of life.
► The analyses were limited to the respondents and
might reflect a group with greater motivation for participation.
► The questionnaires were only offered in Swedish.
on November 18, 2020 by guest. Protected by copyright.
Swedish National Diabetes Register (NDR) has therefore been to broaden healthcare provider perspectives and enable a systematic collection of adults’ perspectives of living with diabetes and their experiences of whether they are offered adequate support from diabetes care.7–10 The newly developed Diabetes Questionnaire is intended to support meetings with individuals and provide a means for quality improvement at the local, regional and national levels.7–9
The Diabetes Questionnaire was developed from inter-views with adults with type 1 or type 2 diabetes that iden-tified a broad range of aspects important to the target group, such as well- being, impact on daily life,
capabili-ties to manage diabetes and support from diabetes care.9
In line with Sen’s capability approach,11 12 the Diabetes Questionnaire focuses on the individual’s opportunities, prerequisites and possible barriers to live a good life with diabetes.7–9 Supporting evidence for content validity, face validity and ease of items understandability and
answer-ability has been presented.8 9 In addition, supporting
evidence for test–retest reliability and that the scales can be used for comparison between men and women, between different age groups, and, for most scales, between type 1 and type 2 diabetes have been provided.7 8 Furthermore, the scales can detect differences between clinically relevant subgroups, such as diabetes type,
diabetes treatment, age group and gender.7 We have also
begun to study the associations with clinical variables by showing low individual- level correlations with glycated
haemoglobin (HbA1c), systolic blood pressure (SBP) and
low- density lipoprotein (LDL) cholesterol.7
This study adds to previous work and reports on an extended analysis of the evidence for construct validity. Construct validity concerns the confidence that a ques-tionnaire captures the construct it was intended to
measure.13 It is a measurement property that involves a
complex process using a variety of techniques studying differences between relevant groups and prespecified assumptions of logical relationships to scores of a range
of other measures and patient characteristics.13 14 The
assumptions can postulate which aspects are expected to be related to each other, presenting evidence for convergent validity, and which aspects are expected to be relatively unrelated, supporting evidence for
divergent, also known as discriminant, validity.13 For
this work, we chose to focus on differences between
subgroups of glycaemic control as measured by HbA1c
and the relations to clinical variables relevant for
diabetes care and an often- recommended generic
measure of health- related quality of life, the 36- item Short Form version 2 (SF- 36v2) health survey. To study evidence for construct validity, the aim was to describe the outcome from the Diabetes Questionnaire, to assess the associations of that outcome with clinical variables and generic health- related quality of life, and to study the sensitivity to differences between clinically relevant groups of glycaemic control in adults with type 1 and type 2 diabetes in a nationwide setting.
METHODS
Sample and data-collection
In this cross- sectional survey, 2479 adults with type 1 diabetes and 2469 with type 2 diabetes were selected at random without replacement from the Swedish NDR. Eligibility criteria were being alive, 18–80 years of age, and recorded in the NDR during the period from 30 September 2014 to 1 October 2015 with at least one
recorded test of HbA1c level during the previous 12
months. With these criteria, 29 245 adults with type 1 diabetes at hospital outpatient clinics and 208 852 adults with type 2 diabetes at primary healthcare centres were eligible for recruitment. In the data collection phase, we aimed at a sample size allowing for subgroup analyses.
The Diabetes Questionnaire, the SF- 36v2 survey, and a prepaid return envelope were sent by email in October 2015 to survey selectees and again to non- respondents
after 30 days.7 15 Both questionnaires were answered by
1373 (55.4%) individuals with type 1 diabetes and 1353 (54.8%) with type 2 diabetes.15 With small differences in response rate depending on the questionnaires in ques-tion, the sample has been described as previously focusing
on the scale development of the Diabetes Questionnaire7
and separate analyses of the SF- 36v2 data.15 Age, sex and clinical variables (diabetes type defined by clinical diag-nosis, diabetes duration, HbA1c level, cardiovascular risk factors, complications, physical activity level and receipt of medical treatment) recorded because of their rele-vance to high- quality diabetes care were collected from the NDR.
Diabetes Questionnaire
The Diabetes Questionnaire is a 33- item self- reporting questionnaire having a total of 12 scales divided into two main parts.7 8 Part 1 has 22 items on eight scales and acts as a patient- reported outcome measure (PROM). These scales are General Wellbeing (GenW), Mood and Energy (MoE), Free of Worries about blood sugar (FreW), Capa-bilities to Manage your Diabetes (ManD), Diet and Exer-cise (DiEx), Not Limited by Diabetes (NLD), Not Limited by Blood Sugar (NLBS) and Support from Others (SuO). Part 2 is an 11- item patient- reported experience measure (PREM) with four scales. Those scales are Support from Diabetes Care (SuDC), Access to Diabetes Care (AcDC), Continuity in Diabetes Care (CoDC) and Medical Devices and Medical Treatment (MDMT). All scales are scored from 0 to 100, with higher scores representing the more desirable outcome. The scales ManD, NLBS and MDMT are specific to diabetes type.7
SF-36v2 survey
The SF- 36v2 survey is a self- reporting questionnaire for generic health- related quality of life with support for its validity and reliability in overall populations, such as people with diabetes.3 16–20 We used the self- administered standard form in Swedish and software from Quali-tyMetric. The eight domains produced are physical functioning (PF); role- physical, that is role limitations
on November 18, 2020 by guest. Protected by copyright.
due to physical health problems; bodily pain; general health (GH); vitality (VT); social functioning (SF); role- emotional, that is role limitations due to mental health problems; and mental health (MH). The domains are scored from 0 to 100. Higher scores indicate a better general health- related quality of life.16 17
Prespecified assumptions
As the Diabetes Questionnaire is intended to measure patient perspectives on how they feel, how their diabetes treatment is going and their experiences of support from diabetes care, the prespecified assumptions for
correla-tions with clinical variables and the SF- 36v2 were as
follows:
► Based on clinical experience, it was proposed that, in
support of divergent validity, a small number of nega-tive and weak correlations would be found between the Diabetes Questionnaire scales and the clinical vari-ables, mostly related to the HbA1c level. There would be no correlations with SBP and LDL cholesterol.
► Based on examinations of the content in the two
questionnaires, it was proposed that in support of convergent validity, the Diabetes Questionnaire PROM scales GenW, MoE, FreW, ManD, DiEx, NLD and NLBS would have more and stronger correla-tions to the SF- 36v2 domains, as compared with the PROM scale SuO and the PREM scales (SuDC, AcDC, CoDC and MDMT). Observed correlations would be positive, with the strongest in GenW and MoE. In support of divergent validity strong correlations were not expected across the other scales. Correlations ≥0.60 were considered as very strong, 0.50 to <0.60 as strong, 0.40 to <0.50 as moderate and <0.40 as weak.
Statistical analysis
The data for participants with type 1 and type 2 diabetes were analysed separately. The descriptive statistics for each variable are based on non- missing observations. The continuous variables are given as means and SD for normal distributions and as medians and IQRs for skewed distributions. The categorical variables are presented as numbers and percentages. The generation of scale scores from the Diabetes Questionnaire is described
in detail elsewhere.7 The SF- 36v2 domain scores were
generated using the manual and licensed software from QualityMetric.17
In relation to the prespecified assumptions, Spearman’s rank correlation was used to study the monoton associa-tions between the Diabetes Questionnaire scale scores and the clinical variables age, diabetes duration, HbA1c level, body mass index (BMI), LDL cholesterol and SBP, as well as between the scores from the Diabetes Questionnaire scales and the SF- 36v2 domains. To broaden the analysis, machine learning using random forests was conducted to investigate non- linear associations between the Diabetes Questionnaire scales and the SF- 36v2 domains together with clinical variables (age, sex, diabetes duration, HbA1c level, BMI, LDL cholesterol and SBP). Random forest is
a general tree- based regression and classification method that uses bootstrapping to create a large number of regressions of classification trees that are combined to
produce a model prediction.21 The use of a large number
of trees allows the model to depict non- linear associations without the need to prespecify these in a model, while
at the same time guarding against overfit.21 First, the
variance in all Diabetes Questionnaire scales was exam-ined in relation to the SF- 36v2 domains and the clinical variables together. Next, the variable importance of the SF- 36v2 domains and the clinical variables as predictors of the PROM scales GenW and MoE were examined. We
also examined the percent variance in HbA1c explained
by another clinical variable, the Diabetes Questionnaire scales, and the SF- 36v2 domains together. The results are given as percent of the total variance. Each model contained 1000 trees.
To study the sensitivity of the Diabetes Questionnaire scales to clinically relevant groups of glycaemic control, group- level associations between the Diabetes Question-naire scales and glycaemic control as measured by HbA1c, unadjusted and adjusted multiple regression analyses were conducted in the same manner as previously described for the SF- 36v2 data.15 HbA
1c was considered as a
categor-ical variable divided into three clincategor-ically relevant groups corresponding to differing levels of glycaemic control and consequently differing levels of the risk of diabetes compli-cations according to international and Swedish treatment
guidelines.4 22 The three groups were well- controlled
(<52 mmol/mol), sub- optimal (52–69 mmol/mol) and
high- risk (≥70 mmol/mol). For the three HbA1c groups,
the least square mean estimates and 95% CIs were calcu-lated for each scale. The scale observations were modelled with a linear model with fixed effects for the HbA1c group (exposure), age, sex, diabetes duration, BMI, SBP, LDL- cholesterol, micro- albuminuria and macro- albuminuria, estimated glomerular filtration rate, retinopathy, smoking status, physical activity level, previous coronary heart disease, previous stroke, and receipt of antihypertensive and lipid lowering treatments. Missing data were imputed 10 times, using multiple chained equations. The analyses were performed separately for each imputed data set, and the results were subsequently combined using Rubin’s rules. The results are presented as least square mean esti-mates with 95% CIs.
The extent of missing data was 0% for age and sex, 7.2% for clinical variables (range 0%–36.5%), 1.7% for
the SF- 36v2 domains (range 0%–3.3% for individual
dimensions) and 4.8% for the Diabetes Questionnaire scales (range 0.3%–34.7% for individual scales). For the Diabetes Questionnaire, the higher extent of missing data is likely related to having ‘not applicable’ as a response alternative in some scales, which at this stage was treated as missing data. For scales without ‘not applicable’ as a response alternative, the range for missing data was 0.3%–2.8%.
The standardised mean difference was used to examine
the data balance between the HbA1c groups and the
on November 18, 2020 by guest. Protected by copyright.
deviation from the means in the clinical and demographic data. A significance level of 5% was used throughout; no allowance was made for multiplicity of statistical tests. The analyses were conducted using SAS V.9.4 and R V.3.4.4.
Patient and public involvement statement
The Diabetes Questionnaire was based on qualitative interviews with adults living with diabetes.8 9 Adults with diabetes and representatives from patient organisations participated in expert reviews during the development
and initial testing.8 Adults with diabetes were involved
in the pretesting phase by participating in cognitive interviews and being consulted to comment on
ques-tionnaire revisions.8 The analyses presented here as the
previous scale development and evaluation of reliability and validity relied on the contributions from those adults
with diabetes who responded to the questionnaires.7 8
The Swedish Diabetes Foundation, the national patient organisation, has expressed their support for the project.
RESULTS
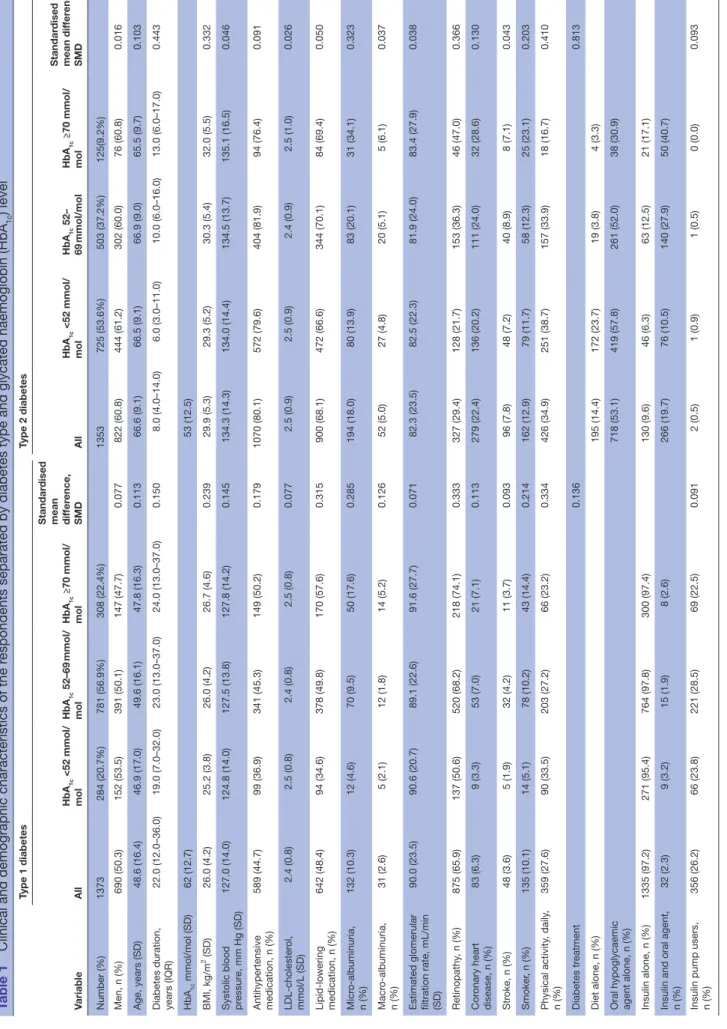
Among respondents with type 1 diabetes, 50.3% were men. The averages of key statistics were 48.6 years for age, 24.7 years for diabetes duration, and 62 mmol/mol for HbA1c level. Among respondents with type 2 diabetes, 60.8% were men. Corresponding averages were 66.6 years for age, 9.4 years for diabetes duration, and 53 mmol/
mol for HbA1c level (table 1). The crude means and SD
for the Diabetes Questionnaire scales are given in online supplemental table S1. The clinical characteristics of non- respondents are given in online supplemental table S2.
The descriptive statistics are presented as the means and SD for normally distributed continuous variables, the median and IQR for skewed distributions, or number and percentages for categorical variables.
Monoton correlations related to the proposed assumptions between the Diabetes Questionnaire scale scores and the clinical variables
In line with the assumptions and in support for divergent validity, there were few statistically significant monoton correlations between the Diabetes Questionnaire scales and the clinical variables. Observed correlations were weak, and most were negative. The results are shown as heat maps in online supplemental figures S1,S2 with details provided in online supplemental tables S3 and S4.
As assumed, the HbA1c level was the variable with most statistically significant correlations across the Diabetes Questionnaire scales. Statistically significant but weak
correlations between having a lower and better HbA1c
level and higher and better scores were seen in several Diabetes Questionnaire scales. For participants with type 1 diabetes, significant weak negative correlations (−0.12 to −0.25) were seen in the five Diabetes Questionnaire PROM scales GenW, FreW, ManD, DiEx and NLBS. The strongest correlations were seen in ManD and DiEx. Among participants with type 2 diabetes, statistically
significant but weak negative correlations (−0.13 to −0.24) were seen in the seven Diabetes Questionnaire PROM scales GenW, MoE, FreW, ManD, DiEx, NLD and NLBS and in the two PREM scales SuDC and AcDC. The stron-gest correlations were seen in MoE, FreW and ManD, with generally stronger correlations in the PROM scales than in the PREM scales online supplemental figure S1,S2 and tables S3,S4.
For age, statistically significant positive correlations showed that a higher age was weakly associated with higher and better scores in several Diabetes Question-naire scales. For participants with type 1 diabetes, statis-tically significant weak positive correlations (0.11–0.19) were seen in the four PROM scales MoE, FreW, ManD and DiEx, and in the two PREM scales AcDC and MDMT. The highest correlations were seen in MoE, FreW and MDMT. Among participants with type 2 diabetes, statis-tically significant weak positive correlations (0.12–0.16) were seen in the six PROM scales GenW, MoE, FreW, ManD and DiEx. The highest correlations were seen in MoE, FreW and DiEx. For LDL cholesterol and SBP, the results came up to the expectations of no statistically significant correlations. However, for participants with type 1 diabetes, a statistically significant negative correla-tion showed that a lower SBP was weakly associated with better scores in MoE. A lower BMI showed statistically significant weak negative correlations with higher scores in DiEx in both diabetes types as with GenW and MoE in type 2 diabetes. For diabetes duration, statistically signif-icant positive correlations showed that a longer duration was weakly associated with higher scores in FreW and ManD for participants with type 1 diabetes. For those with type 2 diabetes, statistically significant negative correla-tions showed that a longer duration was associated with lower scores in FreW and NLBS online supplemental figure S1,S2 and tables S3,S4.
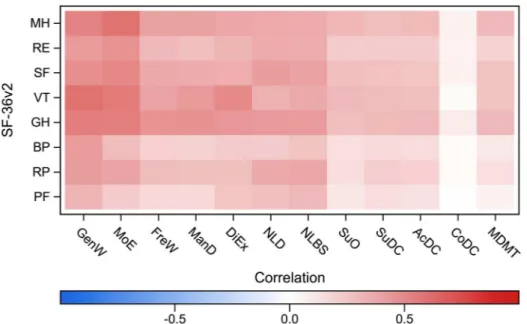
Monoton correlations related to the proposed assumptions between scores in the Diabetes Questionnaire scales and the SF-36v2 domains
In line with the assumptions and in support for conver-gent validity, the statistically significant monoton correla-tions between the Diabetes Questionnaire scales and the SF- 36v2 domains were stronger in seven of the PROM scales as compared with the PROM scale SuO and the PREM scales. As expected, the observed statistically signif-icant correlations were all positive, showing an association between higher scores in both questionnaires. The results
are shown in figures 1 and 2 and online supplemental
tables S5 and S6.
As assumed, the strongest correlations were seen in the Diabetes Questionnaire PROM scales GenW and MoE. Statistically significant positive correlations showed that higher scores in GenW and MoE were strongly associated with higher scores in about half of the SF- 36v2 domains. In GenW, statistically significant positive correlations were seen with the SF- 36v2 domains PF, GH, VT and MH. The correlations were very strong with VT (0.60), strong with
on November 18, 2020 by guest. Protected by copyright.
Table 1
Clinical and demographic characteristics of the r
espondents separated by diabetes type and glycated haemoglobin (HbA
1c ) level Variable Type 1 diabetes Type 2 diabetes All HbA 1c <52 mmol/ mol HbA 1c 52–69 mmol/ mol HbA 1c ≥70 mmol/ mol Standar dised
mean differ
ence, SMD All HbA 1c <52 mmol/ mol HbA 1c 52– 69 mmol/mol HbA 1c ≥70 mmol/ mol Standar dised mean dif fer ence, SMD Number (%) 1373 284 (20.7%) 781 (56.9%) 308 (22.4%) 1353 725 (53.6%) 503 (37.2%) 125(9.2%) Men, n (%) 690 (50.3) 152 (53.5) 391 (50.1) 147 (47.7) 0.077 822 (60.8) 444 (61.2) 302 (60.0) 76 (60.8) 0.016 Age, years (SD) 48.6 (16.4) 46.9 (17.0) 49.6 (16.1) 47.8 (16.3) 0.113 66.6 (9.1) 66.5 (9.1) 66.9 (9.0) 65.5 (9.7) 0.103
Diabetes duration, years (IQR)
22.0 (12.0–36.0) 19.0 (7.0–32.0) 23.0 (13.0–37.0) 24.0 (13.0–37.0) 0.150 8.0 (4.0–14.0) 6.0 (3.0–11.0) 10.0 (6.0–16.0) 13.0 (6.0–17.0) 0.443 HbA 1c mmol/mol (SD) 62 (12.7) 53 (12.5) BMI, kg/m 2 (SD) 26.0 (4.2) 25.2 (3.8) 26.0 (4.2) 26.7 (4.6) 0.239 29.9 (5.3) 29.3 (5.2) 30.3 (5.4) 32.0 (5.5) 0.332
Systolic blood pressur
e, mm Hg (SD) 127.0 (14.0) 124.8 (14.0) 127.5 (13.8) 127.8 (14.2) 0.145 134.3 (14.3) 134.0 (14.4) 134.5 (13.7) 135.1 (16.5) 0.046 Antihypertensive medication, n (%) 589 (44.7) 99 (36.9) 341 (45.3) 149 (50.2) 0.179 1070 (80.1) 572 (79.6) 404 (81.9) 94 (76.4) 0.091 cholester ol, mmol/L (SD) 2.4 (0.8) 2.5 (0.8) 2.4 (0.8) 2.5 (0.8) 0.077 2.5 (0.9) 2.5 (0.9) 2.4 (0.9) 2.5 (1.0) 0.026 lowering medication, n (%) 642 (48.4) 94 (34.6) 378 (49.8) 170 (57.6) 0.315 900 (68.1) 472 (66.6) 344 (70.1) 84 (69.4) 0.050 Micr albuminuria, n (%) 132 (10.3) 12 (4.6) 70 (9.5) 50 (17.6) 0.285 194 (18.0) 80 (13.9) 83 (20.1) 31 (34.1) 0.323 Macr albuminuria, n (%) 31 (2.6) 5 (2.1) 12 (1.8) 14 (5.2) 0.126 52 (5.0) 27 (4.8) 20 (5.1) 5 (6.1) 0.037
Estimated glomerular filtration rate, mL/min (SD)
90.0 (23.5) 90.6 (20.7) 89.1 (22.6) 91.6 (27.7) 0.071 82.3 (23.5) 82.5 (22.3) 81.9 (24.0) 83.4 (27.9) 0.038 Retinopathy , n (%) 875 (65.9) 137 (50.6) 520 (68.2) 218 (74.1) 0.333 327 (29.4) 128 (21.7) 153 (36.3) 46 (47.0) 0.366 Cor onary heart disease, n (%) 83 (6.3) 9 (3.3) 53 (7.0) 21 (7.1) 0.113 279 (22.4) 136 (20.2) 111 (24.0) 32 (28.6) 0.130 Str oke, n (%) 48 (3.6) 5 (1.9) 32 (4.2) 11 (3.7) 0.093 96 (7.8) 48 (7.2) 40 (8.9) 8 (7.1) 0.043 Smoker , n (%) 135 (10.1) 14 (5.1) 78 (10.2) 43 (14.4) 0.214 162 (12.9) 79 (11.7) 58 (12.3) 25 (23.1) 0.203 Physical activity , daily , n (%) 359 (27.6) 90 (33.5) 203 (27.2) 66 (23.2) 0.334 426 (34.9) 251 (38.7) 157 (33.9) 18 (16.7) 0.410 Diabetes tr eatment 0.136 0.813 Diet alone, n (%) 195 (14.4) 172 (23.7) 19 (3.8) 4 (3.3)
Oral hypoglycaemic agent alone, n (%)
718 (53.1) 419 (57.8) 261 (52.0) 38 (30.9) Insulin alone, n (%) 1335 (97.2) 271 (95.4) 764 (97.8) 300 (97.4) 130 (9.6) 46 (6.3) 63 (12.5) 21 (17.1)
Insulin and oral agent, n (%)
32 (2.3) 9 (3.2) 15 (1.9) 8 (2.6) 266 (19.7) 76 (10.5) 140 (27.9) 50 (40.7)
Insulin pump users, n (%)
356 (26.2) 66 (23.8) 221 (28.5) 69 (22.5) 0.091 2 (0.5) 1 (0.9) 1 (0.5) 0 (0.0) 0.093
BMI, body mass index; LDL,
density lipopr
otein.
on November 18, 2020 by guest. Protected by copyright.
GH and MH (0.51–0.56) and weak with PF. Among those with type 2 diabetes, there were also statistically significant strong positive correlations between GenW and SF (0.51). In MoE, statistically significant positive correlations were seen with the SF- 36v2 domains GH, VT, SF and MH. The correlations were very strong with MH (0.60) and strong
with GH, VT and SF (0.51–0.58). Among those with type 2 diabetes, statistically significant strong positive correla-tions were also seen between MoE and RF (0.51). For both diabetes types, statistically significant strong posi-tive correlations were also seen between the PROM scale DiEx and the VT domain (0.51). Statistically significant
Figure 1 Spearman’s rank correlation between the Diabetes Questionnaire scales and the SF- 36v2 domains in type 1
diabetes. Diabetes Questionnaire scales: AcDC, Access to Diabetes Care; CoDC, Continuity in Diabetes Care; DiEx, Diet and Exercise; FreW, Free of Worries about blood sugar; GenW, General Wellbeing; ManD, Capabilities to Manage your Diabetes; MDMT, Medical Devices and Medical Treatment; MoE, Mood and Energy; NLBS, Not Limited by Blood Sugar; NLD, Not Limited by Diabetes; SuDC, Support from Diabetes Care; SuO, Support from Others. SF- 36v2 domains: BP, bodily pain; GH, general health; MH, mental health; PF, physical functioning; RE, role- emotional; RP, role- physical; SF, social functioning; VT, vitality. SF- 36v2, 36- item Short Form version 2.
Figure 2 Spearman’s rank correlation between the Diabetes Questionnaire scales and the SF- 36v2 domains in type 2
diabetes. Diabetes Questionnaire scales: AcDC, Access to Diabetes Care; CoDC, Continuity in Diabetes Care; DiEx, Diet and Exercise; FreW, Free of Worries about blood sugar; GenW, General Wellbeing; ManD, Capabilities to Manage your Diabetes; MDMT, Medical Devices and Medical Treatment; MoE, Mood and Energy; NLBS, Not Limited by Blood Sugar; NLD, Not Limited by Diabetes; SuDC, Support from Diabetes Care; SuO, Support from Others. SF- 36v2 domains: BP, bodily pain; GH, general health; MH, mental health; PF, physical functioning; RE, role- emotional; RP, role- physical; SF, social functioning; VT, vitality. SF- 36v2, 36- item Short Form version 2.
on November 18, 2020 by guest. Protected by copyright.
moderate positive correlations were also seen between the PROM scales and SF- 36v2 domains. In NLD and NLBS, statistically significant moderate positive correla-tions were more common in type 2 diabetes than in type 1 diabetes. In support for divergent validity, the PROM scale SuO and the PREM scales, statistically significant
correlations were weak (0.11–0.32) or absent (figures 1
and 2, online supplemental tables S5 and S6.
Non-linear associations to clinical variables and SF-36v2 domains together
The results from the machine learning analysis are
shown in figure 3 and online supplemental figure S3.
Similar results were seen for type 1 and type 2 diabetes. Among the PROM scales, the variance was explained by the SF- 36v2 domains together with the clinical variables to almost 40% in GenW and to around 45% in MoE. In FreW, ManD, DiEx, NLD and NLBS, the variance was explained to about 25%–30% and in SuO to about 10%. Among the PREM scales, SuDC, AcDC and MDMT were explained to about 10% or below. In CoDC, almost no
variance was explained (figure 3). As predictors of the
Diabetes Questionnaire PROM scales GenW and MoE, the variables with the highest importance were the SF- 36v2 domains GH, VT and MH. LDL cholesterol and SBP had low variable importance (online supplemental
figure S3). The per cent variance in HbA1c explained by
other clinical variables, the SF- 36v2 domains, and the Diabetes Questionnaire scales together was low, around 5% in type 1 diabetes and around 10% in type 2 diabetes. Consequently, the importance of the other clinical vari-ables, the SF- 36v2 domains, and the Diabetes Question-naire scales as predictors of HbA1c was not examined.
Sensitivity of the Diabetes Questionnaire scales to clinically relevant groups of glycaemic control
The results from the adjusted regression analyses of the
Diabetes Questionnaire scales and the HbA1c groups are
presented separately for participants with type 1 and type
2 diabetes in figure 4. The least square mean estimates
and CIs from the unadjusted and adjusted analyses are given detail in online supplemental table S7.
Among those with type 1 diabetes, the adjusted anal-ysis of the HbA1c groups showed significantly lower scores for the high- risk group than the well- controlled group in the eight PROM scales GenW, MoE, FreW, ManD, DiEx, NLD, NLBS and SuO as in the PREM scale SuDC. The largest between- group differences were seen in the PROM scales ManD and DiEx, where the well- controlled group had the significantly highest means, followed by the suboptimal group and the high- risk group. Among those with type 2 diabetes, the adjusted analysis showed that the high- risk group had significantly lower scores than the well- controlled group in all scales but CoDC. In the five PROM scales MoE, FreW, ManD, NLD and NLBS, the well- controlled group had the significantly highest means, followed by the suboptimal and high- risk groups. The largest between- group differences were seen in MoE,
FreW, NLD and NLBS (figure 4, online supplemental
table S7).
DISCUSSION
From a nationwide setting with a large sample of adults with type 1 and type 2 diabetes selected at random, we present the outcome from the Diabetes Questionnaire. To study construct validity, we assess convergent and diver-gent associations of that outcome with clinical variables and generic health- related quality of life, as measured by the SF- 36v2 and assess the sensitivity to differences between clinically relevant groups of glycaemic control. We found supporting evidence for construct validity in both type 1 and type 2 diabetes. As expected, and in support for divergent validity, there were few statistically significant correlations with the clinical variables. The observed correlations were weak, and most were nega-tive. Also as expected, and in support for convergent validity, the correlations with the SF- 36v2 domains were positive; the strongest correlations were found in the
Figure 3 Per cent variance in the diabetes questionnaire scales explained by the SF- 36v2 domains and clinical variables in
type 1 (A) and type 2 diabetes (B). AcDC, Access to Diabetes Care; CoDC, Continuity in Diabetes Care; DiEx, Diet and Exercise; FreW, Free of Worries about blood sugar; GenW, General Wellbeing; ManD, Capabilities to Manage your Diabetes; MDMT: Medical Devices and Medical Treatment; MoE, Mood and Energy; NLBS, Not Limited by Blood Sugar; NLD, Not Limited by Diabetes; SF- 36v2, 36- item Short Form version 2; SuDC: Support from Diabetes Care; SuO, Support from Others.
on November 18, 2020 by guest. Protected by copyright.
Diabetes Questionnaire PROM scales GenW and MoE. Furthermore, either weak or no correlations were seen in the PREM scales, supporting divergent validity. In machine learning analyses, the SF- 36v2 domains and the clinical variables together explained the variance in the PROM scales GenW and MoE to about 40%–45%. In the other scales, the variance explained was low. In regres-sion analyses among three groups with differing levels
of HbA1c adjusted for demographics, other risk factors,
and diabetes complications, the high- risk group had, in support of sensitivity to clinically relevant groups of glycaemic control, statistically significantly lower scores than the well- controlled group in most Diabetes Ques-tionnaire scales for participants with type 1 diabetes and in almost all scales for those with type 2 diabetes. Statis-tically significant differences between all three groups of glycaemic control were seen in two scales for type 1 diabetes and in five scales for type 2 diabetes.
Findings and implications
Evaluating the measurement qualities of a questionnaire is a complex and cumulative effort.13 14 In this study, we continue the evaluation of the Diabetes Questionnaire by addressing its construct validity. The results in rela-tion to divergent validity show supporting evidence that the Diabetes Questionnaire targets different concepts than the clinical variables for diabetes care traditionally covered by the NDR. Thus, the central aspects covered by the Diabetes Questionnaire including patient perspec-tives on how they feel, how their diabetes treatment is going, or their experiences of support from diabetes care cannot be measured by HbA1c or other tested clinical vari-ables. Nor can the clinical variables be estimated through the Diabetes Questionnaire. We need the combination. There is a growing emphasis that the perspectives of those
living with diabetes should be part of clinical meetings and be given priority among outcomes in diabetes care assessments.1 5 6 23–25 Supplementing decision- making by adding the patient’s perspective is suggested to increase the focus on these aspects in clinical meetings2 26 and to
enhance the quality of care.26–28 In Sweden, the Patient
Act strengthens the patient’s position and possibilities for shared decision- making and states that the individual patient’s prerequisites and wishes should be taken into
account.29 There is also a growing movement towards
person- centred care aiming for partnership that is centred on the patient’s experience and individual prerequisites, resources and barriers. An important basis is the patient’s
story.30 We hope that the Diabetes Questionnaire can
support the patient story if used in the clinical meetings together with the clinical variables.
The Diabetes Questionnaire is unique in being devel-oped to support clinical meetings with individuals and to be used as a means for quality improvement through longitudinal assessment at a local, regional and national levels within the frame of a nationwide healthcare quality
register.7–9 Many other questionnaires for diabetes were
developed to target a specific aspect within intervention
studies.3 18 19 The Diabetes Questionnaire has a broad
approach with aspects identified as important to adults with diabetes.8 9 The Diabetes Questionnaire is also devel-oped using the vocabulary and phrasing of people with
diabetes,8 unlike many other questionnaires that often
use academic or professional jargon. In this study, we found supporting evidence that the Diabetes Question-naire is sensitive to statistically significant differences between clinically relevant subgroups with differing levels of glycaemic control. The Diabetes Questionnaire was also in support of convergent validity found to capture some
Figure 4 Adjusted least square mean estimates with 95% CIs for the Diabetes Questionnaire scales in type 1 diabetes (A)
and type 2 diabetes (B) separated by glycated haemoglobin (HbA1c) level. Adjusted for age, sex, diabetes duration, body mass
index, systolic blood pressure, LDL cholesterol level, micro- albuminuria and macro- albuminuria, estimated glomerular filtration rate, retinopathy, smoking status, physical activity level, receipt of antihypertensive and lipid lowering treatments, previous coronary heart disease and previous stroke. AcDC, Access to Diabetes Care; CoDC, Continuity in Diabetes Care; DiEx, Diet and Exercise; FreW, Free of Worries about blood sugar; GenW, General Wellbeing; LDL, low- density lipoprotein ; ManD, Capabilities to Manage your Diabetes; MDMT, Medical Devices and Medical Treatment; MoE, Mood and Energy; NLBS, Not Limited by Blood Sugar; NLD, Not Limited by Diabetes; SuDC, Support from Diabetes Care; SuO, Support from Others.
on November 18, 2020 by guest. Protected by copyright.
aspects of generic health- related quality of life, while also in support of divergent validity adding aspects that are not covered by the often- recommended SF- 36v2. For routine use within clinical diabetes care, the Diabetes Question-naire is likely more relevant than the generic SF- 36v2. A limitation of the Diabetes Questionnaire is, however, that it is currently only available in Swedish. Consequently, there is limited opportunity for international compari-sons. The opportunities and barriers related to clinical use of the Diabetes Questionnaire are currently being studied from the perspectives of professionals and adults with diabetes.
Strengths and weaknesses
Among the strengths of this study are the large and heterogeneous sample of adults with type 1 and type 2 diabetes selected at random from the nation- wide NDR. The respondents were representative of the 2015 popula-tion in the NDR (data on file). The results can be consid-ered representative of the Swedish adult population with diabetes related to the coverage rate of about 90% in 2015 when around 40 000 adults with type 1 diabetes and 347 000 with type 2 diabetes were registered in the NDR. Through the NDR, we had access to clinical variables rele-vant for diabetes care and background data for the non- respondents. Another strength is the use of a well- known measure of health- related quality of life. As there is a lack of agreed- upon benchmarks for how strong positive correlations between questionnaires addressing subjec-tive aspects should be to support convergent construct validity,31 32 this study based the division of the correlation strength on reports that such correlations generally are low,31 33 often within the range 0.20–0.4033 or 0.40–0.60.31 A correlation of 0.60 has been suggested to be extremely strong, as the random error of measurement of the two
questionnaires impede perfect correlations.31 As the
Diabetes Questionnaire and the SF- 36v2 do not measure the exact same construct, there were no prerequisites for broad strong correlations.14 31 33
Our study also has limitations. The analyses were limited to the respondents and might reflect a group that is more motivated to participate. Another limitation is that the questionnaires were only offered in Swedish, potentially resulting in a higher proportion of foreign- born individ-uals among the non- responders than among the respon-dents. Furthermore, the cross- sectional design means that it is not possible to make causal conclusions.
Future perspectives
The evaluation of construct validity is a work of putting
the pieces together.13 14 Consequently, more studies are
needed to relate the Diabetes Questionnaire to different concepts and measures. An important task for diabetes care is to identify suitable interventions that adequately can support individuals with diabetes. The Diabetes Ques-tionnaire can be an important contribution to identify the need and focus for targeted interventions, especially for adults with low scores. In future studies, it is important to
evaluate the potential of using scores from the Diabetes Questionnaire scales as the primary selection base or in
combination with, for example, HbA1c levels or BMI. It
is also essential to evaluate whether the Diabetes Ques-tionnaire scales are responsive to actual changes and can be used as an evaluative tool adding patient perspectives to both nursing and medical interventions, longitudinal assessments and quality improvement. The NDR is estab-lished as a clinical and a national assessment tool in Swedish diabetes care.4 34–36 By now, the Diabetes Question-naire is digitally and freely available for use by all clinics in Sweden connected to the NDR. The Diabetes Ques-tionnaire is also included as the basis for developmental quality indicators in the Swedish national guidelines for diabetes care.4 In the future, the Diabetes Questionnaire can be among the established quality indicators bringing patient perspectives to the fore for diabetes care.
CONCLUSION
This nation- wide study shows that the Diabetes Question-naire captures some generic health- related quality of life dimensions as well as adds diabetes- specific information not covered by the SF- 36v2 and clinical variables. The Diabetes Questionnaire is also sensitive to differences between clinically relevant groups of glycaemic control. Author affiliations
1School of Education, Health and Social Studies, Dalarna University, Falun, Sweden 2Department of Molecular and Clinical Medicine, Institute of Medicine, Sahlgrenska
Academy, University of Gothenburg, Gothenburg, Sweden
3Clinical Diabetology and Metabolism, Department of Medical Sciences, Uppsala
University, Uppsala, Sweden
4Department of Health Promotion Science, Sophiahemmet University, Stockholm,
Sweden
5Department of Clinical Sciences and Education, Södersjukhuset, Karolinska
Institutet, Stockholm, Sweden
6Department of Clinical Sciences in Malmö, Health Economics Unit, Medicon Village,
Lund University, Lund, Sweden
7Department of Data Management and Analysis, Västra Götalandsregionen,
Gothenburg, Sweden
8Register Center Västra Götaland, Västra Götalandsregionen, Gothenburg, Sweden 9Department of Medicine, Sahlgrenska University Hospital, Gothenburg, Sweden
Acknowledgements The authors wish to thank Ebba Linder for facilitating data collection, Mervete Miftaraj for data management and Ann- Marie Svensson for intellectual advice and support during the processes of design and ethical approval. Parts of the presented data have been published in an abstract and were presented at the Annual Meeting of the European Association for the Study of Diabetes (EASD) in 2019 and within a doctoral thesis at Gothenburg University, Sweden, in 2019. Contributors MSE made substantial contributions to the design of the work, applying for ethical approval and funding, interpreting the data and drafting and revising the manuscript (major contributor). JL and U- BJ supervised and made substantial contributions to the design of the work, applied for funding, made intellectual contributions in the interpretation of the data, critically revised the manuscript for important intellectual content, and contributed experience and knowledge from diabetes care and research in diabetes and health- related quality of life. SB made substantial contributions to the design of the work, made intellectual contributions in the interpretation of the data and critically revised the manuscript for important intellectual content. BP made substantial contributions to the design of the work; performed the selection of the random sample; made intellectual contributions in the interpretation of the data; critically revised the manuscript for important intellectual content, and contributed statistical advice, experience and knowledge in the research of generic health- related quality of life
on November 18, 2020 by guest. Protected by copyright.
and patient- reported outcome. SF made substantial contributions to the design of the work, contributed substantial statistical advice, was the major contributor in analysing the data, made substantial intellectual contributions in the interpretation of the data, and critically revised the manuscript for important intellectual content. SG supervised and made substantial contributions to the design of the work; applied for ethical approval and funding; made intellectual contributions in interpretation of the data; critically revised the manuscript for important intellectual content, and contributed medical experience and knowledge from diabetes care, diabetes research, and research using healthcare quality registers. KE- O supervised and made substantial contributions to the design of the work; applied for ethical approval and funding; generated the SF- 36v2 data; interpreted the data; critically revised the manuscript for important intellectual content, and contributed medical experience and knowledge from diabetes care, diabetes research and research using healthcare quality registers. All authors read and approved the final manuscript as well as consented to be on the author list.
Funding This work was supported by Dalarna University, Falun; Uppsala University, Uppsala; the Sahlgrenska University Hospital, Gothenburg; the Swedish Diabetes Foundation; and the Sophiahemmet Foundation, Stockholm. Unrestricted grants were provided by Astra Zeneca, MSD, Novo Nordisk and the Swedish state under the agreement between the Swedish government and the county councils, the ALF- agreement (Nos. ALFGBG-725311 and ALFGBG-698991). None of the funding providers have influenced the design of the study; the collection, analysis or interpretation of data; the writing of the manuscript, or any publication decision at any stage.
Competing interests KE- O reports grants from the ALF agreement (ALFGBG 698991), during the conduct of the study; personal fees from Abbott, personal fees from Lilly, personal fees from Novo Nordisk, personal fees from Bayer, outside the submitted work; SG reports grants from the ALF- agreement (ALFGBG 725311), during the conduct of the study; grants and personal fees from AstraZeneca, grants and personal fees from Boehringer Ingelheim, grants and personal fees from Eli Lilly, grants and personal fees from Merck Sharp & Dohme, grants and personal fees from Novo Nordisk, grants and personal fees from Sanofi, outside the submitted work; the other authors declare that they have nothing to disclose. Patient consent for publication Not required.
Ethics approval The study conforms to the Declaration of Helsinki and was approved by the Regional Ethical Review Board in Gothenburg, Sweden (No. 029-15, T600-15). Participants gave their informed consent. The letter to the participants contained information about the study’s purpose, the voluntary nature of their participation and their right to end participation. The letter also disclosed information about the NDR, methods of handling personal data, confidentiality measures and contact details.
Provenance and peer review Not commissioned; externally peer reviewed. Data availability statement Data are available upon reasonable request. The data that support the findings of this study are not publicly available. The study presented here has been subject to review by an ethical board and approved for publication related to the specific aim of our research project. With reference to the European General Data Protection Regulation, the data are personal and therefore confidential.
Supplemental material This content has been supplied by the author(s). It has not been vetted by BMJ Publishing Group Limited (BMJ) and may not have been peer- reviewed. Any opinions or recommendations discussed are solely those of the author(s) and are not endorsed by BMJ. BMJ disclaims all liability and responsibility arising from any reliance placed on the content. Where the content includes any translated material, BMJ does not warrant the accuracy and reliability of the translations (including but not limited to local regulations, clinical guidelines, terminology, drug names and drug dosages), and is not responsible for any error and/or omissions arising from translation and adaptation or otherwise. Open access This is an open access article distributed in accordance with the Creative Commons Attribution Non Commercial (CC BY- NC 4.0) license, which permits others to distribute, remix, adapt, build upon this work non- commercially, and license their derivative works on different terms, provided the original work is properly cited, appropriate credit is given, any changes made indicated, and the use is non- commercial. See: http:// creativecommons. org/ licenses/ by- nc/ 4. 0/. ORCID iDs
Maria Svedbo Engström http:// orcid. org/ 0000- 0002- 8267- 592X
Janeth Leksell http:// orcid. org/ 0000- 0001- 8682- 2045
Unn- Britt Johansson http:// orcid. org/ 0000- 0003- 3309- 136X
Sixten Borg http:// orcid. org/ 0000- 0001- 6292- 7002
Bo Palaszewski http:// orcid. org/ 0000- 0002- 4854- 2701
Katarina Eeg- Olofsson http:// orcid. org/ 0000- 0002- 3376- 4707
REFERENCES
1 Young- Hyman D, de Groot M, Hill- Briggs F, et al. Psychosocial care for people with diabetes: a position statement of the American
diabetes association. Diabetes Care 2016;39:2126–40.
2 Polonsky WH. Emotional and quality- of- life aspects of diabetes
management. Curr Diab Rep 2002;2:153–9.
3 Speight J, Reaney MD, Barnard KD. Not all roads lead to Rome- a
review of quality of life measurement in adults with diabetes. Diabet
Med 2009;26:315–27.
4 National Board of Health and Welfare (Socialstyrelsen). National guidelines for diabetes care. [In Swedish]. Nationella riktlinjer för diabetesvård: Stöd för styrning och ledning, 2018. Available: http:// www. socialstyrelsen. se/ [Accessed 16 Oct 2019].
5 American Diabetes Association. 4. Comprehensive Medical Evaluation and Assessment of Comorbidities: Standards of Medical
Care in Diabetes-2020. Diabetes Care 2020;43:S37–47.
6 American Diabetes Association. 5. Facilitating Behavior Change and Well- being to Improve Health Outcomes: Standards of Medical Care
in Diabetes-2020. Diabetes Care 2020;43:S48–65.
7 Borg S, Eeg- Olofsson K, Palaszewski B, et al. Patient- Reported outcome and experience measures for diabetes: development of scale models, differences between patient groups and relationships with cardiovascular and diabetes complication risk factors, in
a combined registry and survey study in Sweden. BMJ Open
2019;9:e025033.
8 Svedbo Engström M, Leksell J, Johansson U- B, et al. A disease- specific questionnaire for measuring patient- reported outcomes and experiences in the Swedish national diabetes register: development and evaluation of content validity, face validity, and test- retest
reliability. Patient Educ Couns 2018;101:139–46.
9 Svedbo Engström M, Leksell J, Johansson U- B, et al. What is important for you? A qualitative interview study of living with diabetes and experiences of diabetes care to establish a basis for a tailored patient- reported outcome measure for the Swedish national
diabetes register. BMJ Open 2016;6:e010249.
10 Borg S, Palaszewski B, Gerdtham U- G, et al. Patient- Reported outcome measures and risk factors in a quality registry: a basis for
more patient- centered diabetes care in Sweden. Int J Environ Res
Public Health 2014;11:12223–46.
11 Robeyns I. Sen's capability approach and general inequality:
selecting relevant capabilities. Fem Econ 2003;9:61–92.
12 Sen AK, Nussbaum MC. The quality of life. Oxford: Clarendon Press, 1993.
13 Fayers PM, Machin D. Quality of life: the assessment, analysis, and reporting of patient- reported outcomes. Third ed. Chichester, West Sussex, UK; Hoboken, NJ: John Wiley & Sons Inc, 2016.
14 Mokkink LB, Terwee CB, Patrick DL, et al. The COSMIN study reached international consensus on taxonomy, terminology, and definitions of measurement properties for health- related patient-
reported outcomes. J Clin Epidemiol 2010;63:737–45.
15 Svedbo Engström M, Leksell J, Johansson U- B, et al. Health- Related quality of life and glycaemic control among adults with type 1 and
type 2 diabetes – a nationwide cross- sectional study. Health Qual
Life Outcomes 2019;17:1–11.
16 Ware JE. Sf-36 health survey update. Spine 2000;25:3130–9.
17 Maruish ME. User’s manual for the SF- 36v2 Health Survey. 3rd ed. Lincoln, RI: QualityMetric Incorporated, 2011.
18 Fitzpatrick R, Bowling A, Gibbons E, et al. A structured review of patient- reported measures in relation to selected chronic conditions, perceptions of quality of care and carer impact national centre for health outcomes development (Oxford site): unit of health- care epidemiology, department of public health, University of Oxford, 2006. Available: http:// phi. uhce. ox. ac. uk/
19 Gibbons E, Fitzpatrick R, Patient Reported Outcome Measurement Group. A structured review of patient- reported outcome measures (PROMs) for diabetes. University of Oxford, 2009.
20 Norris SL, McNally TK, Zhang X, et al. Published norms
underestimate the health- related quality of life among persons with
type 2 diabetes. J Clin Epidemiol 2011;64:358–65.
21 Breiman L. Random forests. Mach Learn 2001;45:5–32.
22 American Diabetes Association. 6. Glycemic Targets: Standards of
Medical Care in Diabetes-2020. Diabetes Care 2020;43:S66–76.
23 Jones A, Vallis M, Pouwer F. If it does not significantly change HbA1c levels why should we waste time on it? a plea for the prioritization
of psychological well- being in people with diabetes. Diabet Med
2015;32:155–63.
on November 18, 2020 by guest. Protected by copyright.
24 Glasgow RE, Peeples M, Skovlund SE. Where is the patient in diabetes performance measures?: the case for including
patient- centered and self- management measures. Diabetes Care
2008;31:1046–50.
25 IDF Clinical Guidelines Task Force. Global guideline for type 2 diabetes: recommendations for standard, comprehensive, and
minimal care. Diabet Med 2006;23:579–93.
26 Kotronoulas G, Kearney N, Maguire R, et al. What is the value of the routine use of patient- reported outcome measures toward improvement of patient outcomes, processes of care, and health service outcomes in cancer care? A systematic review of controlled
trials. J Clin Oncol 2014;32:1480–501.
27 Reay N. How to measure patient experience and outcomes to
demonstrate quality in care. Nurs Times 2010;106:12–14.
28 Snyder CF, Aaronson NK, Choucair AK, et al. Implementing patient- reported outcomes assessment in clinical practice: a review of the
options and considerations. Qual Life Res 2012;21:1305–14.
29 Socialdepartementet. Patient Act, (SFS 2014:821). [In Swedish]. Patientlag (SFS 2014:821. Stockholm, Sweden.
30 Ekman I, Swedberg K, Taft C, et al. Person- centered care--ready for
prime time. Eur J Cardiovasc Nurs 2011;10:248–51.
31 McDowell I. Measuring health: a guide to rating scales and questionnaires. 3rd ed. Oxford; New York: Oxford University Press, 2006.
32 Post MW. What to Do With "Moderate" Reliability and Validity
Coefficients? Arch Phys Med Rehabil 2016;97:1051–2.
33 Polit DF, Beck CT. Nursing research: generating and assessing evidence for nursing practice. 10th ed. Philadelphia: Wolters Kluwer Health/Lippincott Williams and Wilkins, 2016.
34 Eliasson B, Gudbjörnsdottir S. Diabetes care--improvement through
measurement. Diabetes Res Clin Pract 2014;106 Suppl 2:S291–4.
35 Gudbjörnsdottir S, Cederholm J, Nilsson PM, et al. The National diabetes register in Sweden: an implementation of the St. Vincent
Declaration for quality improvement in diabetes care. Diabetes Care
2003;26:1270–6.
36 Svensson AM, Gudbjörnsdottir S, Samuelsson P, et al. 20 years of successful improvements. Gothenburg, Sweden, 2016. Available: www. ndr. nu
on November 18, 2020 by guest. Protected by copyright.