Doctoral thesis in Physiology
Department of Molecular Biosciences,
The Wenner-Gren Institute, Stockholm University
Stockholm, Sweden
Stockholm, 2015
Thermal physiology and metabolism
Interplay between heat generation and energy homeostasis
Abstract
Mammal metabolism is intimately connected to the maintenance of body temperature. While metabolic pathways invariably produce heat as a by-product, the natural heat present in the environment also plays a role in defining the adaptive me-tabolism and general physiology of an organism. This thesis aims to discuss basic aspects of energy expenditure and their interactions with energy stores and body com-position.
In Paper I, we apply a new technique – high-resolution laser-Doppler imag-ing – to describe physiological regulatory features of adrenergically-stimulated blood flow in brown adipose tissue, and evaluate the validity of blood flow as a parameter to estimate nonshivering thermogenesis.
Paper II focuses on the central regulation of body temperature. In the absence of bombesin receptor subtype-3, mice present an altered neurological body tempera-ture setpoint, while peripheral thermogenic capacity remains intact. We conclude that brown adipose tissue malfunction is not the cause of the hypothermia observed in this mouse model.
Paper III incorporates measurements of body temperature to the energy ex-penditure of different sources: basal metabolic rate, physical activity, thermic effect of food, and cold-induced thermogenesis. We describe basic aspects of dynamic insu-lation, energetic costs of circadian variation and hypothesize that physical activity may change the body temperature setpoint.
Paper IV describes methodological issues related to glucose tolerance tests in obese mice. We conclude that the erroneous scaling of doses may affect the inter-pretation of metabolic health in mouse models, and suggest a new methodology.
Paper V describes the outcomes caused by the expression of the human Cidea protein in adipose tissue of mice and suggests that this protein may clarify the link between adipose tissue expansion and healthy obesity.
Paper VI explores the dissociation between thiazolidinedione-induced adi-pose tissue “browning” and reduced blood glycaemia. We demonstrate that although this pharmacological class tends to induce some level of brown adipose tissue recruit-ment, this phenomenon does not define its antidiabetic effects.
©Gustavo de Abreu Vieira, Stockholm University 2015 ISBN 978-91-7649-156-0
Printed in Sweden by Holmbergs, Malmö 2015 Distributor: Publit
To the warmth of life
Natural science does not simply describe and explain nature;
it is part of the interplay between nature and ourselves.
Enclosed with this thesis are the following papers:
I. Adrenergically-stimulated blood flow in brown adipose tissue
is not dependent on thermogenesis.
Abreu-Vieira G, Hagberg CE, Spalding KL, Cannon B and Nedergaard J.
In press - Am J Physiol Endocrinol Metab, doi: 10.1152/ajpendo.00494.2014 (2015)
II. Regulation of body temperature and brown adipose tissue thermogenesis
by bombesin receptor subtype-3.
Lateef DM, Abreu-Vieira G, Xiao C, Reitman ML. Am J Physiol Endocrinol Metab. 306:E681-7 (2014)
III. Integration of body temperature into the analysis of
energy expenditure in the mouse.
Abreu-Vieira G, Xiao C, Gavrilova O, Reitman ML.
In press - Molecular Metabolism, doi:10.1016/j.molmet.2015.03.001 (2015)
IV. On adequate procedures for glucose tolerance tests in obese animals.
Abreu-Vieira G, Bengtsson T, Petrovic N and Nedergaard J.
Manuscript submitted
V. Cidea improves metabolic profile through expansion of
adipose tissue.
Abreu-Vieira G1, Fischer AW1, Mattsson C, de Jong JMA, Shabalina IG, Rydén M,
Laurencikiene J, Arner P, Cannon B, Nedergaard J, Petrovic N. Manuscript under review
VI. Novel thiazolidinediones distinguish between (UCP1-independent)
antidia-betic effects (MSDC-0602) and adipogenic and browning-inducing effects (MSDC-0160) of classical thiazolidinediones (rosiglitazone).
Abreu-Vieira G, Kalinovich A, Cannon B, Nedergaard J.
Manuscript in preparation
Contents
1 Preface ... 1
2 The concept of heat applied to physiology ... 2
3 Compartments of heat generation ... 5
3.1 Thermic effect of food ... 5
3.2 Physical Activity ... 7
3.3 Cold-induced thermogenesis ... 9
3.4 Basal metabolic rate ... 11
4 Central Regulation of Body temperature ... 12
4.1 Body temperature setpoint ... 12
4.1.1 Setpoint shift: fever... 14
4.1.2 Setpoint shift: physical activity ... 14
4.1.3 Setpoint shift: circadian variation ... 16
4.2 Neural pathways ... 17
5 Maximum thermogenic capacity ... 20
6 Heat distribution and insulation ... 23
6.1 Blood flow ... 23
6.2 Insulation ... 24
7 Body composition and energy homeostasis ... 27
7.1 Scaling caloric costs ... 27
7.1.1 Heat conductance and fat mass ... 28
7.1.2 Basal metabolic rate and lean mass ... 30
7.2 Measurement of glucose tolerance ... 30
8 Metabolic health ... 34
8.1 Thermogenesis in obesity ... 34
8.2 The paradox of healthy obesity ... 35
8.3 Energy storages and circadian cycles ... 36
9 Technical considerations on calorimetry... 38
9.1 De novo lipogenesis ... 38
9.2 Measurement artifacts caused by air humidity ... 40
10 Future perspectives ... 43
11 Acknowledgements ... 46
Abbreviations
BAT Brown Adipose Tissue
BMR Basal Metabolic Rate
BRS-3 Bombesin Receptor Subtype-3
CIDEA Cell death-inducing DFFA-like effector A
CIT Cold-Induced Thermogenesis
Cmax Peak Concentration
Co Initial Concentration
dTb Defended Body Temperature
EE Energy Expenditure
F Bioavailability
GTT Glucose Tolerance Test
HR.LDI High-Resolution Laser-Doppler Imaging
Ke Elimination Constant
LCT Lower Critical Temperature
LPS Lipopolysaccharide
MET Metabolic Equivalent of Task
PA Physical Activity
PAEE Physical Activity Energy Expenditure
POA Preoptic Area
RMR Resting Metabolic Rate
T1/2 Half-life
Ta Ambient Temperature
Tb Body Temperature
TEE Total Energy Expenditure
UCP1 Uncoupling Protein 1
1 Preface
It is with great pleasure that I write this PhD thesis. Over the last 4 years, my focus has been to investigate the interactions between the fields of thermogenesis, obesity and bioenergetics. The focal point of interest was attempting to understand and to quantify the different ways by which experimental mouse models utilize en-ergy. Because of our laboratory’s tradition, the study of thermogenesis – the catabo-lism of substrates causing heat to be released – is a major topic. While all projects started in order to understand the function of brown adipose tissue, methodological challenges have given origin to seemingly unconnected spin-off projects. Those, in turn, became what I consider to be important steps towards describing general terms of metabolism, including brown adipose tissue basic physiology.
Instead of presenting an extensive review of published data based on pre-established concepts, this thesis is structured as a discussion of the concepts per se. In this context, physiological hypotheses may sound deceptively straight-forward, but should be taken as a nuanced and personal collection of thoughts on the nature of the observed phenomena.
Due to this reflexive character, few literary references are used in some sec-tions, while logics is used in an attempt to craft sound rationales and to inquire into their implications. At times, compound nouns that have been previously abbreviated may appear once again in its extended form. This deviation from standard scientific writing is a decision aiming to increase the clarity of the text, mostly where several specific terms are used sequentially.
All concepts discussed are, at the time of writing, expected to be applicable to future investigations of human metabolism. While the attempt may be overoptimis-tic, the fun of trying is certainly worth the effort.
2 The concept of heat applied to physiology
The field of thermal physiology aims to investigate the biological implica-tions of temperature to the function of living organisms. This includes adaptaimplica-tions in face of environmental challenges, as well as the metabolic demands causes by these adaptations. But before introducing the physiological studies, it is necessary to define the terms to be used, and this includes the notion of temperature. There are different ways to conceptualize it, ranging from random atomic agitation in a molecule, to com-plex vibrational patterns termed phonons. Here, however, we apply the primitive no-tion of hotness, referred to as heat. Experimental results are always indicated accord-ing to the Celsius scale, and the costs of heat generation are defined by kilocalories. Although other units like watts or joules may be more adequate to physical experi-mentation, the ultimate focus on metabolism guides the decision to apply the caloric concept to the data. No additional physical nuances are necessary to define tempera-ture at the present level of biological investigation. It is, though, important to recall the ways by which temperature varies in a body and the associated physiological rel-evance.
Heat production may happen as a by-product of metabolic processes, i.e., as the inefficient part of molecular transformations that causes part of the energy not to be used for work, but instead, lost as heat. It may also be produced by organized ther-mogenesis when an endothermic organism struggles in face of a colder-than-desirable ambient. Heat transfer, in its turn, occurs naturally by different modalities. Conduction is the direct transfer of heat between two substances in contact with each other. This classification includes the warmth leaving the bare feet in contact with the ground, or dissipating through an organ when generated by a focal point (e.g. a mitochondrion). If the heat is being carried from one point to another by a moving substance, the mode is called convection. Convective currents are perhaps the most important for the temperature balance of an organism. Heat produced during thermogenic processes are readily spread throughout the body by the blood circulation. This is the reason why, e.g., the brain can be kept warm by heat generated in distant organs. Convection also plays a fundamental role in heat loss: air currents surrounding an organism will
facilitate the thermal dissipation to the environment (considering it is at a lower tem-perature than the organism), therefore the great benefit of nest building and shelter-seeking behaviors. Radiation is the transfer of thermal energy in the form of light waves, as exemplified by the heat we receive from the sun. All bodies, including mammals, emit heat by radiation. During the winter, some small mammals will bury themselves in the snow. This decreases heat loss by radiation, once the light/heat emit-ted is reflecemit-ted by the snow back on the animal. Because of the low body temperature of the animal, the radiative heat loss light falls outside the visible spectrum for hu-mans. When warmed up enough, as in the case of heated metals, the radiative glow becomes visible. It can be speculated that our lack of capacity to see low-temperature radiation may have evolutionary purposes: bright colors caused by high temperatures becomes suddenly visible to indicate the danger of flames, magma, or the plasma of lightning during a storm.
Life is strictly associated to ambient temperatures. Every organism works optimally in a range of environments, and climate alterations force species through natural selection (i.e. death of many individuals and survival of the species in case pre-existent random mutations turn useful for the new environment). It is interesting to consider the reasons why body temperature is strictly controlled in mammals. It is not trivial to rationalize the reason why homeothermy might have evolutionary ad-vantages over poikilothermy. The first classification is applied to animals that try to keep their body temperatures within a rather stable range, as opposed to poikilotherms. Now assume that, for whatever reason, an organism evolved in the direction of home-othermy. Its organs and cellular functions will likely be more adapted to an optimal range of temperatures, while large environmental fluctuations could turn disastrous. In this homeothermic scenario, the capacity to perform thermogenesis (endothermy) is greatly advantageous in relation to ectothermy (i.e. when organisms rely on heat absorbed from the environment in order to maintain their own temperature constant). Because no common endothermic ancestor for, e.g., mammals and birds seems to have existed (Fong et al., 2012), it is likely that the “warm-blooded” feature is a product of convergent evolution. Convergence, in turn, is a common trait of environmental pres-sure stimulating nonrelated species to adopt similar beneficial strategies that will en-sure survival. The choice of keeping a stable temperature, allied to the capacity to endogenously produce heat, is thought to have allowed animals to spread over wide
geographical locations, to endure cold winters, and to perform metabolic conversions at optimal temperatures (Grigg et al., 2004, Portner, 2004, Kurbel, 2014). Convergent evolution is then a reason supporting the existence of evolutionary advantage for en-dothermic organisms.
In summary, heat exchange with the environment, along with endogenous control of thermogenesis, are fundamental in defining the metabolism and the life of an organism like ourselves. Several functions seem to have coevolved to support tem-perature homeostasis: energy storages for later combustion (white adipose tissue), in-tegration and processing of information regarding temperatures (nervous system), and direct production of heat (brown adipose tissue and muscles). As it happens to be, the organs performing these functions are also intimately related to the modern human diseases of obesity and diabetes. Therefore, there is a necessity to investigate physio-logical functions connected to temperature control, as well as their interplay with ca-loric balance. Just like heat generation has defined the life history on our planet, the understanding of thermogenesis (and the capacity to manipulate it) may turn greatly beneficial to the future health of our own species.
3 Compartments of heat generation
When attempting to describe metabolism, different terms are currently used to classify energy expenditure and its integrated parts. Each individual choice of no-menclature tends to be based on the immediate focus of the study being performed, as well as on the methods available for data acquisition and analysis. In order to aid the search for therapies against metabolic alterations, it is fundamental to establish sound rationales for the concepts to be employed when evaluating metabolism. Based on this necessity, this section (based on papers II and III) attempts to craft distinctions be-tween the elements of energy expenditure and to discuss the conceptual implications and practical applicability of the parameters.
3.1 Thermic effect of food
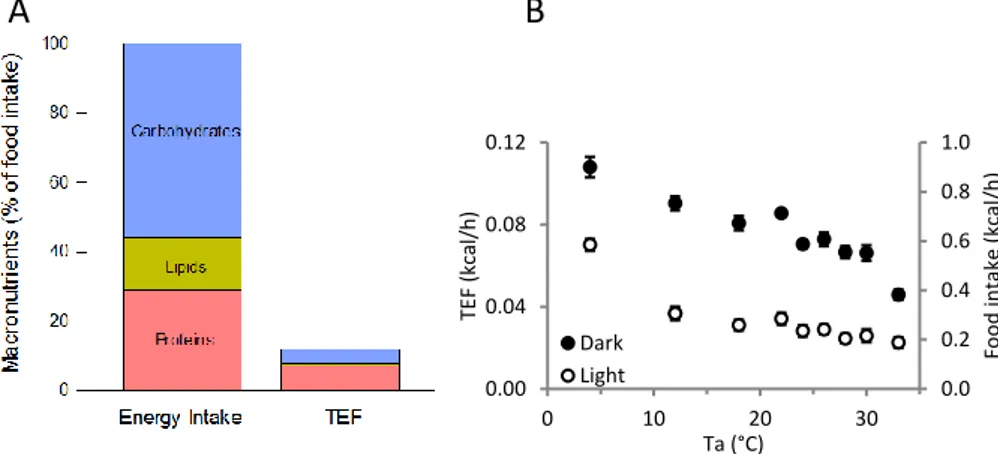
Thermic effect of food (TEF) is generally defined as the energy necessary for the digestion, absorption, transport and storage of macronutrients. The values of TEF are approximately 10% of the energy content of the ingested food, and can be thought of as an energy “tax” on food assimilation. Therefore, in a situation when an organism keeps its body composition constant (i.e. when food intake equals caloric expenditure), around one tenth of the measured metabolic rate will be expected to be due to TEF.
The percent energy (over its own energy content) necessary for each macro-nutrient to be metabolized is assumed to be approximately 2.5% for lipids, 7.5% for carbohydrates, and 25% for proteins (Trumbo et al., 2002). These values are, however, assumed based on empirical experimentation. Any attempt to precisely describe the TEF of a specific molecule would necessarily have to incorporate complex stoichio-metric calculations, as well as a plethora of metabolic pathways that are seldom in steady state. It would then be honest to assume that discussion on the precise values of TEF seem to be ahead of our time and methodological capabilities.
Figure 1. Thermic effect of the food. (A) Proportion of macronutrients composing the chow
diet used for papers II and III, along with each macronutrient’s contribution to the thermic effect of food (TEF). (B) Representation of food intake and TEF variability over a range of ambient temperatures (data from paper III).
It is important not to confuse TEF with a parallel phenomenon: diet-induced thermogenesis (DIT). The conceptualization of DIT is that organs (e.g. brown adipose tissue) may have an adaptive response to macronutrients (Rothwell and Stock, 1979). This response could be modulated by factors within the organism, producing a differ-ent thermic response to the same amount of ingested macronutridiffer-ent, although it is described to happen primarily during caloric overfeeding (Rothwell et al., 1982, Himms-Hagen, 1984); therefore the conceptual dissociation made between DIT and TEF. A careful reader will realize that these definitions do not preclude controversy: in theory, every process included in the TEF could be somewhat modulated, implying that the lines between TEF and DIT are thinner than would be desired when attempt-ing to measure their contributions to heat generation. For the sake of simplicity, it could be suggested that the term TEF would be better used when the contribution of food-related energy consumption is pondered against that of distinct nature (e.g. from physical activity or induced by cold exposure). On the other hand, DIT may be better suited to the analysis of how a tissue or an organism can be conditioned to elicit dif-ferent thermic responses to similar nutritional stimuli.
In our measurements (Paper III), TEF was quantified by directly converting the food intake to the consensus values of TEF, proportionally to each macronutrient’s
0.0 0.2 0.4 0.6 0.8 1.0 0.00 0.04 0.08 0.12 0 10 20 30 Fo o d in ta ke (k ca l/h ) TE F (kc al/h) Ta (°C) Dark Light
A
B
presence in the food. This is demonstrated in Figure 1B, where data points, represent-ing the results obtained from a group of mice fed a standard chow diet, can simulta-neously demonstrate TEF (primary Y axis) or food intake (secondary Y axis). The beauty of this analysis resides in its simplicity: in this case, 12% of the energy intake is utilized for its own metabolism. Additionally, colder temperatures stimulate food intake, equally increasing the heat produced as TEF. We considered TEF to be inde-pendent of additional variables in order to make it easier to quantify the other elements of energy expenditure and heat generation.
3.2 Physical Activity
Physical activity (PA) incorporates every kind of skeletal muscle contraction that may or may not generate a visible movement of an organism or segment of the body. For a contraction to occur, energy has to be transferred from different metabolic pathways. Regardless of the substrate utilized as fuel, the costs of PA can be assessed by analyzing O2 consumption (unless anaerobic glycolysis is taking place), CO2
pro-duction, and/or heat released from the body. It is very intuitive to assume that a sig-nificant part of the energy transferred from the catabolism of chemical substrates to the mechanical contraction of
mus-cles is released as heat. We humans possess effective mechanisms to dis-sipate the heat that is generated dur-ing exercise when the weather is hot; the most pronounced being sweating and skin vasodilation. The heat gen-erated by PA can be assessed in ex-perimental animal models, as exem-plified by a scatter plot correlating the assumed body temperature trend in the face of varied levels of PA (Figure
2). In this representation, data collected during light or dark phases of the day have been divided due to circadian variation of body temperature (which will be addressed later in the setpoint-related sections of this thesis).
Figure 2. Correlation between PA and Tb.
The conceptualization of physical activity is rather trivial, but its measure-ment is not. Physical activity energy expenditure (PAEE) arises from every muscle being contracted in the body. Muscles work as chains of segments that constantly redistribute their forces of contraction, and likely the associated metabolic costs (Myers, 2001). However, some muscle activities do not produce limb movement but have significant physiological effects (i.e. isometric contractions (Mitchell and Wildenthal, 1974)). Additionally, anatomical variations of the muscle insertion in the bones could theoretically cause biomechanical alterations, modifying the metabolic cost per unit contraction force (e.g. kcal/N) (Brinckmann et al., 2002). For the cited reasons, the measurement of PA is still a technical issue in the quantification of energy metabolism. Therefore, when measuring PA, data acquisition has to be clearly ex-plained, and the methodological limitations made explicit.
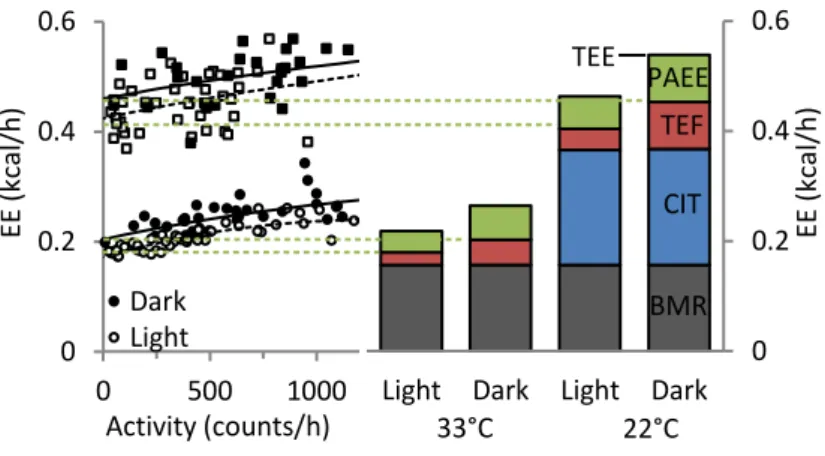
Figure 3. Energy expenditure related to physical activity. Scatter plot relating activity and
total energy expenditure. The Y intercept of the trendline represents the mathematical approx-imation of a mouse’s caloric costs at rest. The delta between TEE and Y intercept represents the PAEE. Additional energy expenditure related to other compartments are also represented. PAEE, physical activity energy expenditure; TEF, thermic effect of food; CIT, cold-induced thermogenesis; BMR, basal metabolic rate. Data referent to Paper III.
In Paper III, PA was quantified indirectly from a kinematic perspective: mice were positioned in cages that transmit an animal’s spatial information to a receptor; changes in position were considered as movement caused by PA. However, although being an indirect method, the analysis of the generated data has yielded very
interest-0 0.2 0.4 0.6
Light Dark Light Dark
EE ( kc al/ h) 33°C 21°C 0 0.2 0.4 0.6 0 500 1000 EE (kcal/h) Activity (counts/h) Dark Light PAEE TEF CIT BMR TEE 0 0.2 0.4 0.6
Light Dark Light Dark
TE E (kc al/h) 33°C 22°C 0 0.2 0.4 0.6 0 500 1000 TEE (kcal/h) Activity (counts/h) Dark Light PAEE TEF CIT BMR TEE
ing results. As demonstrated in Figure 2, PA can be positively associated with an in-creased body temperature, and the temporal gap between PA and inin-creased core tem-perature of the mice was found to be approximately 4 min (Lateef et al., 2014). In Paper II, a correlation demonstrating the effects of PA on body temperature allows for a clearer definition of the anapyrexic phenotype of BRS-3 knockout mice, which is most easily detectable during low levels of activity.
A further analysis of the energetic costs of PA can be made by measuring a mouse’s O2 consumption and CO2 release in an indirect calorimeter, and associating
this data with the values of activity (Figure 3). This way, the value where the activity regression line reaches its Y intercept can be assumed to be the total energy expendi-ture minus the PAEE (Resting metabolic rate). Additionally, when the values of PAEE are divided by PA, one can obtain the values for the specific caloric cost per unit activity (as presented in Paper III).
3.3 Cold-induced thermogenesis
Cold exposure is a hazard to homeothermic animals. It is important to notice, though, that cold does not exist as a physical entity. Instead, it is perceived by an organism as the feeling of heat loss from its body to an environment that happens to be at a lower temperature. Whenever a homeothermic endotherm does not generate enough basal heat to sustain its Tb, some extra amount has to be generated. The energy
expenditure related to this heat production is therefore termed cold-induced thermo-genesis (CIT).
Brown adipose tissue (BAT) has as its primary function the maintenance of body temperature through the combustion of metabolic substrates. This happens be-cause of its unique capacity to uncouple thermogenesis from the synthesis of ATP, thus creating a highly inefficient mechanism by which heat is released without mac-roscopic mechanical work being performed (Nedergaard et al., 2001). In BAT, un-coupling protein 1 (UCP1) has recently been proposed to exist as a functional helical tetramer anchored in the inner mitochondrial membrane (Hoang et al., 2013). When bound by free fatty acids (which reach high intracellular concentrations during lipol-ysis), the nucleotide inhibition of UCP1 and proton transport across the mitochondrial membrane can occur (Cannon and Nedergaard, 2004). When the proton gradient is
dissipated, heat is produced (as indicated e.g. by increased Tb in Figure 4C (of note,
thermogenesis does not necessarily increase Tb since heat can in some situations be
dissipated)). To conceptualize this form of thermogenesis, one could think about chemical potential energy (the gradient) causing protons to be moved at high speed through the membrane. This mechanical force causes molecular agitation, perhaps because of UCP1 molecular vibration or by attrition/collision of protons with atoms on the other side of the membrane. Because one definition of temperature is the state of molecular agitation in a system, this kinetic agitation in this scenario represents heat itself.
Figure 4. Stimulation of nonshivering thermogenesis. Cold-induced thermogenesis was
sim-ulated by injecting CL-316,243 (β3-adrenoceptor agonist) in ambulatory wild type mice at 30°C. (A) Energy expenditure increases as brown adipose tissue becomes activated. This is accompanied by (B) decreased respiratory quotient (indicating increased net lipolysis) and (C) increased body temperature. Data originally from Paper II.
For lipolysis to occur, causing fatty acids to trigger UCP1-dependent ther-mogenesis in BAT, the tissue undergoes adrenergic activation by the sympathetic nervous system (Hardman and Hull, 1970). Norepinephrine present in nerve endings (Cottle and Cottle, 1970) is released and binds to several receptors, the most promi-nent being β1- and β3-adrenoceptors (Bengtsson et al., 2000). Interestingly, β3 recep-tors may also be used to activate thermogenesis in human BAT (Cypess et al., 2015).
It is interesting to ponder on the reason why mammals have evolved to pro-duce heat preferably from BAT. While muscle shivering is known to be fully capable to warm up the body in the absence of UCP1 (Golozoubova et al., 2001), it seems to have deleterious long-term effects, causing mortality rates to be higher over prolonged periods of time (Golozoubova et al., 2001). The reason for this is not very clear, but
it is possibly related to intracellular muscle damage (Aydin et al., 2008). It can be imagined that brown adipocytes that evolved to generate heat will possess additional lines of defense against heat shock damage and oxidative stress caused by their own chemical reactions. It may also be that muscle tissue has not had the same pressure to cope with constant shivering, as organisms usually have to endure only temporary cold stresses. Additionally, it is natural that shivering temporarily decreases the effec-tivity of the muscle and alters coordination. In the wild, proper motor control is not only good for an animal, but fundamental to define life and evolution. It is unlikely that an animal caught during substantial shivering will have the same fighting capacity to avoid predation or to swiftly respond to environmental danger. On the other hand, BAT thermogenesis is not easily perceptible, and is not known to overlap with or compromise any other function of the body. Therefore, this could be considered an evolutionary advantage of nonshivering over shivering thermogenesis.
3.4 Basal metabolic rate
Also known as basal energy expenditure (Trumbo et al., 2002), the common understanding of this cost is that it represents the energy necessary to “keep the system working”. Most likely, it is associated with the costs for the enzymatic machinery to convert substrates, as well as to energy necessary for the turnover of proteins and organelles. In any case, the basal metabolic rate (BMR) can be thought of as the en-ergy required for an organism’s homeostasis at its lowest level of necessity: at rest, in a post-absorptive state, at thermoneutrality and euthermic. This definition ultimately excludes the thermic effect of ingested food, cold-induced thermogenesis, as well as costs related to physical activity. In Paper III, we added an extra requirement for the measurement of BMR: that the animal shall be in its “inactive” phase of the day (i.e. light phase for mice). This was made to ensure the validity of the idea of “lowest energy necessary”, since circadian alterations in body temperature could affect the quantification of BMR. The energy expenditure caused by pregnancy, lactation and growth are also not included in this definition, although it is possible to bend the ri-gidity of this rule and discourse on how, e.g., pregnancy would affect the BMR (Lof et al., 2005, Forsum and Lof, 2007).
4 Central Regulation of Body temperature
4.1 Body temperature setpoint
Endothermic animals tend to maintain their body temperatures within a strictly regulated range (exemplified in Figure 5A). The conceptualization of a body temperature setpoint is old and has been much debated, mostly from a biological per-spective. Interestingly, the validation of energy expenditure data can make use of the setpoint concept from a thermodynamic perspective, and increase understanding of heat balance mechanisms.
Figure 5. Physiological oscillation of body temperature.
Firstly, it is important to define the real body temperature (Tb) values
meas-ured from the animal. In our case, telemetry devices implanted in the intraperitoneal cavity transmitted real time data on the core Tb while mice were analyzed inside in-direct calorimeters. Those values were compiled to define the average Tb during dark or light phases of the day over a range of ambient temperatures. The values were close to 37 °C during the dark and around 36 °C during light phase. Of note, mice are noc-turnal animals, being awake and active mostly during the dark phase. As ambient tem-perature (Ta) decreases, mice tended to present lower Tb, and presumably equally
de-creased energy expenditure (EE). Of note, although in my writings I consider this decrease to be a regulated form of hypothermia, most scientists would disagree with this interpretation and consider this phenomenon to be caused by a failure in perform-ing thermogenesis at higher levels of demand. Nevertheless, points used for further
35 36 37 38 0 10 20 30 B od y t em p eratu re ( °C) Ta (°C) Dark Light
A
B
analysis of EE were those between collected at the stable range of 18-28 °C (Paper III), which is methodologically acceptable according to both interpretations.
If the simultaneously measured values of EE are plotted against the Ta where
they were measured, a line can be drawn and extrapolated to the X intercept. This value (when X = 0) is conceptualized to represent the defended body temperature (dTb), according to the following reasoning: in order to maintain Tb stable, the
organ-ism needs to produce heat (by burning substrates present in the food or internal re-serves) at the same rate as heat is lost from the body to the environment (Scholander et al., 1950a). If the Ta decreases but Tb is kept stable, metabolic costs should increase
in near perfect linearity, according to the principles described by Fourier’s law of heat conductance. Therefore, heat exchange between the body and the environment is sup-posed to be proportional to the temperature gradient at these points. Accordingly, the point where heat generation (a surrogate for heat loss under the described conditions) is zero (X intercept) indicates the temperature where organism and environment are in thermal equilibrium, that is, the dTb.
This elegant method has been used for over half a century for the analysis of several biological parameters, such as the rate of heat loss in an organism and the definition of the thermoneutral zone of an endotherm (Scholander et al., 1950a). Nev-ertheless, even though the theory behind the method is perfectly sound, its use has been shown to be far from banal. The analysis of total energy expenditure hardly ex-trapolates into dTb values that match the measured Tb, and there have been
controver-sies in the question of whether different compartments of heat production (e.g. TEF, CIT and PAEE) would substitute each other, undermining attempts to calculate indi-vidual contributions (Virtue et al., 2012). For these reasons, our analysis was based on validating the energy expenditure compartments data and their extrapolated dTb by
using the actual Tb values as compass. According to this, the closest approximation is
achieved by excluding the PAEE from total energy expenditure lines. This decreased the analysis error by 0.5 °C and 3.5 °C on data acquired during light or dark phases, respectively. It is uncertain, though, if values from TEF should be included or ex-cluded from the analysis, since it is difficult to find a biological rationale for it. Any-how, our analysis seems to create a paradox: the best extrapolated dTb is found when
PAEE is subtracted from total energy expenditure, but Tb (used as a reference for the
violation of thermodynamics implies that our application of Newtonian physics to liv-ing organisms is somehow flawed. Possible explanations for this error may lie in 1) the principles that insulation (the concept given to the mechanisms limiting heat loss) is maximally recruited below thermoneutrality, or that dTb represents a single value
“desired” by the central nervous system. If dTb were to be a stable value to be kept,
then the extra heat generated under some level of cold exposure would be easily dis-sipated to maintain a stable Tb. At the same time, other sources of heat generation
(included in the concept of cold-induced thermogenesis) would be easily shut down, neutralizing the costs of activity below thermoneutrality (as previously proposed (Virtue et al., 2012)).
4.1.1 Setpoint shift: fever
Perhaps the most straight-forward example to describe an elevation in the body temperature set-point is fever, a well-known event for all of us. It is character-ized by increased Tb, the feeling of cold, and it is usually associated with an infectious
state. Fever is not, though, simply represented by a body that happens to be at a higher-than-average temperature (i.e. hyperthermia). Its definition requires the organism to “want” to be warmer, thus characterizing a shifted central setpoint.
4.1.2 Setpoint shift: physical activity
In contrast to the hypothesis that exercise would be “free” in cold, PA seems to have its own costs, implying that a new Tb is aimed at during activity (Figure 6).
This claim is equivalent to proposing that Tb increases in a fever-like fashion during
exercise. To estimate its magnitude, hard evidence is necessary and will be provided as follows: if the setpoint, or dTb, is altered during activity, then this effect (increased
Tb) should be seen regardless of the environmental temperature. This happens to be
the case, as demonstrated in Figure 5B, where the measured activity positively corre-lated to the Tb over a wide Ta range, including those temperatures below the
ther-moneutral zone. Data pointing at the same direction were provided in Figure 2, when mice analyzed at 21 °C (well below thermoneutrality) increased Tb with exercise.
Once more, if the increased Tb was only a side effect of activity, and the heat
generated simply a by-product of muscle contraction, then there would be no reason for PA’s effects to be seen in cold.
From a metabolic perspective, heat generation in cold is expen-sive and the energy would not be wasted to increase Tb over a stable
setpoint. The biological implica-tion of this proposed paradigm shift is that, when searching for the anatomical origin for exer-cise-related metabolism (i.e. PAEE), we may have to look fur-ther than muscle, possibly into or-gans that possess a high thermo-genic potential such as liver and brown adipose tissue.
It is interesting to note that the theory of increased Tb
set-point during activity does not necessarily conflict with the concept of thermoregula-tory heat substitution, postulated to occur at various levels in different species below thermoneutrality (Humphries and Careau, 2011). In fact, the shape of our curves sug-gests that a plateau is reached at high levels of PA. When activity-related changes in energy expenditure (Figure 3) or Tb (Figure 2) are plotted, the best fitting trendlines
are not linear, but polynomial. This is very likely due to the heat substitution occurring at high intensity exercise (high PA over time), when (most probably) CIT mechanisms would gradually shut down once the new Tb setpoint is achieved. In this case, it could
be postulated that heat substitutions starts occurring when the core Tb is around 1 °C
higher than the resting dTb, the latter varying according to circadian rhythm. The
evo-lutionary advantage for the higher temperature seems to lie in biomechanical improve-ments of muscle function (James, 2013).
Figure 6. Variation of the energetic costs of physical activity in relation to ambient temper-ature. Caloric expenditure related to a single
amount of ambulatory activity is higher in cold. The lower basal Tb of mice in cold demands a
higher energy expenditure for the physical activity Tb setpoint to be reached (data from Paper III).
4.1.3 Setpoint shift: circadian variation
Following the discussion on setpoint-driven changes in Tb, we arrive at an
expected aspect of Tb fluctuation: circadian variation. Much has been argued about
the daily variations in the Tb of mammals, including whether it is centrally regulated
(e.g. via hypothalamic pathways) or simply an effect of the metabolic heat production related to activity and food intake. Circadian variation of Tb seems to be caused by a
central setpoint shift. Were it not to be the case, then below thermoneutrality, there should be no increased Tb or higher energy expenditure during the active phase (in the
case of mice, the dark phase, as demonstrated in Figure 7).
Figure 7. Energy expenditure related to circadian variation of body temperature. The
cir-cadian variation in Tb is associated with variations in activity and thermic effect of the food. This proportion is kept stable across the entire spectrum of analyzed ambient temperatures, supporting the concept of a coordinated increase in the Tb setpoint.
In paper III, we have measured the specific costs of the compartments of energy ex-penditure during light and dark, as well as the variation in Tb. This way, it became
possible to define the sources of the heat produced (Figure 7). At most ambient tem-peratures, both physical activity and thermic effect of the food seem to contribute similarly to the higher “active phase” Tb, while there is a possibility for other sources
to contribute, presumably cold-induced thermogenesis. The variations in energy ex-penditure (dark-light Δ) are proportional to the ΔTb, making the cost of keeping the
body warmer during the active phase to look amazingly stable over the full range of tested ambient temperatures (the cost is approximately 0.1 kcal/h/°C). It is important to note that the Q10 effect is most likely not involved in the altered metabolic rate
cause by changes in temperature setpoint (Heldmaier and Ruf, 1992).
0 0.2 0.4 0.6 0.8 1 1.2 0 10 20 30 TE E (k cal/h ) Ta(°C) Dark Light 0 200 400 600 0 10 20 30 Ac tiv ity (c ou n ts /h) Ta (°C) Dark Light 0 0.1 0.2 0.3 4 8 12 16 20 24 28 32 Δ EE/ Δ Tb (kcal/h / C ) Ta(°C) Physical Activity Thermic effect of food Other
The reason behind the circadian variation of Tb is not clear, but its
well-reg-ulated features suggest that there may a functional significance for an organism’s physiology. Future studies may be able to define the optimal temperature of events happening at the cellular level, as well as their significance to functions associated with every specific part of the circadian cycle.
4.2 Neural pathways
The nervous system functions as the most precise and effective way to inte-grate several environmental stimuli in order to swiftly trigger a systemic response. The thermoregulatory system connects different parts of an organism aiming at main-taining temperature homeostasis, according to a centrally-regulated setpoint. It is no secret that “setpoint” is simply a concept used by those investigating the thermal con-trol of endotherms. It arises from the observation that body temperature is kept under seemingly strict regulation, with some level of oscillations around a constant value. The most interesting fact is that oscillations do not happen at random, but instead seem to follow meaningful cycles and situations, as previously described in the sections on fever, physical activity and circadian variation. If one aimed to define an anatomical location for the setpoint, it would have to be an area with enough neuronal input to sense the external ambient temperature, to be sensitive to chemical signals from the body (e.g. toxin-triggered signals during infection), and significant neural output to trigger systemic responses. The hypothalamus, more specifically the preoptic area (POA), qualifies for all these requirements: it receives cutaneous signals of external temperature, which are transmitted through the spinal cord and the lateral parabrachial nucleus, until it arrives to the POA (Nakamura and Morrison, 2011). It also possesses prostaglandin E2 receptors (EP2) (Hosoi et al., 1997, Zhang and Rivest, 1999), which
are involved in the perception of inflammation/infection, and can be triggered2 by the
systemic presence of e.g. bacterial lipopolysaccharides (LPS) (Matsuoka et al., 2003). Once all incoming signals are processed, the resulting neuronal output is given as signals that descend to the dorsomedial hypothalamus and subsequently toward the periphery of the body, causing acute changes in insulation (e.g. vasoconstriction and
2 EP
2 receptors are in fact activated by prostaglandins, which are found in higher blood
piloerection) and heat generation (from muscles and BAT). The thermogenic neuronal pathway is similar for muscle shivering and UCP1 activation in BAT (Nakamura and Morrison, 2011). It is known that animals tend to shiver only when BAT does not suffice to maintain the body warm. This concept can be applied to the late-autumn shivering of humans, which disappears throughout the winter as BAT becomes opti-mally recruited, as well as for UCP1 KO mice, that will shiver indefinitely in the cold.
Figure 8. BRS-3 presence in the central thermoregulatory pathways based on Nakamura’s
ther-moregulatory pathways model (Nakamura and Morrison, 2011), [3H]Bag-2 binding in mouse brain (Guan et al., 2010) and co-localization of BRS-3 expression with neurotransmitters (Zhang et al., 2013). Highlighted boxes indicate the functional findings on BRS-3 KO mice and their association to anatomic locations (Paper II).
It is, therefore, likely that the neuronal distinction between activating one or another form of heat generation may lie in the signal threshold. Following this line of thought, low-intensity signals would easily trigger BAT, but be insensitive for mus-cles. In the absence of BAT, more signals would pass the “muscle threshold”, trigger-ing shivertrigger-ing thermogenesis.
Glu Glu Lateral Parabrachial nucleus Spinal Cord Skin Median Preoptic nucleus Thalamus Neocortex Rostral Raphe GABA PGE2 BRS-3 positive areas Glu GABA Warm-activated circuitry Cold-activated circuitry Excitatory synapse Inhibitory synapse Muscle Shivering
Brown adipose tissue
thermogenesis Skin vasoconstriction 2 BRS-3 expressing neurons
Dorsomedial Hypothalamus
LPS Altered Tb set point Altered temperature cognition Preserved peripheral thermogenic potential Preserved stress-induced hyperthermia
In Paper II, we described the functional alterations of mice lacking the bombesin receptor subtype-3 (BRS-3). The background of this study is that BRS-3 has been shown to influence metabolic functions related to diabetes (Matsumoto et al., 2003, Nakamichi et al., 2004, Feng et al., 2011), while mice lacking this receptor develop long-term mild obesity and have been described to have lowered metabolic rates (Ohki-Hamazaki et al., 1997, Maekawa et al., 2004). Because BRS-3 can influ-ence body temperature (Guan et al., 2010, Guan et al., 2011), we set out to define whether brown adipose tissue plays a role on BRS-3 regulation of body temperature. As highlighted in Figure 8, we found that although BRS-3 KO mice have altered tem-perature recognition (i.e. chose a lower ambient temtem-perature when given the choice), and maintain a constantly decreased body temperature, these changes are most likely caused by an altered neurologic setpoint, since brown adipose tissue thermogenesis was found to be intact when directly tested.
A final consideration of thermoregulatory pathways: as presented in Figure 8 (Nakamura’s model), signals ascend from the thalamus towards the neocortex, where the ambient temperature can be consciously understood by the animal. The ab-sence of known connections between the thalamus and other thermoregulatory centers (i.e. the dorsomedial hypothalamus) gives rise to interesting implications. Assuming that the model is correct, then thermoregulatory behaviors are not only controlled by the cortical recognition of temperatures zones, but at a more instinctive “subcon-scious” level. In this scenario, although the organism may have understood what tem-perature would be more adequate for its present needs, other defense mechanisms may be connected to a deeper sense of well-being related to the thermal zone. It would then be implied that those additional mechanisms may be somewhat related to the limbic system, which is in fact anatomically closer to the thermoregulatory centers than to the cortex. Of course, this reasoning lies within the realm of speculations, but the thought of unexplored mechanisms is too tempting ignore.
5 Maximum thermogenic capacity
In our results, cold induced a decrease in Tb (Figure 5 of this thesis, data from Paper III). However, the hypothermic effect of severe cold is not to be taken for granted. A given Ta may lead to reduced Tb or cause no alteration at all. Therefore the need for some unifying explanation of the data. A possible underlying reason could be that Ta is not the single factor defining heat loss in an organism: the convective air currents, ground conduction, and lost heat being reflected on the surrounding surfaces play a fundamental role in defining how “cold” it actually is.
But instead of presenting a long explanation of the modalities of heat transfer affecting the measurements, the important concept to work on at this point is the bio-logical reason why hypothermia occurs in some well-fed animals but not in others, while all are kept in e.g. 4°C.
As previously cited, heat loss is highly variable at a given Ta, but stable in a determined setting (i.e. experimental hardware setup). As heat loss and heat genera-tion are, below thermoneutrality, theoretically the same value3, a likely biological
ra-tionale for the apparent hypothermia is that heat generation reaches its peak (the max-imum thermogenic capacity of an organism) depending on the experimental design and associated heat loss. Thus, it can be hypothesized that, e.g., doubling the air flow that passes through the mouse being measured in an indirect calorimeter, would in-crease the metabolic demand and heat generation according to the doubled convective heat loss. If the decreased Tb results from the maximum thermogenic capacity having
been reached, then there should be some kind of unifying variable to be applied to the data acquired in different settings.
As a starting point, one could assume some proportionality between basal metabolic rate and maximum thermogenic capacity (Bennett and Ruben, 1979). This is not a trivial assumption in view of BAT function: it is known that UCP1 does not possess constitutive activity (i.e. protons do not leak across the membrane solely due
tempera-to UCP1’s presence), so there is no proportionality between BAT thermogenesis-re-lated metabolism and what is measured in the same tissue at rest. On the other hand, proportionality becomes clearer once additional organs are incorporated to compose a greater metabolic portrait of the organism (summarized by (Hayes and Garland, 1995)).
For conceptualization purposes, let us now focus on the cardiopulmonary and hepatic functions. In order to maintain the high catabolic rates necessary for a day in cold, nutrient intake and processing (gastrointestinal and hepatic functions (Kvist and Lindstrom, 2000)), as well as gas exchange and diffusion (cardiopulmonary func-tion4), have to be significantly increased. This adaptation includes altered physical
dimensions and higher basal organ function. As a fact, cold-acclimated animals adapt visceral organs, have higher metabolic rate, and are expected to have a higher total thermogenic capacity (Nespolo et al., 2001). This way, a concept that naturally devel-ops is that an organism will be able to increase its heat generation to (approximately) a certain fold over its resting metabolism. Therefore, this hypothesis utilizes the con-cept of metabolic equivalents of a task (MET) (Jette et al., 1990). If the resting or basal metabolism is defined as a reference value (equal to 1 MET) then thermogenesis can be observed as the task equivalent to a certain fold of the metabolic reference, be it the resting metabolic rate (RMR), BMR, or other. The main difference between these terms is that BMR does not incorporate the thermic effect of food, while RMR does. Assuming that thermogenesis will be accompanied by increased food consump-tion (and therefore TEF), it can be argued that not much precision will be lost when opting for the use of RMR in place of BMR.
Overall, this hypothesis predicts that 1) mice will be capable of achieving a maximum sustained thermogenic capacity of, e.g. 4 METS. This given value is used without evidence, obviously demanding further research for its actual definition.
2) Whenever a mouse is forced over the maximum sustainable thermogenesis
limit, hypothermia will be evoked as a means to conserve energy.
4 According to Fick’s principle, the maximum thermogenic capacity (Vo
2 max) of a mammal
equals its cardiac output (Q) multiplied by the arteriovenous difference in O2. Hypothesizing
that an active BAT depletes the circulating O2 levels (as it mostly likely does to its immediate
3) In cold-acclimated mice, baseline reference levels of energy expenditure
(this could include several modalities of adaptations) will be increased, allowing for an increased maximum thermogenic capacity. If the principle of proportionality turns out to be correct, the alterations in energy expenditure (both basal and maximum) will not affect the MET value. It is possible, though, that it is necessary to introduce some scaling power to be able to apply this principle to an intraspecies comparison.
4) Heat exchange with the environment (at measurement) will change the
temperature where hypothermia is evoked.
The recognition that the calorimeter setup affects the rate of heat loss, hereby exemplified by the alteration in body temperature at 4°C, gives rise to significant im-plications. Since the same concept is valid for measurements of metabolic rates at 21°C (the standard room temperature), as well as for its comparison to thermoneutral-ity, it seems rather pointless to argue deeply about the numerical effects of environ-mental temperature on metabolic rate. That is, based on a series of experiments, it could be argued that housing mice at room temperature will trigger enough cold stress to increase food intake and O2 consumption by 50%, by 2 fold, or by 2.5 fold. While
the values are of extreme relevance for the interpretation of metabolic data, such dis-cussion is at risk of eventually becoming misleading: in principle, this fold variation is caused by the surrounding physical environment (i.e. the heat loss caused by the experimental setup), as much as by the measured ambient temperature.
6 Heat distribution and insulation
6.1 Blood flow
Perhaps the most important feature allowing multicellular organisms to maintain high levels of metabolism, the circulatory system is crucial for nutrient and gas diffusion, communication between organs (the endocrine system) and for temper-ature regulation. Heat produced in an organ (e.g. BAT) warms up the blood and is carried by convection to other organs, where it is released based on the thermal gra-dient. At the same time, heat loss can be avoided by skin vasoconstriction in distal regions of the body, as is the case for birds’ legs, mammals’ tails, or human limbs exposed to cold. This creates a shelling effect that can be measured as a temperature gradient: extremities are kept colder than vital organs in the thorax and abdomen. On the other hand, skin vasodilation is evoked to allow heat to be released from the or-ganism, as exemplified by the scarlet-colored cheeks of light-skinned runners, at the end of a high-intensity exercise bout. Once the heat is transferred to the body surface, in humans, sweating is triggered to increase evaporative heat loss at higher ambient temperatures (Colin and Houdas, 1965).
In brown adipose tissue, blood flow is locally increased when a larger supply of oxygen and nutrients is needed (Heim and Hull, 1966, Kuroshima et al., 1967, Foster et al., 1980). Additionally, thermogenesis seems to correlate with higher BAT blood flow (Foster and Frydman, 1978). This increase depends on the sympathetic drive received by BAT (Engel et al., 1992), as well as on the production of the vaso-dilator nitric oxide (Nagashima et al., 1994, Nisoli et al., 1997, Sotornik et al., 2012).
Past investigations on BAT blood flow have used diverse methods such as radiolabeled indicators (Bullard and Funkhouser, 1962, Jansky and Hart, 1968), inva-sive cannulation of veins (Heim and Hull, 1966), labeled microspheres (Foster and Frydman, 1978, Ma et al., 1986), laser-Doppler flowmetry (Engel et al., 1992), inject-able fluorophores (Nakayama et al., 2003), PET-scan (Muzik et al., 2013) and ultra-sound (Baron et al., 2012). All cited techniques present some specific drawback: some require terminal procedures, others demand the use of contrast-enhancing agents
(sometimes meaning radioactivity). Therefore, we established the use of high-resolu-tion laser-Doppler imaging, a noninvasive technique that allows for longitudinal, in vivo analysis of subcutaneous adipose tissue blood flow in mice (Paper I).
Figure 9. Measurement of brown adipose tissue blood flow. Imaging of the dorsal region of
a mouse, containing the classic interscapular brown adipose tissue deposit. Tissue blood flow was visualized (A) in the basal state and (B) post norepinephrine injection. Blood flow was assessed by high-resolution laser-Doppler imaging. The establishment and validation of the method are presented in Paper I.
The biological rationale for the increased blood flow in active BAT is clear: high metabolic rates demands a sufficient supply of oxygen and also macromolecules to be used as energetic substrates. Thus, BAT activation is directly associated with higher blood flow. While the concept is correct, a common misconception that easily follows this reasoning is that thermogenesis itself can trigger an increase in tissue perfusion. In Paper I, we describe that UCP1-KO mice, albeit incapable of performing thermogenesis, maintain wild-type blood flow regulation in BAT. This implies that the use of blood flow data as the sole parameter to detect BAT activation is flawed and possibly misleading.
6.2 Insulation
There are many ways one can refer to heat loss and its associated physiology. While “heat loss” per se is the heat transfer from the body to a colder environment, and its unit is understood as “conductance”, the term “insulation” aggregates biologi-cal functions that modulate the rate of heat loss. Normally, birds and mammals defend a body temperature higher than the surrounding environment (Ruben, 1995). When
this difference is small enough so that basal metabolic rate and insulation suffice to stabilize body temperature close to the defended setpoint, this range of ambient tem-peratures is considered to be the thermoneutral zone for that specific organism (Scholander et al., 1950a). When insulation reaches its maximal point (i.e. the organ-ism uses all available strategies to minimize heat loss), cold-induced thermogenesis is triggered to maintain temperature balance.
Figure 10. Relationship between heat generation and heat loss. Body temperature is
main-tained by an intricate balance between heat generation (thermogenesis) and modulation of heat loss (insulation). Dashed line represents the lower critical temperature (LCT). Above the LCT, body temperature is kept stable by the use of dynamic modulation of insulation, until the upper critical temperature is reached and body temperature will invariably increase.
The biological components of insulation can be thought of as being passive or dynamic. The passive class is composed of the rather stable physical insulation, as the thick layer of fat in seals, or the fur coat of an arctic animal. Even though we are now terming these features “passive”, they are by no means immutable. The seal fat can obviously change over time, based on the caloric balance of the animal, and the insulating characteristics of fur can be changed by several fold when submerged in water (Scholander et al., 1950b). These slight variations are, however, still very stable when compared to, e.g. the dynamic changes mammals can perform in cutaneous vas-cular tonus, when attempting to modulate the rates of heat loss (Stewart, 1913, Ingram and Legge, 1971, Bornmyr et al., 2001). Other than being an abstract physiological parameter, insulation forms a fundamental triad together with thermogenesis and body temperature (Figure10) (Scholander et al., 1950a). Defective dynamic insulation in
mice (in this case, decreased capacity to perform tail vasoconstriction, leading to in-creased heat loss) has recently been shown to cause an inin-creased demand for brown adipose tissue thermogenesis (Warner et al., 2013, Warner and Mittag, 2014).
In Paper III, we estimated the insulation of mice in the range 4 to 33 °C. The dynamic insulating capacity, calculated as the amount of heat loss (therefore termed conductance), can be estimated by dividing the energy expenditure by the temperature gradient between body and environment. Since energy expenditure is “corrected” per temperature, this method allows for a more precise estimation of the lower limit of thermoneutrality, as well as for the adaptive changes in dynamic insulation occurring while energy expenditure is stable (i.e. within the thermoneutral zone). Additionally, the heat loss after death could be calculated by a combination of measurements of post-mortem body temperature decay rate and the heat accumulated by fat and lean masses. According to these measurements (and comparison with in vivo rates of heat loss), dead animals lose heat at a rate approximately 5-fold higher than when alive. Since the physical insulation was not altered after death, these data serve as an exem-plification of how efficient mammals are in conserving body temperature by dynamic means (further discussion in Paper III).
7 Body composition and energy homeostasis
7.1 Scaling caloric costs
Over time, scientists have attempted to find unifying mathematical factors to explain and calculate the energy necessary to supply a determined amount of life. Past scaling approaches include the association of energy expenditure with cardiac func-tion (Bishop and Spivey, 2013), nutrient distribufunc-tion (West et al., 1997), body-brain size (Yu et al., 2014), and most classically, with factors based on a direct conversion from body mass5 (Kleiber, 1947, Blackmore, 1969, Parizkova et al., 1984, Donhoffer,
1986, Refinetti, 1989).
It is still unclear whether a scaling factor based on Kleiber’s law (¾) would be ideal to normalize energy expenditure, or if exponentials closer to the surface-vol-ume ratio6 (⅔) would be more appropriate. There has been significant research done
on these factors, with occasional argumentation being sparked by the proponents of each factor (White and Seymour, 2003, Packard and Birchard, 2008).
There have also been attempts to unify different variables defining the scal-ing of energy expenditure (White and Kearney, 2013), or even to explain deviation in factors based on trivial issues such as the analyzed sample size (White and Seymour, 2005). A general similarity connecting the studies is an explanation of energy ex-penditure based on unifying mathematical factors that can be extrapolated over a range of species that span over several orders of magnitude (in body mass). On the other hand, our work has attempted to analyze the energy expenditure of mice at a smaller scale of variability. With this intent, different components of heat generation (or heat loss) have been correlated to different parts of body composition: lean and fat mass of each mouse (Paper III). This dualism is of course not a rule of nature, but a human definition that serves the purpose of distinguishing between the metabolically active
5 The list of references presented here is very modest and serves the sole purpose to guide future
reading. An attempt to summarize all studies that have been performed on scaling would take the length of a full thesis, and even then some questions would very likely remain.
6 The two-thirds-power scaling is based on Euclidean geometry, where e.g. a sphere will vary
its surface by two thirds of its volume change. Its application to mammals refers to the concept of heat loss to the environment (surface) as being determinant of energy expenditure.
lean mass, and the inert lipids that compose the fat mass. The following sections pre-sent the stronger associations encountered in our analysis: fat mass and heat loss, as well as lean mass and basal metabolic rate.
7.1.1 Heat conductance and fat mass
In paper III (Figure 11A of this thesis), we describe the strong positive cor-relation between fat mass and conductance, while lean weight does not seem to affect the rate of heat loss. These data are slightly counterintuitive, since fatness is com-monly associated with a capacity to insulate the body against heat loss (i.e. there should have been a negative correlation). Therefore, some discussion on the possible causes of this phenomenon is necessary. One possible scenario is to assume fat weight to be simply the body composition parameter that best reflects body weight variation within this group of animals. Body weight, in turn, is related to the body size of the organism. In this straight-forward reasoning, the association between fat weight and increased conductance is caused by the increased surface area.
Figure 11. Correlation between body composition and thermal balance. (A) Positive
cor-relation between basal metabolic rate and lean weight. (B) Association between fat mass and conductance (rate of heat loss) of mice. Data presented in Paper III.
Interestingly, while one could wonder whether a fat mouse would be more protected against cold, the present paradox is that fatness will also increase surface area and heat loss. That is, the counterintuitive result is that fat animals happen to have less insulation than lean, and require extra heat to be generated at similar levels of cold exposure. This heat produced falls within the classification of cold-induced ther-mogenesis. Accordingly, it is to be expected that the BAT of fat animals exposed to
cold will be more developed (i.e. more classically recruited) because of their higher heat loss rates.
Whether or not the fat animals feel less cold is difficult to know. Perhaps the readily available deposit of energetic substrates cause the body to struggle less when performing thermogenesis, even at slightly higher heat generation levels than those necessary for leaner peers.
An alternative explanation for the fat weight association with heat conduct-ance invokes the concept of diet-induced thermogenesis. This hypothesis states that animals receiving high-fat diets (or other hypercaloric foods) will demonstrate in-creased thermogenic potential (Rothwell and Stock, 1979). In the case of our mice, the only thermogenic effect of high-fat diet was observed below thermoneutrality. This detail is in disagreement with previous data acquired from measurements of UCP1 KO mice, where it has been suggested that diet-induced thermogenesis might only be visible within the thermoneutral zone (Feldmann et al., 2009). Additionally, there is some level of evidence suggesting that DIT would in fact substitute CIT (Dauncey, 1981). Therefore, a new postulation of the concept is required to explain these data.
If it happens to be the case that the higher energy expenditure of fatter ani-mals is only seen at some level of cold exposure (i.e. at subthermoneutral tempera-tures), then diet-induced thermogenesis has to be a function of 1) BAT recruitment caused by the diet, and 2) the sympathetic drive received by BAT during cold expo-sure. In support of this theory is the fact that animals fed high-fat diet have higher O2
consumption levels when injected with similar doses of norepinephrine (Feldmann et al., 2009). In this case, the sympathetic drive (simulated by NE injection) is the same for both groups, but intrinsic characteristics of the tissue elicit different responses.
If the last postulate is correct, then drugs that mays be able to recruit BAT could be used in association to mild cold exposure with the intent to raise energy expenditure. In fact, were this principle to be valid for humans, would obese individ-uals benefit from cold exposure more than leaner ones? Of course, this line of thought is meant to extrapolate the concepts to ponder upon its practical implications. The truth is that only future research will be able to provide solid answers to this question.
7.1.2 Basal metabolic rate and lean mass
While the connection between fat mass and energy expenditure can be con-troversial, other associations are relatively simple. This is the case for the intraspecies scaling of basal metabolic rate and lean mass (Figure 11B).
Earlier studies have characterized the proportionality between the lowest necessary costs to maintain life (BMR) and the portion of body composition that rep-resents the metabolically-active tissues (Miller and Blyth, 1952, Cunningham, 1982). Our data come as confirmation of this principle, and even though the analyzed range of samples (20 - 27g lean mass) is relatively small, there is no doubt about the positive correlation (Paper III). The practical implication for metabolic experimentation is that basal and resting levels of energy expenditure at thermoneutrality can be rather safely normalized to the lean body mass. This would not be the case with a direct normali-zation to body weight, as fat mass has a low influence on BMR (Figure 11B) (Bernstein et al., 1983, Cannon and Nedergaard, 2011).
7.2 Measurement of glucose tolerance
Having defined how body composition affects calorimetry measurements, it is possible to further explore the ways in which scaling modifies the interpretation of metabolic health. Glucose tolerance test is widely used to define the capacity of an organism to clear glucose from the blood. The setup consists of measuring the blood glycaemia after a period of fasting (i.e. 6-7 h in our experiments), providing the animal with a glucose load (orally or injected), and measuring the excursion curve. When different treatment groups are compared, measured points are compared to define the speed at which values return to close-to-baseline levels. A decrease in this lowering capacity is associated with diminished tissue uptake of glucose, which in turn tends to represent an impairment in insulin signaling and diabetes.
In experimental models, it is usual to inject mice with 1 or 2 g glucose per kg body weight at the start of the experiment. It is unclear for me how this was first defined, but it is a fact that animal experimentation follows a general mentality of adjusting doses per body weight. While logical at first, this may give rise to scaling issues that affect data interpretation.


![Figure 8. BRS-3 presence in the central thermoregulatory pathways based on Nakamura’s ther- ther-moregulatory pathways model (Nakamura and Morrison, 2011), [3H]Bag-2 binding in mouse brain (Guan et al., 2010) and co-localization of BRS-3 expressi](https://thumb-eu.123doks.com/thumbv2/5dokorg/4289977.95773/29.701.104.600.257.632/presence-thermoregulatory-nakamura-moregulatory-nakamura-morrison-localization-expressi.webp)


