ADVANCING UNDERSTANDING AND PREDICTION OF REDEVELOPMENT IMPACTS ON STORMWATER
RUNOFF IN SEMI-ARID URBAN AREAS
by
ii
A thesis submitted to the Faculty and the Board of Trustees of the Colorado School of Mines in partial fulfillment of the requirements for the degree of Doctor of Philosophy (Hydrology). Golden, Colorado Date______________________ Signed: __________________________ Chelsea L. Panos Signed: __________________________ Dr. Terri S. Hogue Thesis Advisor Golden, Colorado Date_______________________ Signed: __________________________ Dr. Jonathon O. (Josh) Sharp Director Hydrologic Science and Engineering
iii ABSTRACT
As the global urban population grows, cities are densifying by redeveloping previously developed spaces. “Smart growth” through redevelopment is increasing the impervious coverage of urban areas and impacting the hydrologic regime in uncertain ways. Cities are looking to update current stormwater management criteria, which often exempt redevelopments, based on data-driven decisions informed by watershed-scale hydrologic modeling. Future stormwater management strategies must also consider climate changes and flood mitigation via low impact development (LID). Using the Berkeley neighborhood of Denver, Colorado, we investigated the impacts of redevelopment land use change, along with climate change and LID implementation, on stormwater quantity using a high-resolution, calibrated Stormwater Management Model for PC (PCSWMM). The model includes 170 subcatchments and parcel-scale predictions of impervious cover change for three scenarios of future redevelopment.
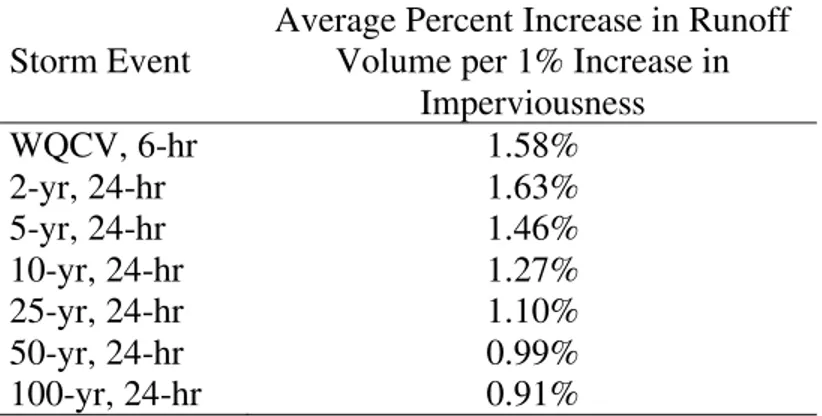
Simulations of design storms for multiple redevelopment scenarios predict that an increase of 1% in impervious area from redevelopment will increase surface runoff by 1.63% for the 2-yr, 24-hr design storm and by 0.91% for the 100-yr, 24-hr design storm resulting in greater relative flood risks for smaller storm events. When assessing the effectiveness of LID to mitigate increases in runoff from redevelopment, we found that model sensitivity to LID siting and routing parameters can impact the potential for meeting regulatory compliance. Relative sensitivity of runoff volume output to area treated and LID placement was found to be on average 3.0 and 11.2 times higher than the seven most sensitive physical LID and subcatchment parameters. Misunderstandings of model sensitivities can lead to costly decisions that are made based on modeling results. Finally, when assessing the combined impacts of redevelopment land use change and climate change on stormwater dual drainage system resilience, it was found that the system may be able to handle increases in runoff and flooding from redevelopment land use changes or climate changes alone, but likely not both. However, distributed LID implementation in conjunction with redevelopment provides a unique opportunity for increasing system resilience with a small LID footprint. All findings indicate a need to lower the current area threshold for requiring stormwater management with redevelopment within updated stormwater management criteria.
iv
TABLE OF CONTENTS
ABSTRACT ... iii
LIST OF FIGURES ... vii
LIST OF TABLES ... xii
CHAPTER 1 INTRODUCTION ...1
1.1 Background ...1
1.1.1 Urbanization and Stormwater ...1
1.1.2 Infill Development/Redevelopment ...1
1.1.3 Low Impact Development ...2
1.1.4 Stormwater Criteria and Urban Drainage Design ...3
1.1.5 Climate Change ...4
1.2 Research Objectives, Questions, and Hypotheses ...4
1.2.1 Objective 1: Quantify Stormwater Runoff in a Redeveloping Neighborhood ...5
1.2.2 Objective 2: Evaluate Model Sensitivity to LID Siting and Routing Parameters ...5
1.2.3 Objective 3: Assess Resilience to Land Use and Climate Changes ...6
1.3 References ...7
CHAPTER 2 HIGH-RESOLUTION MODELING OF INFILL DEVELOPMENT IMPACT ON STORMWATER DYNAMICS IN DENVER, COLORADO ... 10
2.1 Abstract ... 10
2.2 Introduction ... 10
2.3 Methods ... 14
2.3.1 Study Site and Data Sources... 14
2.3.2 Model Application ... 17
2.3.3 Initial Parameter Estimates ... 18
2.3.4 Storage Nodes ... 18
2.3.5 Calibration and Validation ... 19
2.3.6 Development Scenarios ... 21
2.4 Results ... 24
2.4.1 Calibration and Validation ... 24
2.4.2 Development Scenarios ... 26
v
2.6 Conclusions ... 34
2.7 Acknowledgements ... 35
CHAPTER 3 SWMM SENSITIVITY TO LID SITING AND ROUTING PARAMETERS: IMPLICATIONS FOR STORMWATER REGULATORY COMPLIANCE ... 39
3.1 Abstract ... 39
3.2 Introduction ... 40
3.3 Methods ... 43
3.3.1 Study Area ... 43
3.3.2 Model Development ... 44
3.3.3 LID Siting and Routing Parameter Sensitivity ... 48
3.3.4 LID Sizing Scenarios ... 50
3.3.5 Impervious Area Adjustments with LID Placement ... 52
3.3.6 Comparisons to Physical LID and Subcatchment Parameter Sensitivity ... 53
3.4 Results ... 54
3.4.1 Runoff Volume Results ... 54
3.4.2 Flood Volume Results ... 57
3.4.3 Comparisons to Physical LID and Subcatchment Parameter Sensitivity Results ... 59
3.5 Discussion... 61
3.5.1 Counter-acting Model Processes ... 61
3.5.2 Implications for Stormwater Management Regulatory Compliance ... 63
3.5.3 Modeling Recommendations ... 64
3.6 Conclusions ... 65
3.7 Acknowledgements ... 67
3.8 References ... 67
CHAPTER 4 ASSESSING RESILIENCE OF A DUAL DRAINAGE URBAN SYSTEM TO REDEVELOPMENT LAND USE CHANGE AND CLIMATE CHANGE ... 72
4.1 Abstract ... 72
4.2 Introduction ... 73
4.3 Methods ... 75
4.3.1 Study Area ... 75
4.3.2 Model Application ... 76
4.3.3 Redevelopment Land Use Change ... 79
vi
4.3.5 Resilience Assessment ... 80
4.3.6 LID Scenarios ... 85
4.4 Results ... 88
4.4.1 Minor Storm Event Tipping Points ... 88
4.4.2 Major Storm Event Tipping Points ... 92
4.5 Discussion... 95
4.5.1 Minor and Major Event Differences ... 95
4.5.2 Adaptive Capacity from LID Implementation ... 96
4.5.3 Redevelopment as an Opportunity for Building Resilience through LID... 97
4.6 Conclusions ... 98
4.7 Acknowledgements ... 99
4.8 References ... 99
CHAPTER 5 CONCLUSIONS ... 103
5.1 Summary of Findings ... 103
5.1.1 Objective 1: Quantify Stormwater Runoff in a Redeveloping Neighborhood ... 103
5.1.2 Objective 2: Evaluate Model Sensitivity to LID Siting and Routing Parameters . 104 5.1.3 Objective 3: Assess Resilience to Land Use and Climate Changes ... 105
5.2 Broader Impacts and Contribution to the Science Community ... 107
5.3 Recommendations for Revised Stormwater Management Criteria ... 108
5.4 Recommendations for Future Work ... 108
5.5 References ... 109
APPENDIX A PERMISSIONS ... 110
APPENDIX B CHAPTER 3 SUPPLEMENTAL INFORMATION ... 114
APPENDIX C SUPPLEMENTAL ELECTRONIC FILES ... 115
vii
LIST OF FIGURES
Figure 2.1 Example aerial image of infill development occurring along Tennyson Street in the Berkeley neighborhood of Denver, CO. The left side of the image shows single family homes with lawns, while the right side illustrates the increase in impervious area of redeveloped multi-family units. (Source: Google Maps) ... 12 Figure 2.2 Berkeley neighborhood catchment study area including the existing storm
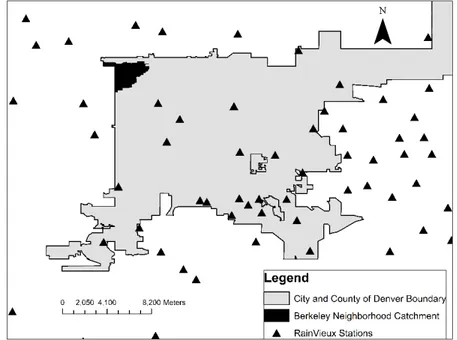
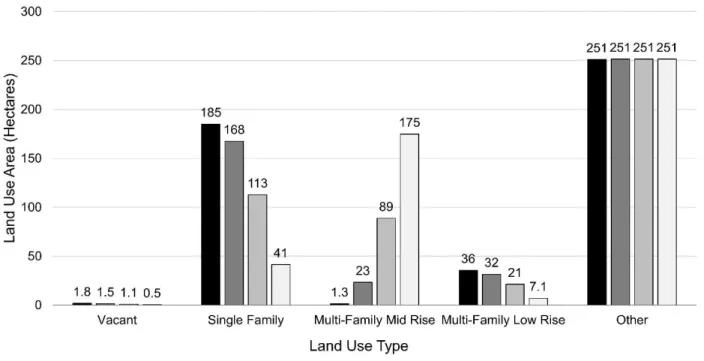
sewer network, existing BMPs, modeling points, and modeled major basins. Smaller subcatchments are outlined in each basin. ... 15 Figure 2.3 Map of Denver's regional RainVieux tool precipitation gauge network………….15 Figure 2.4 Land use area by redevelopment scenario. 251 hectares (60% of the full
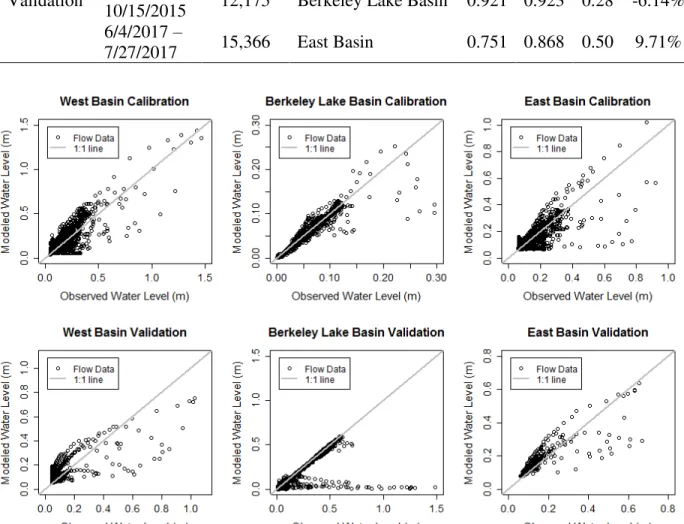
watershed) are not redeveloped and therefore stay constant. ... 23 Figure 2.5 One-to-one plots of observed versus modeled outlet water level for the West,
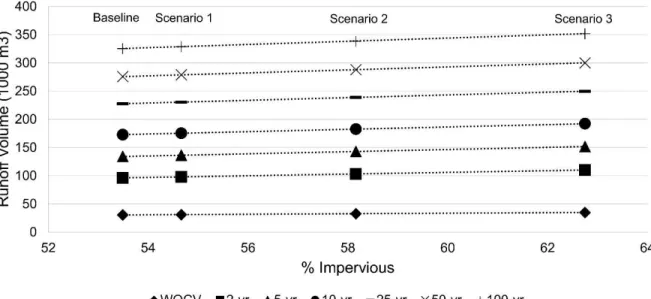
Berkeley Lake, and East Basins for calibration and validation. Points along the one-to-one line indicate a perfect model fit. ... 25 Figure 2.6 Percent increase in total surface runoff volume from baseline for each design
storm event by scenario. Note that the WQCV is a 6-hr event, while all others are 24-hr. ... 27 Figure 2.7 Discharge hydrographs for the peak three hours of the 2-yr, 10-yr, and 100-yr,
24-hr storms for the Baseline scenario and Scenario 3. ... 28 Figure 2.8 Relationship between increased impervious area and stormwater runoff
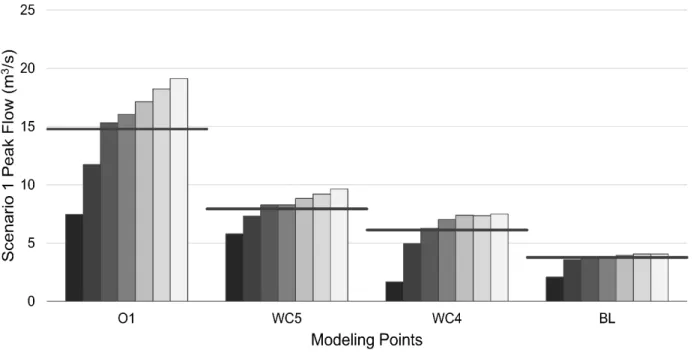
volume………....28 Figure 2.9 Scenario 1 peak flows at four modeling points for the simulated design storms.
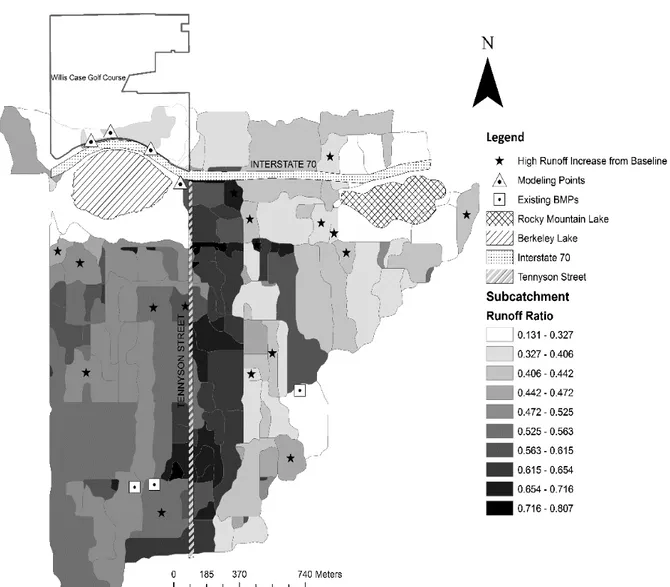
Maximum peak flows at each modeling point (based on storm pipe parameters and capacities) are shown by horizontal lines. ... 29 Figure 2.10 Spatial map of runoff ratios by subcatchment for the 2-yr, 24-hr storm event
Scenario 1 simulation. ... 31 Figure 2.11 Spatial map of total flood volume (in m3) by node (storm sewer manhole) for
the 2-yr, 24-hr storm Scenario 1 simulation. Flooding occurs throughout the catchment and is calculated based on the amount of stormwater that exceeds the storm sewer capacity at the node. ... 32 Figure 2.12 Implications of beneficial use of stormwater runoff on water supply needs
viii
provided and number of Denver residents’ outdoor water use (May through September) served. ... 34 Figure 3.1 Berkeley neighborhood catchment study area including the existing storm
sewer network, catchment outlet (modeling point O1), lakes, and delineated subcatchments. ... 44 Figure 3.2 Spatial distribution of redeveloped and unchanged parcels for the redeveloped
condition of the Berkeley neighborhood catchment. One bioretention (BR) unit was placed on each of the 1,507 redeveloped parcels for all low impact
development (LID) configurations. ... 46 Figure 3.3 Schematic of a bioretention (BR) unit as modeled in this study. ... 47 Figure 3.4 Conceptual schematic of runoff routing in PCSWMM (a) without and (b) with
LID implementation for LID placement on impervious area and outflow routed to outlet configurations. DCIA = directly connected impervious area; UIA = unconnected impervious area; TIA = total impervious area; LID = low impact development... 48 Figure 3.5 Depiction of combinations of LID siting and routing parameterizations into 32
possible configurations under four different LID sizing scenarios. Each branch of the “tree” represents one configuration (e.g., capture all area, LID placed on pervious, outflow routed to outlet) tested for each LID sizing scenario. LID sizing refers to the implementation of bioretention (BR) on redeveloped parcels in which the surface area of the BR units was sized to 1%, 2%, 5%, and 10% of the redeveloped parcel area. ... 50 Figure 3.6 Aerial imagery and simplified representation of the pervious and impervious
areas of (a) a baseline condition parcel and (b) a redeveloped condition parcel. Panels (c) through (f) illustrate a conceptual redeveloped parcel for each of the area treated/captured and LID placement configurations. Dotted lines show the pre-redevelopment building outline. Runoff from gray areas are captured and treated by LID. (Imagery © 2019 Google) ... 51 Figure 3.7 Percent change in total watershed runoff volume between each LID
configuration and the baseline scenario (no redevelopment or BR
implementation). Negative percentages shown in blue shading meet baseline conditions; positive percentages shown in red shading do not meet baseline conditions. Darker blue and red shading indicates values that are further away from baseline conditions (0% change). The “A” and “B” labels indicate an example of two configurations that achieve the same runoff volume reduction with two different sizing scenarios. ... 55
ix
Figure 3.8 Average absolute difference in runoff volume (m3) by storm event between configurations where one parameterization is different, and all others are the same (e.g., for the first set of bars labeled “Outflow Routing,” LID placement, area treated, and LID sizing are the same between configurations, but outflow routing is different). ... 56 Figure 3.9 Percent change in total watershed flood volume between each LID
configuration and the baseline scenario (no redevelopment or BR
implementation). Negative percentages shown in blue shading meet baseline conditions; positive percentages shown in red shading do not meet baseline conditions. Darker blue and red shading indicates values that are further away from baseline conditions (0% change). The “C” and “D” labels indicate examples of scenarios that do not return flood volumes to baseline conditions despite favorable parameter configurations for flood volume reduction. ... 58 Figure 3.10 Average absolute difference in flood volume (m3) by storm event between
scenarios where one parameterization is different, and all others are the same (e.g., for the first set of bars labeled “Outflow Routing,” LID placement, LID sizing, and area treated are the same between scenarios, but outflow routing is different). ... 59 Figure 3.11 Relative sensitivities of various subcatchment, physical LID, and siting and
routing LID parameters to runoff volume and flood volume outputs reported as the percent change in model output per 1% change in model
parameters………..60 Figure 3.12 Comparison of percent of impervious area treated by bioretention (BR) units
and percent of impervious area of the watershed for eight BR scenarios. Scenarios that achieve the same reduction in runoff are indicated with diamond and star symbols... 62 Figure 3.13 Runoff volume (m3) for baseline and redeveloped conditions (no BR
implementation) and for a range of BR scenarios for the 5-yr, 24-hr storm. All BR scenarios assume that BR outflow is routed to the outlet. Scenarios that achieve the same reduction in runoff are indicated with diamond and star
symbols. Y-axis does not start at zero. ... 63 Figure 3.14 Conceptual subcatchments illustrating (a) Baseline subcatchment impervious
percent, (b) Redeveloped subcatchment impervious percent, (c) LID model configuration with no impervious percent adjustment, (d) LID model configuration with incorrect impervious percent adjustment, and (e) LID model configuration with correct impervious percent adjustment. ... 66
x
Figure 4.1 Map of the Berkeley neighborhood study area including subcatchments, calibration/validation points, the catchment outlet, Berkley and Rocky
Mountain Lakes, and street classifications. ... 77 Figure 4.2 Flow chart of the mainstreaming method as applied in this study (adapted
from Figure 1 in Gersonius et al. (2012)). ... 80 Figure 4.3 Conceptual diagram of expected modeling results showing climate change
effect on the x-axis, hydrologic function on the y-axis, and how tipping point results are expected to shift between baseline, redeveloped, and redeveloped + LID scenarios to a state of more or less system resilience. LID = low impact development………...…81 Figure 4.4 Conduit transects for (a) local, (b) collector, and (c) arterial street
classifications for the minor storm event. Note that the scale of the x-axis is not proportional to the y-axis... 83 Figure 4.5 Conduit transects for (a) local and collector, and (b) arterial street
classifications for the major storm event. Note that the scale of the x-axis is much larger than the y-axis. ... 85 Figure 4.6 Map of permeable pavement implementation by redevelopment scenario. All
permeable pavement in the low redevelopment scenario was also modeled in the moderate and high scenarios. All permeable pavement in the moderate
redevelopment scenario was also modeled in the high scenario………87 Figure 4.7 Street flood volumes above the minor storm event acceptable threshold for
increasing rainfall multipliers for the baseline and three redeveloped scenarios with and without (a) distributed bioretention, and (b) regional permeable pavement. Redev = Redevelopment; BR = bioretention; PP = permeable
pavement. ... 89 Figure 4.8 Second order polynomial relationships between the tipping point rainfall
multiplier and absolute percent increase in impervious area from baseline pre- and post-LID implementation for the minor storm event. Black dotted lines are second order polynomial trendlines with associated equations. Redev =
Redevelopment; LID = low impact development. ... 90 Figure 4.9 Street flood volumes above the major storm event acceptable threshold for
increasing rainfall multipliers for the baseline and three redeveloped scenarios with and without (a) distributed bioretention, and (b) regional permeable pavement. Redev = Redevelopment; BR = bioretention; PP = permeable
xi
Figure 4.10 Second order polynomial relationships between the tipping point rainfall multiplier and absolute percent increase in impervious area from baseline pre- and post-LID implementation for the major storm event. Black dotted lines are second order polynomial trendlines with associated equations. Redev =
xii
LIST OF TABLES
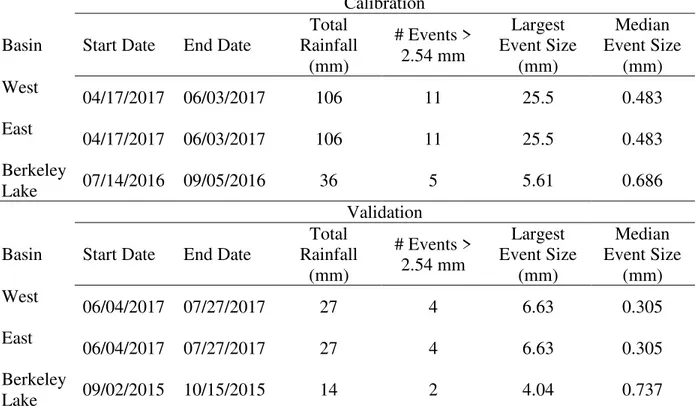
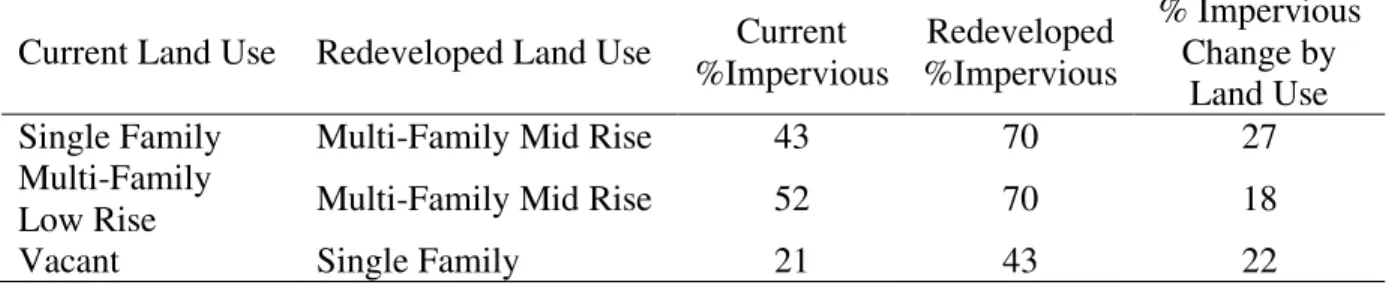
Table 2.1 Calibration and validation rainfall data details for each basin. ... 16 Table 2.2 Initial and calibrated PCSWMM parameters………..19 Table 2.3 Current (2014) land uses, redeveloped land uses, and changes in percent
impervious values by land use. ... 22 Table 2.4 Performance statistics for PCSWMM model calibration and validation……...…25 Table 2.5 Average percent increase in runoff volume per 1% increase in imperviousness
by simulated storm event………....26
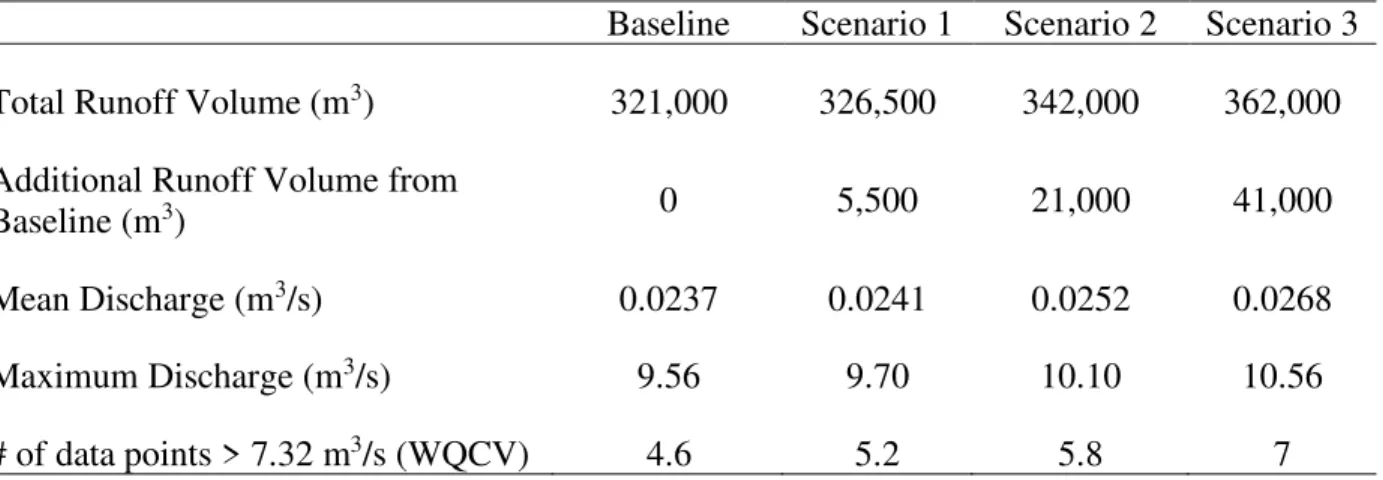
Table 2.6 Average results for model simulations of May through September rainfall for 2013 through 2017………..30 Table 3.1 Performance statistics for PCSWMM model calibration and validation. ... 45 Table 3.2 Watershed and LID metrics by bioretention (BR) sizing scenario. ... 52 Table 3.3 Percent of impervious and total area treated by bioretention (BR) by scenario
on average. ... 53 Table 4.1 Performance statistics for PCSWMM model calibration and validation. ... 78 Table 4.2 Inventory of PCSWMM entities in the Berkeley dual drainage model. (Some
descriptions from Randall et al., 2017). ... 78 Table 4.3 Street inundation standards for the minor (5-yr, 6-hr) storm event (reproduced
from Table 7-2 in UDFCD, 2016). ... 82 Table 4.4 Street inundation standards for the major (100-yr, 6-hr) storm event
(reproduced from Table 7-3 in UDFCD, 2016). ... 84 Table 4.5 Minor event tipping point rainfall multipliers pre- and post-LID
implementation. Low, moderate, and high refer to redevelopment scenarios... 88 Table 4.6 Major event tipping point rainfall multipliers pre- and post-LID
implementation. Low, moderate, and high refer to redevelopment scenarios... 92 Table 4.7 Metrics for permeable pavement (PP) and bioretention (BR) implementation
for the low, moderate, and high redevelopment scenarios. Redev =
redevelopment... 97 Table B.1 Bioretention unit PCSWMM parameters………114
xiii
Table D.1 Bioretention unit PCSWMM parameters………...…….116 Table D.2 Permeable pavement unit PCSWMM parameters………...…117
xiv
ACKNOWLEDGEMENTS
I wish to express my gratitude to the many people who have supported me throughout my Ph.D. journey. First, Dr. Terri Hogue has not only been an incredible advisor, but a supportive mentor and friend. Thank you for caring about me as a person first and a researcher second. I give thanks to my committee members, Jeff Holley, Adrianne Kroepsch, and John McCray, for their guidance and inspiration throughout the Ph.D. process. I want to extend my gratitude to all members of the Hogue Research Group throughout the past five years, who originally inspired my pursuit of graduate school, then supported me the entire way. Special thank you to Ryan Gilliom and Jordy Wolfand. You both know words cannot summarize the journey we’ve been through together. Looking forward to the many more adventures to come!
This work was supported by the Engineering Research Center for Re-inventing the Nation’s Urban Water Infrastructure (ReNUWIt). ReNUWIt provided a valuable community of researchers and collaborators that vastly expanded the experiences I gained during graduate school. This research was also supported by a National Science Foundation Graduate Research Fellowship. I am truly honored to have been an NSF fellow, and for the support provided by the GRFP.
Finally, one incredible thank you to my family: my parents (Amanda Panos & Bill Panos), my brother (Cameron Panos), my grandparents (Gordon Westrum, Jan Westrum, & Evelyn Panos), and my partner (Colt Wilkins). From spying on the stars to meddling in manholes, thank you for always supporting me in the next big adventure! And to any graduate student taking the time to look at my thesis, my biggest piece of advice: "Grow through what you go through."
1 CHAPTER 1 INTRODUCTION
1.1 Background
1.1.1 Urbanization and Stormwater
Urbanization is increasing in the U.S. and around the world with projections predicting that 68% of the global population will live in urban areas by the year 2050 (United Nations, 2018). Currently, about half of the world’s population lives in towns and cities, and the majority of the U.S. population lives in an urban environment (Grimm et al., 2008). Many urban areas are experiencing population growth as more people move away from rural areas and towards population centers. The combination of a rapidly densifying urban population, changing land use patterns in urban areas, and climate change will have an important impact on the future of urban water management.
Urbanization converts pervious surfaces to impervious surfaces (Lee et al., 2012; Grebel et al., 2013; Liu et al., 2015; Bloorchian et al., 2016). Increases in impervious area alter the natural hydrologic response by increasing runoff quantity, increasing peak flows, and creating an overall “flashy” system (Lee et al., 2012; Yang et al., 2015; Bloorchian et al., 2016). Stormwater runoff in urban areas is also a major source of surface water pollution (Sartor et al., 1974; Lee et al., 2012; Grebel et al., 2013) and increased flood risk (NRC, 2009). These problems are expected to intensify as climate change alters precipitation regimes including the frequency, duration, and intensity of extreme precipitation events (Praskievicz and Chang, 2009; Forsee and Ahmad, 2011; Paerl et al., 2016). Urban land use change and climate change are both drivers of hydrologic change in urban environments. Understanding the impacts of these drivers on urban hydrology, as well as solutions to address the impacts, is critical for the future of water resources.
1.1.2 Infill Development/Redevelopment
Many urban watershed studies compare pre-developed to developed conditions, but do not directly address stormwater runoff produced through urban redevelopment. As populations grow, cities must accommodate the new flux of people in housing without increasing the negative
2
environmental, social, and economic impacts of urban sprawl (Goetz, 2013). Therefore, many cities are implementing solutions that result in growing inward (or upward) instead of outward. This type of growth manifests as infill development, where the sporadic, under-utilized parcels of the city are “filled” in with new developments. In this way, infill redevelops a previously developed space instead of expanding into undeveloped land. Infill is a loosely defined term that can have several definitions and interpretations. In this research, redevelopment is synonymous to infill development, and is the main term used throughout the dissertation. Examples of redevelopment, as defined for this work, include a parking lot transformed into an apartment complex, or a single family home converted into a multi-family unit. An empty, or “vacant,” parcel converted to any other use is also defined as redevelopment in this research. The main unifying feature of redevelopment is an increase in impervious, or hard, surfaces, such as roofs or driveways, relative to what previously existed (Thomas, 2009; EPA, 2016). Increases in impervious surfaces are expected to decrease infiltration, increase stormwater runoff, and increase pollutant conveyance to nearby streams and waterbodies. However, high-resolution, watershed-scale hydrologic analysis of redevelopment is lacking.
Previous studies on the impacts of redevelopment on stormwater have used more simplistic methods, such as the curve number (CN) approach, to determine how impervious cover change from redevelopment affects peak flows and runoff volumes (Pond and Kacvinsky, 2006; Hekl and Dymond, 2016). In addition, existing studies have typically been conducted on the scale of a few parcels or the smaller neighborhood scale. There is currently a lack of information regarding the cumulative impacts of redevelopment at the larger neighborhood, or watershed, scale using higher-resolution, calibrated modeling. Such modeling can also be used to identify the temporal and spatial distribution of impacts on stormwater runoff and flood volumes, and to determine if the existing storm sewer network has adequate capacity for increased stormwater flows.
1.1.3 Low Impact Development
Many studies have identified the benefits of implementing Best Management Practices (BMPs), Stormwater Control Measures (SCMs), Green Infrastructure (GI), or Low Impact Development (LID) in urban areas at site, local, or watershed scales to manage stormwater runoff. While all these terms refer to similar stormwater management practices (Fletcher et al., 2015), the remainder of this dissertation uses the term LID. LID implementation is often assessed using
3
hydrologic models such as HEC-HMS (Emerson et al., 2005), SWMM or PCSWMM (Kabbani, 2015; Rosa et al., 2015), and SUSTAIN (Lee et al., 2012). These studies illustrate the positive impacts of LID - such as bioretention ponds, permeable pavements, and vegetative swales - on reducing peak flows, runoff volumes, and stormwater pollution through nature-mimicking mechanisms such as infiltration and chemical or biological reactions (Grebel et al., 2013). While LID editors incorporated into hydrologic models are useful tools for testing an array of scenarios, there is great uncertainty associated with LID modeling, and the evaluation of model sensitivity to LID parameters is an ongoing investigation (Eckart et al., 2017). In particular, the sensitivity of models to LID siting and routing parameters is under-studied as compared to physical LID parameters such as hydraulic conductivity or soil depths. Understanding model sensitivity to LID parameters is critical to accurately assess the viability of watershed-scale implementation plans, particularly in the context of urban redevelopment. It is unknown if current stormwater criteria regarding redevelopment is adequate, or if LID implementation can aid in the mitigation of redevelopment impacts on urban hydrology.
1.1.4 Stormwater Criteria and Urban Drainage Design
Redevelopment often takes place sporadically at compact scales on small land parcels (<0.1 ha, or <¼ acre) throughout a neighborhood. Thus, current regulations may or may not require stormwater management be implemented with redevelopment. For example, the City and County of Denver Storm Drainage Design and Technical Criteria Manual exempts flood control detention practices for redevelopment of a total area of 0.2 ha (½ acre) or less (DPW, 2013). In addition, the Environmental Protection Agency’s (EPA) National Pollutant Discharge Elimination System (NPDES) program only requires permits for stormwater discharges from activities disturbing areas of 0.4 ha (1 acre) or larger (EPA, 2012). The consequences of such stormwater regulations when redevelopment occurs on many small, yet technically separate, land parcels are not yet clear. Existing storm sewer systems may become outdated and unable to handle increased runoff volumes from redevelopment, especially in areas that already experience sewer surcharges, or that expect large increases in rainfall due to climate change.
Many urban drainage networks in the US were originally sized to convey design storms up to the 5-yr and 10-yr, 24-hr storm (Moore et al., 2016), while systems in Europe are designed to prevent floods from return periods ranging from the 10-yr to 50-yr storm (Salvadore et al., 2015).
4
Problems arise when non-stationary factors such as increasing impervious area due to redevelopment, as well as changes to precipitation from climate change, violate the stationarity assumption of urban drainage design (Arisz and Burrell, 2006; Milly et al., 2008).
1.1.5 Climate Change
In addition to impacts from land use change, the changing climate is affecting stormwater runoff in urban areas. A range of hydrologic modeling studies have evaluated the impacts of climate change on urban hydrology (Waters et al., 2003; Zahmatkesh et al., 2014; Moore et al., 2016; Alamdari et al., 2017). However, few studies have modeled the effects on stormwater of climate change alongside those of land use change, particularly in the context of redevelopment. There are challenges to studying climate change in urban watersheds including large uncertainties and variability in downscaled climate projections, which make adaptation approaches such as LID difficult to implement. In these situations, a resilience assessment may be better suited to assess at what rainfall thresholds an existing system fails current regulatory standards at varying levels of redevelopment under future climate change (Gersonius et al., 2012). Then, LID modeling can be used to determine how different types of LID can improve system resilience.
Ultimately, changes in the runoff and flood volumes generated by storms that drainage systems were originally designed to handle are accompanied by threats to human safety and infrastructure integrity. According to Salvadore et al. (2015), many densifying urban areas are experiencing more frequent and devastating floods leading to the need for more assessments of urban water fluxes via distributed hydrologic modeling. The goal of this dissertation is to evaluate the combined impacts of redevelopment and climate change on stormwater runoff quantity using distributed hydrologic modeling. For this investigation, we use a case study of the Berkeley neighborhood in Denver, Colorado.
1.2 Research Objectives, Questions, and Hypotheses
This section summarizes the research objectives, and associated research questions and hypotheses for each chapter of this dissertation.
5
1.2.1 Objective 1: Quantify Stormwater Runoff in a Redeveloping Neighborhood
The objectives of the research performed for Chapter 2 were to 1) Quantify the impacts of increasing redevelopment on local flood volumes and the storm sewer network capacity for varying redevelopment scenarios including a range of design storm simulations, and 2) Quantify the volume, peak flow timing, and spatial distribution of stormwater runoff caused by redevelopment using parcel-scale predictions of redevelopment. To achieve these objectives, the following research questions were addressed, and hypotheses were evaluated:
Question 1: At what level of increase in impervious area from redevelopment and for what size storm event will an existing storm sewer network flood due to increases in runoff volume?
Hypothesis 1 – The existing storm sewer network in the Berkeley neighborhood will reach
capacity and flood due to increased runoff volume from a moderate redevelopment scenario (increase in impervious area of 4.7%) during mid-sized storm events (e.g., 10-yr, 24-hr).
Question 2: How are changes to stormwater runoff volume and peak flow due to redevelopment spatially and temporally distributed for a range of design storms at the neighborhood scale?
Hypothesis 2 – Increases in stormwater runoff volume from baseline will be highest in
subcatchments experiencing the most redevelopment and lowest in subcatchments with existing LID infrastructure. Redevelopment will impact all design storms similarly. 1.2.2 Objective 2: Evaluate Model Sensitivity to LID Siting and Routing Parameters
The objectives of the research performed for Chapter 3 were to 1) Evaluate the sensitivity of SWMM to LID siting and routing parameters, 2) Compare this sensitivity to that of other LID and subcatchment parameters, and 3) Discuss the potential implications for regulatory compliance. To achieve these objectives, the following research questions were addressed, and hypotheses were evaluated:
Question 3: How sensitive is SWMM to LID siting and routing parameters including LID placement in the model, outflow routing from LID units, and area treated by LID units?
Hypothesis 3 – All three siting and routing parameters will be sensitive and affect model
runoff volume and flood volume outputs, but area treated will most affect model output followed by LID placement.
6
Question 4: How does the sensitivity of SWMM to LID siting and routing parameters compare to other physical LID and subcatchment parameters such as soil conductivity, soil thickness, depression storage, and infiltration rates?
Hypothesis 4 – Adjusting LID siting and routing parameters has a greater impact on
SWMM runoff and flood volume outputs than physical LID parameters (such as soil conductivity and soil thickness), but subcatchment parameters (such as depression storage and infiltration rates) have a greater impact on SWMM runoff and flood volume outputs than any LID parameter.
1.2.3 Objective 3: Assess Resilience to Land Use and Climate Changes
The objectives of the research performed for Chapter 4 were to 1) Assess the resilience of a dual drainage system to redevelopment land use change and climate change, and 2) Evaluate how distributed and regional LID implementation impacts system resilience. To achieve these objectives, the following research questions were addressed, and hypotheses were evaluated: Question 5: How do levels of redevelopment impact the tipping point of an urban neighborhood’s stormwater system? Tipping point is defined as the level of climate change, or change in rainfall from historical, to exceed regulatory requirements for flood protection.
Hypothesis 5 – The stormwater system of the Berkeley neighborhood will reach a tipping
point at a 20% and 30% increase in rainfall, for the minor and major storm event regulatory requirements, respectively, at baseline conditions. Redevelopment will decrease/worsen these tipping points with greater impact on the minor storm event than the major storm event.
Question 6: How do distributed and regional LID options impact the minor and major storm event tipping points at varying levels of redevelopment?
Hypothesis 6 –While both distributed and regional LID options will increase/improve
tipping points, distributed LID will provide greater improvements than regional LID, and the minor storm event tipping point will be impacted more than the major storm event tipping point.
7 1.3 References
Alamdari, N., D. J. Sample, P. Steinberg, A. C. Ross, and Z. M. Easton. 2017. “Assessing the Effects of Climate Change on Water Quantity and Quality in an Urban Watershed Using a Calibrated Stormwater Model.” Water. 9(7). doi.org/10.3390/w9070464
Arisz, H., and B. C. Burrell. 2006. “Urban drainage infrastructure planning and design
considering climate change.” Published in IEEE EIC Climate Change Conference. doi.org/10.1109/EICCCC.2006.277251
Bloorchian, A. A., L. Ahiablame, A. Osouli, and J. Zhou. 2016. “Modeling BMP and Vegetative Cover Performance for Highway Stormwater Runoff Reduction.” Procedia Eng. 145: 274-280. doi.org/10.1016/j.proeng.2016.04.074
Denver Department of Public Works (DPW), Wastewater Management Division, Engineering Division. 2013. “City and County of Denver Storm Drainage Design & Technical Criteria Manual.” denvergov.org
Eckart, K., Z. McPhee, and T. Bolisetti. 2017. “Performance and implementation of low impact development – A review.” Sci. Total Environ. 607-608: 413-432.
doi.org/10.1016/j.scitotenv.2017.06.254
Emerson, C. H., C. Welty, and R. G. Traver. 2005. “Watershed-Scale Evaluation of a System of Storm Water Detention Basins.” J. Hydrol. Eng. 10(3). doi.org/10.1061/(ASCE)1084-0699 Environmental Protection Agency (EPA). 2012. “2012 Construction General Permit (CGP) –
Fact Sheet.” <https://www3.epa.gov/npdes/pubs/cgp2012_finalfactsheet.pdf> (Accessed November 9, 2017).
Fletcher, T. D., W. Shuster, W. F. Hun, R. Ashley, D. Butler, S. Arthur, S. Trowsdale, S. Barraud, A. Semadeni-Davies, J. Bertrand-Krajewski, P. S. Mikkelson, G. Rivard, D. Dagenais, and M. Viklander. 2015. “SUDS, LID, BMPs, WSUD and more – The evolution and application of terminology surrounding urban drainage.” Urban Water J. 12(7): 525-542. doi.org/10.1080/1573062X.2014.916314
Forsee, W. J., and S. Ahmad. 2011. “Evaluating urban storm-water infrastructure design in response to projected climate change.” J. Hydrol. Eng. 16(11).
doi.org/10.1061/(ASCE)HE.1943-5584.0000383
Gersonius, B., F. Nasruddin, R. Ashley, A. Jeuken, A. Pathirana, and C. Zevenbergen. 2012. “Developing the evidence bae for mainstreaming adaptation of stormwater systems to climate change.” Water Res. 46: 6824-6835. doi.org/10.1016/j.watres.2012.03.060 Goetz, A. 2013. “Suburban Sprawl or Urban Centres: Tensions and Contradictions of Smart
Growth Approaches in Denver, Colorado.” Urban Studies. 50: 2178-2195. doi.org/10.1177/0042098013478238
Grebel, J. E., S. K. Mohanty, A. A. Torkelson, A. B. Boehm, C. P. Higgins, R. M. Maxwell, K. L. Nelson, and D. L. Sedlak. 2013. “Engineered Infiltration Systems for Urban Stormwater Reclamation.” Environ. Eng. Sci. 30(8): 437-454. doi.org/10.1089/ees.2012.0312
8
Grimm, N. B, S. H. Faeth, N. E. Bolubiewski, C. L. Redman, J. Wu, X. Bai, and J. M. Briggs. 2008. “Global Change and the Ecology of Cities.” Science. 319(5864): 756-760. doi.org/10.1126/science.1150195
Hekl, J. A. and R. L. Dymond. 2016. “Runoff Impacts and LID Techniques for Mansionization- Based Stormwater Effects in Fairfax County, Virginia.” J. Sustainable Water in the Built Environ. doi.org/10.1061/JSWBAY.0000815
Kabbani, M. S. 2015. “Using PCSWMM to simulate first flush and assess performance of extended dry detention ponds as structural stormwater BMPs in a large polluted urban watershed.” Ph.D. (Doctor of Philosophy) thesis, University of Iowa,
<http://ir.uiowa.edu/etd/1653> (Accessed March 16, 2016).
Lee, J. G., A. Selvakumar, K. Alvi, J. Riverson, J. X. Zhen, L. Shoemaker, and F. Lai. 2012. “A watershed-scale design optimization model for stormwater best management practices.” Environ. Modell. Softw. 37: 6-18. doi.org/10.1016/j.envsoft.2012.04.011
Liu, Y., L. M. Ahiablame, V. F. Bralts, and B. A. Engel. 2015. “Enhancing a rainfall-runoff model to assess the impacts of BMPs and LID practices on storm runoff.” J. Environ. Manage. 147: 12-23. doi.org/10.1016/j.jenvman.2014.09.005
Milly, P.C.D., Betancourt, J., Falkenmark, M., Hirsch, R.M., Kundzewicz, Z.W., Lettenmaier, D.P., Stouffer, R.J., 2008. Stationarity Is Dead: Whither Water Management? Science. 319(573): LP-574. doi.org/10.1126/science.1151915
Moore, T. L., J. S. Gulliver, L. Stack, and M. H. Simpson. 2016. “Stormwater management And climate change: Vulnerability and capacity for adaptation in urban and suburban contexts.” Clim. Change. 138: 491-504. doi.org/10.1007/s10584-016-1766-2
National Research Council (NRC). 2009. Urban Stormwater Management in the United States. Washington, DC: The National Academies Press. doi.org/10.17226/12465
Paerl, H. W., W. S. Gardner, K. E. Havens, A. R. Joyner, M. J. McCarthy, S. E. Newell, B. Qin, and J. T. Scott. 2016. “Mitigating cyanobacterial harmful algal blooms in aquatic ecosystems impacted by climate change and anthropogenic nutrients.” Harmful Algae. 54: 213-222. doi.org/10.1016/j.hal.2015.09.009
Pond, M. C. and G. Kacvinsky. 2006. “Tear-downs - controlling stormwater impacts.”
<http://waterbucket.ca/gi/files/2013/03/Teardowns-controlling-stormwater-impacts.pdf> (Accessed June 19, 2017).
Praskievicz, S., and H. Chang. 2009. “A review of hydrological modelling of basin-scale
climate change and urban development impacts.” Progress in Physical Geography: Earth and Environment. 33(5): 650-671. doi.org/10.1177/0309133309348098
Rosa, D. J., J. C. Clausen, and M. E. Dietz. 2015. “Calibration and Verification of SWMM for Low Impact Development.” J. Am. Water Resour. Assoc., 51(3): 746-757.
doi.org/10.1111/jawr.12272
Salvadore, E., J. Bronders, & O. Batelaan. 2015. “Hydrological modelling of urbanized catchments: A review and future directions.” J. Hydrol. 529: 62-81.
9
Sartor, J. D. et al. 1974. “Water pollution aspects of street surface contaminants.” J. Water Pollut. Control Fed. 46(3): 458-467.
Thomas, J. V. 2009. Residential Construction Trends in America’s Metropolitan Regions. U.S. Environmental Protection Agency: Development, Community, and Environment Division. United Nations, Department of Economic and Social Affairs, Population Division. 2018. World
Urbanization Prospects: The 2018 Revision. New York: United Nations.
Waters, D., W. E. Watt, J. Marsalek, and B. C. Anderson. 2003. “Adaptation of a storm drainage system to accommodate increased rainfall resulting from climate change.” J. Environ. Plann. Man. 46(5). doi.org/10.1080/0964056032000138472
Yang, Y., T.A. Endreny, and D.J. Nowak. 2015. “Simulating the effect of flow path roughness to examine how green infrastructure restores urban runoff timing and magnitude.” Urban Forestry & Urban Greening. 14(2): 361-367. doi.org/10.1016/j.ufug.2015.03.004
Zahmatkesh, Z., S. J. Burian, M. Karamouz, H. Tavakol-Davani, and E. Goharian. 2014. “Low- Impact Development Practices to Mitigate Climate Change Effects on Urban Stormwater Runoff: Case Study of New York City. J. Irrig. Drain Eng. 141(1): 04014043. doi.org/10.1061/(ASCE)IR.1943-4774.0000770.
10 CHAPTER 2
HIGH-RESOLUTION MODELING OF INFILL DEVELOPMENT IMPACT ON STORMWATER DYNAMICS IN
DENVER, COLORADO
Reproduced with permission1 from ASCE and the Journal of Sustainable Water in the Built Environment2
Chelsea L. Panos3, Terri S. Hogue3, Ryan L. Gilliom3, and John E. McCray3 2.1 Abstract
Growing cities require accurate knowledge of current and future hydrologic conditions to make effective stormwater management decisions. Yet, this information is lacking because cities are undergoing infill development/redevelopment, for which the hydrologic impacts are not adequately quantified. The current research studies the impacts of infill development on urban runoff in Denver, Colorado. A calibrated, high-resolution PCSWMM (Stormwater Management Model for PC) model was used to simulate design storms and summer rainfall periods for multiple future redevelopment scenarios. Results predict that an increase of 1% in impervious area due to redevelopment will increase surface runoff volume by 1.63% for the 2-yr, 24-hr design storm and by 0.91% for the 100-yr, 24-hr design storm resulting in greater relative flood risks for smaller storm events. Flooding volumes will increase from 30,000 m3 to 36,000 m3 for the 10-yr, 24-hr storm, which is 12% of the total storm rainfall volume. Results show the limitations of the existing storm sewer network, future flood potential, and the possibilities for stormwater beneficial use. Results will help inform current and future stormwater regulations regarding redevelopment. 2.2 Introduction
In the past century, the percentage of the global population living in urban areas has grown from 10% to over 50%, with continued growth expected over the next 50 years (Grimm et al.,
1 See Appendix A for permissions.
2 This material may be downloaded for personal use only. Any other use requires prior permission of the American Society of Civil Engineers. This material may be found at https://doi.org/10.1061/JSWBAY.0000863.
3 Hydrologic Science and Engineering, Department of Civil and Environmental Engineering, Colorado School of Mines, Golden, CO
11
2008). The combination of a rapidly densifying urban population and climate change will have an important impact on the future of urban water management. Stormwater runoff in urban areas is a major source of surface water pollution (Sartor et al., 1974; Lee et al., 2012; Grebel et al., 2013) and increased flood risk (NRC, 2009), but it is also regarded as an opportunity to augment local water supply and recharge aquifers (Steffen et al., 2013), particularly in water-stressed, semi-arid areas.
It is well known that urban growth increases the conversion from undeveloped, natural lands to non-rural land uses, thus converting pervious surfaces to impervious surfaces (Lee et al., 2012; Grebel et al., 2013; Liu et al., 2015; Bloorchian et al., 2016). This conversion changes an area’s natural hydrologic runoff response by lowering the watershed’s capacity for flood mitigation and water quality compliance as surface runoff increases and water quality degrades (Lee et al., 2012; Yang et al., 2015; Bloorchian et al., 2016). Many studies have identified the benefits of implementing Best Management Practices (BMPs), or Green Infrastructure (GI), in urban areas at both local and watershed scales using models such as HEC-HMS (Emerson et al., 2005), SWMM or PCSWMM (Kabbani, 2015; Rosa et al., 2015), and SUSTAIN (Lee et al., 2012). These studies illustrate the positive impacts of BMPs - such as vegetative swales, dry ponds, porous pavement, and filter strips - on reducing peak flows, runoff volumes, and stormwater pollution through nature-mimicking mechanisms such as infiltration and chemical or biological reactions (Grebel et al., 2013). Yet, these studies focus on changes in the hydrologic regime due to a transformation of undeveloped to developed land, or the extension of development into suburban areas, but do not directly address stormwater runoff produced through urban redevelopment.
Redevelopment, which is defined as “infill development” in this study, is the increasingly popular practice of adding new development within existing urban areas on vacant or under-utilized parcels of land, typically resulting in an increase in impervious surfaces such as roofs, driveways, and parking lots (McConnell and Wiley, 2010). One example of redevelopment is replacing a low density, older single family home including a front lawn with a new, high density multi-family complex that covers the full parcel area (Figure 2.1). Through this conversion, the percentage of impervious coverage within a parcel can double, thereby decreasing rainwater infiltration, increasing stormwater runoff, and likely increasing pollutant conveyance to nearby streams and waterbodies. As cities worldwide reach their urban growth boundaries (UGBs),
12
redevelopment is becoming the new face of urbanization (Johnson, 2001). Communities across the United States are recognizing the economic, social, environmental, and sustainability benefits of dense, urban centers versus the historical urban sprawl progression of growth (Goetz, 2013; Arvola and Pennanen, 2014). Infill development has been hailed as a solution to the problem of urban sprawl as well as an opportunity to economically revitalize existing neighborhoods and encourage public transportation, and is therefore encouraged through anti-sprawl, “smart growth” policies (Cooper, 2004; Downs, 2005; McConnell and Wiley, 2010).
Figure 2.1 Example aerial image of infill development occurring along Tennyson Street in the Berkeley neighborhood of Denver, CO. The left side of the image shows single family homes with lawns, while the right side illustrates the increase in impervious area of redeveloped multi-family units. (Source: Google Maps)
Although there are many benefits to infill development, there is a paucity of research on its adverse impacts, especially in the context of urban water cycling and stormwater runoff (McConnell and Wiley, 2010). A study by Pond and Kacvinsky (2006) used the HEC-HMS model
13
and curve number (CN) method to determine that average peak flows (from a range of design storms) at the outlet of a 136-ha residential redevelopment increased by 7% for an average impervious area increase of 6.7%. A more recent study by Hekl and Dymond (2016) analyzed 10 redeveloped parcels in Fairfax County, Virginia, also using the CN method in TR-55, and found that a total 7% increase in impervious area resulted in a 5.6% increase in runoff volume for the 10-yr, 24-hr storm. However, neither study investigated the cumulative effects of infill development on stormwater runoff at the larger neighborhood or watershed scale, or utilized a fully integrated, calibrated hydrologic model such as SWMM. In addition, prior studies have not addressed water quality or the possibility of harnessing potential increases in runoff volumes for water supply. Ultimately, cities once growing outwards (“sprawled growth”) are now growing inwards/upwards (“smart growth”), and understanding the resulting, and largely unknown, consequences on urban water cycling and water supply is increasingly relevant for water managers and residents in water-stressed cities across the globe (Burchell et al., 2000).
Ideally, infill occurs in the context of broader urban planning with the goal of achieving neighborhoods that complement the existing urban form. Yet, infill often takes place sporadically at compact scales on small land parcels (0.1 ha or less) throughout a neighborhood. Thus, regulations may or may not require stormwater management after redevelopment. For example, the City and County of Denver Storm Drainage Design and Technical Criteria Manual exempts flood control detention practices for redevelopment of a total area of 0.2 ha or less (DPW, 2013). In addition, the Environmental Protection Agency’s (EPA) National Pollutant Discharge Elimination System (NPDES) program only requires permits for stormwater discharges from activities disturbing areas of 0.4 ha or larger (EPA, 2012). The consequences of such stormwater regulations when redevelopment occurs on many small, yet technically separate land parcels are not yet clear. Existing storm sewer systems may become outdated and unable to handle increased runoff volumes from infill, especially in areas that already experience sewer surcharges, flooding, and erosion. In addition, the contribution of increased impervious areas to stormwater pollutants such as nutrients and metals from nonpoint sources such as fertilizers, pesticides, and automobiles is not well-studied.
Denver has a population density that has tripled since 1910 and is expected to grow by nearly 100,000 people (about 14%) in the next fifteen years (Metro Denver, 2017). Consequently, the City is facing a cycle of increasing population and infill development. A result of the observed
14
population growth is a rise in domestic water demand, a large part of which could be creatively mitigated through stormwater capture and management, particularly for non-potable uses. The novelty of the current study lies in utilizing a fully calibrated, high-resolution hydrologic model to conduct a holistic watershed system analysis of the alterations to urban stormwater dynamics due to infill in a Denver, Colorado neighborhood. Our work is part of larger effort to analyze the technical, legal, and economic feasibility of using the additional stormwater produced from ongoing redevelopment as a solution to reinvent stormwater management strategies and relieve pressure on regional water supplies. Specifically, our objectives are to:
1. Quantify the volume and spatial distribution of stormwater runoff caused by infill development using parcel-scale predictions of redevelopment.
2. Quantify the impacts of increasing infill development on local flooding potential and the storm sewer network capacity for varying redevelopment scenarios.
2.3 Methods
2.3.1 Study Site and Data Sources
The study area includes the Berkeley neighborhood in northwest Denver, Colorado (Figure 2.2), which has experienced significant infill development over the past fifteen years (Cherry, 2016). Denver’s regional RainVieux Gauge-adjusted Radar Rainfall (GARR) tool (Vieux, Inc., 2017) provided observed five-minute rainfall data. This rainfall tool uses both gauge (Figure 2.3) and radar inputs to provide rainfall values by user-specified catchments, basins, or 1-km grids in the Denver area (Vieux, Inc., 2017). Thus, the RainVieux tool outputs data that has already been inverse-distance weighted in a model-ready format which was applied to the full study area. The RainVieux precipitation gauge network is shown in Figure 2.3. Rainfall data characteristics are summarized in Table 2.1, where simulations for the West and East Basins utilize the same period of rainfall data based on the installation dates of corresponding flow data sensors as described below.
15
Figure 2.2 Berkeley neighborhood catchment study area including the existing storm sewer network, existing BMPs, modeling points, and modeled major basins. Smaller subcatchments are outlined in each basin.
16
Table 2.1 Calibration and validation rainfall data details for each basin. Calibration
Basin Start Date End Date
Total Rainfall (mm) # Events > 2.54 mm Largest Event Size (mm) Median Event Size (mm) West 04/17/2017 06/03/2017 106 11 25.5 0.483 East 04/17/2017 06/03/2017 106 11 25.5 0.483 Berkeley Lake 07/14/2016 09/05/2016 36 5 5.61 0.686 Validation Basin Start Date End Date
Total Rainfall (mm) # Events > 2.54 mm Largest Event Size (mm) Median Event Size (mm) West 06/04/2017 07/27/2017 27 4 6.63 0.305 East 06/04/2017 07/27/2017 27 4 6.63 0.305 Berkeley Lake 09/02/2015 10/15/2015 14 2 4.04 0.737
Meteorological data, including monthly evaporation and wind speed estimates, were obtained from the Denver Water Administration Building gaging station operated by Denver Water. Storm sewer discharge (or flow) data was continuously monitored at three locations within the watershed (annotated WC5, WC4, and BL – see Figure 2.2) using two ISCO 2100 Ultrasonic Level Sensors mounted above the flow stream within the storm pipes (Isco, Inc.) for locations WC5 and WC4, and one HOBO pressure transducer (Onset Computer Corporation) within a PVC pipe stilling well at point BL. The ultrasonic sensors were installed in April 2017 and record stage height by calculating the elapsed time between transmitted sound pulses reflected off the water surface. The HOBO pressure transducer was installed in September 2015 and records stage height by measuring the pressure of water above the transducer. Stage height was converted to discharge via Manning’s equations and developed rating curves, which is known to be an accurate method for partially filled sewer pipes (Saatci, 1990).
The Berkeley neighborhood is 419 ha and home to 11,000 people. The neighborhood has an average impervious area of 53% (in 2014) and an average slope of 5.5%. As of 2014, the main land use was single family residential (54%) with a modest portion of parks and recreation land use (18%) and multi-family units (10%). Land use was determined by the City and County of
17
Denver’s Community Planning and Development (CPD) department using parcel-scale data compiled from the Assessor’s parcel records from April to December 2014. Both single-family residential and parks and recreation land uses consist of properties with relatively high precipitation infiltration capacity. The highest density of development in the neighborhood resides along Tennyson Street, a north-south business corridor located in the center of the basin. Cherry (2016) estimated that future land covered by redevelopment in the study area would increase by 15% of total neighborhood parcels by the year 2024 resulting in an increase in impervious area of 1%. The Berkeley watershed utilizes a curb-and-gutter stormwater collection system and has 18.9 km of storm sewer pipes, 15.2 km of which were modeled for this study (Figure 2.2). All storm pipes within the basin drain from south to north, and stormwater discharges untreated into Clear Creek, a tributary of the South Platte River, the main drinking water source for Denver (Denver Water, 2016a). The basin contains no open water channels or streams, but does contain a historic drainage ditch, the Rocky Mountain Ditch, and two manmade lakes, Berkeley Lake to the west and Rocky Mountain Lake to the east (Figure 2.2).
2.3.2 Model Application
The EPA’s SWMM, version 5.1.011, was used as part of the PCSWMM software (CHI Water) to model stormwater runoff and conveyance. City-provided GIS delineated shapefiles of the storm sewer network, as well as a 9-m resolution Digital Elevation Model (DEM), were imported into PCSWMM. Because storm pipe networks often cross topographic boundaries, the assumption that all stormwater runoff flows downhill is inaccurate in the studied watershed. Therefore, following the approach developed by Shamead et al. (2014), the storm sewer shapefile was “burned” into the DEM by artificially lowering elevation values by 3 meters in locations where a pipe exists to mimic surface channels in the locations of storm pipes for the purpose of subcatchment delineation. The full Berkeley watershed was modeled using a distributed sub-basin approach with the delineation of 170 subcatchments grouped into three larger basins in PCSWMM – West Basin, East Basin, and Berkeley Lake Basin (Figure 2.2). The subcatchments range in size from 0.016 ha to 16 ha, with a mean area of 2.4 ha. Digitization of the numerous subcatchments allowed for high-resolution modeling of the impacts of infill across the neighborhood.
18 2.3.3 Initial Parameter Estimates
Initial parameters for PCSWMM were estimated via GIS, field observations, literature review, and model defaults (Table 2.2). GIS was utilized to calculate slopes, widths, areas, and percent imperviousness area-weighted by fourteen different land use types. Recommended values of depression storage depths from the Urban Drainage and Flood Control District (UDFCD) proved to be sensitive parameters and were thus adjusted during calibration. With an absence of observed soils data in the studied basin, uncalibrated Horton infiltration parameters were based on the soil type C classification of an adjacent neighborhood in the EPA’s National Stormwater Calculator (EPA, 2017). The DC parameter (directly connected impervious area) and routing for each sub-basin was calculated using the Denver-specific equation developed by Alley and Veenhuis (1983) (Equation 2.1) where the percent of runoff routed to impervious areas is equal to the DC value. The City of Denver provided information on pipe network parameters such as invert elevations, pipe diameters, and roughness coefficients.
𝐷𝐶 = 0.15 ∗ 𝑖𝑚𝑝𝑒𝑟𝑣𝑖𝑜𝑢𝑠 𝑎𝑟𝑒𝑎1.41 (2.1)
2.3.4 Storage Nodes
The two lakes located within the basin were modeled as storage nodes within PCSWMM. Berkeley Lake has a surface area and volume of approximately 14 ha and 427,000 m3 when full at a maximum depth of 3.05 m. Rocky Mountain Lake has a smaller surface area of approximately 9.7 ha, but has a maximum depth of 12.2 m for a full volume of 1,183,400 m3. The lakes were not built for storage purposes, but ultimately offer a combined volume of over 1.6 million m3. For simplicity, the lakes were assumed to be rectangular boxes due to the small depth relative to surface area of both lakes. Stage-area relationships were developed for both systems and entered into PCSWMM. To account for rain falling on the lakes, they were simulated as subcatchments classified as 100 percent impervious with no depression storage and wide overland flow widths, resulting in all rainfall converting to runoff routed directly to the storage nodes. In addition to the lakes, existing BMPs were modeled as aggregate bio-retention cells in three of the subcatchments (locations shown in Figure 2.2) using available dimensions data and estimated media parameters (DPW, 2014).
19 Table 2.2 Initial and calibrated PCSWMM parameters.
Parameter Initial Value(s) Calibrated Value(s) Data Source Subwatershed Area (ha) 0.016 – 16.6 No change GIS
Subwatershed Slope (%) 0.61 – 19 1.4 – 43 DEM
Subwatershed Width (m) 26.5 – 9,390 60.3 – 51,500 GIS
N-Impervious 0.01 0.001 - 0.01 Default N-Pervious 0.1 0.1 - 0.163 Default Depression Storage - Impervious (mm) 2.54 3.20 – 25.4 UDFCD Depression Storage - Pervious (mm) 8.89 8.89 – 14.8 UDFCD
% Impervious 20 – 81 No change City and County of
Denver’s Community Planning and
Development Department
% Zero Impervious 25 14 – 82 Default
% Routed to Impervious 10 – 74 No change Alley and Veenhuis (1983)
Max Infiltration Rate (mm/hr)
5.08 2.54 – 25.4 SSURGO web soil
survey (NRCS) Min Infiltration Rate
(mm/hr)
1.52 1.52 – 7.37 SSURGO web soil
survey (NRCS)
Decay Constant (1/hr) 4 0.83 – 4 Default
Drying Time (days) 7 3.5 – 7 Default
2.3.5 Calibration and Validation
The full watershed was calibrated and validated to three locations in the storm sewer network based on the placement of the ultrasonic level and HOBO pressure transducer sensors; designated as WC5, BL, and WC4, corresponding to the West Basin, Berkeley Lake Basin, and East Basin, respectively (Figure 2.2). Model calibration and validation was performed using a split-sample evaluation with continuous 5-minute RainVieux rainfall data for the time periods listed in
20
Table 2.1. Different simulation periods were used for different study basins based on flow data availability, but all data periods include between two and eleven rainfall events larger than 2.54 mm, which is the threshold found to produce runoff by the UDFCD (UDFCD, 2015). Total rainfall for the calibration and validation time series ranges from 14 to 106 mm with a typical median event size from 0.305 to 0.737 mm.
Summer months were modeled based on data availability and to avoid the impacts of snowmelt. All simulations utilized one month of observed rainfall data to “spin-up” the model and equilibrate soil moisture and storage node conditions. In addition, anthropogenic inflows contributing to the storm sewers in the form of lawn or landscape irrigation runoff between storm events (particularly in the modeled summer months) was separated from observed flows via the USGS’s hydrograph separation program, HYSEP (USGS, 2016), and added to the model as continuous time series files at the three modeling calibration locations.
A sensitivity analysis following methods presented by Rosa et al. (2015) was performed to quantitatively determine which parameters most impacted model output. Model parameters were adjusted over ranges of physically feasible values while keeping all other parameters unchanged. The model was run using rainfall data from April to June 2017. Then, the percent change in peak flow at the study area outlet (point O1, Figure 2.2) and total runoff volume were recorded. These percent changes were then normalized to the percent change in the parameter to produce relative sensitivity results showing percent changes in model output per 1% change in model parameters. The model parameters exhibiting the highest sensitivity were emphasized during calibration. Manual calibration was performed and assisted by PCSWMM’s SRTC (sensitivity-based radio tuning calibration) tool, which runs simulations for maximum and minimum parameter scenarios based on user-defined parameter tolerances (Finney and Gharabaghi, 2011). Validation utilized the calibrated parameters from all three basins without additional modifications.
We assessed model performance using a combination of standard regression, error index, and dimensionless statistics in addition to graphical techniques. Statistics included those recommended by Moriasi et al. (2007) such as Root Mean Square Error Standard Deviation Ratio (RSR) in Equation 2.2, Nash-Sutcliffe Efficiency (NSE) in Equation 2.3, coefficient of determination (R2) in Equation 2.4, and Percent Bias (%BIAS) in Equation 2.5, where recommended values for “good” model performance are RSR between 0 and 0.6, NSE and R2 between 0.65 and 1.00, and %BIAS less than 15%, and recommended values for “satisfactory”
21
model performance are RSR between 0.6 and 0.7, NSE and R2 between 0.50 and 0.65, and %BIAS less than 25% (Moriasi et al., 2007).
𝑅𝑆𝑅 = 𝑆𝑇𝐷𝐸𝑉𝑅𝑀𝑆𝐸 𝑜𝑏𝑠 = √1𝑛∑(𝑀 − 𝑂)2 √∑(𝑂 − 𝑂𝑎𝑣𝑔)2 (2.2) 𝑁𝑆𝐸 = 1 − ∑(𝑂 − 𝑂∑(𝑂 − 𝑀)2 𝑎𝑣𝑔)2 (2.3) 𝑅2 = 1 − ∑(𝑀 − 𝑂)2 ∑(𝑀 − 𝑂𝑎𝑣𝑔)2 (2.4) %𝐵𝐼𝐴𝑆 = ∑(𝑀 − 𝑂)∑ 𝑂 (2.5) 𝑊ℎ𝑒𝑟𝑒: 𝑂 = observations 𝑂𝑎𝑣𝑔 = average of observations 𝑀 = model simulations 𝑛 = number of data points 2.3.6 Development Scenarios
To evaluate the impacts of land cover change due to infill development, we modeled and analyzed existing and future impervious surface scenarios including: a baseline simulation using land cover and percent impervious data from 2014; Scenario 1) 1.2% impervious increase from baseline (as predicted in Cherry, 2016); Scenario 2) 4.7% impervious increase from baseline; and Scenario 3) 8.1% impervious increase from baseline. In other words, the baseline scenario has a percent impervious value of 53.5% based on 2014 data. Scenario 1 simulates a percent impervious change of 1.2%, increasing the total basin impervious area to 54.7%. Scenario 2 simulates a percent impervious change of 4.7%, increasing the total basin impervious area to 58.2%. Scenario 3 simulates a percent impervious change of 8.1%, increasing the total basin impervious area to 62.7%. Parcels predicted for redevelopment in all three scenarios utilized probabilities of redevelopment from Cherry (2016) at various thresholds, where the first probability of 30% (Scenario 1) was determined by Cherry (2016) using statistical models to determine the threshold
22
associated with redevelopment in the Berkeley study area through 2024. Scenarios 2 and 3 represent incremental thresholds of increasing infill development above Scenario 1. Scenario 1 predicts that parcels with probabilities over 30% that are theorized to redevelop will be redeveloped between 2014 and 2024, Scenario 2 predicts that parcels with probabilities over 20% will redevelop and Scenario 3 predicts that parcels with probabilities over 10% will redevelop from 2014 to an undetermined or hypothetical time period.
A key assumption is that only land uses defined as “Single Family,” “Multi-Family Low Rise,” and “Vacant” in 2014 would be redeveloped. It was assumed that Single Family parcels would redevelop to Multi-Family Mid Rise parcels, Multi-Family Low Rise parcels would redevelop to Multi-Family Mid Rise parcels, and Vacant parcels would redevelop to Single Family parcels with the corresponding changes in percent impervious area of those parcels (Table 2.3). Impervious value changes were then distributed to the 170 model subcatchments via area-weighting (larger areas are weighted more heavily) for each of the three scenarios, resulting in overall increases in watershed imperviousness spatially consistent with the scenarios described above. Figure 2.4 illustrates the area of land use types for the three scenarios, where 251 ha are classified as “other” for all scenarios, meaning 251 ha of the catchment do not undergo redevelopment for any of the future scenarios. The Single Family and Multi-Family Low Rise land uses decrease significantly from baseline through Scenario 3 as they are converted to Multi-Family Mid Rise (which increases from 1.3 ha at baseline to 175 ha in Scenario 3; Figure 2.4). Vacant area decreases slightly between baseline and Scenario 3.
Table 2.3 Current (2014) land uses, redeveloped land uses, and changes in percent impervious values by land use.
Current Land Use Redeveloped Land Use Current %Impervious Redeveloped %Impervious % Impervious Change by Land Use
Single Family Multi-Family Mid Rise 43 70 27
Multi-Family
Low Rise Multi-Family Mid Rise 52 70 18
Vacant Single Family 21 43 22
After calibration and validation, runoff was simulated for all scenarios using synthetic rainfall events for the 2, 5, 10, 25, 50, and 100-year, 24-hour design storms using a Type-II National Resources Conservation Service (NRCS) rainfall distribution at 5-minute intervals (Akan and Houghtalen, 2003) as well as the 6-hour Water Quality Capture Volume (WQCV) event, as defined
23
by the Urban Storm Drainage Criteria Manual, Volume 3. The WQCV event corresponds to the 80th percentile storm, or 17.5 mm in the study area (UDFCD, 2015). UDFCD has determined that capturing and treating the runoff volume produced by the WQCV storm event results in significant improvements to water quality (Urbonas et al., 1989).
Figure 2.4 Land use area by redevelopment scenario. 251 hectares (60% of the full watershed) are not redeveloped and therefore stay constant.
Results for each design storm were analyzed at the full study area outlet (see point O1, Figure 2.2) for stormwater runoff volume, peak flow in the storm sewer network, runoff ratios (𝑟), and flooding volume. Runoff ratios are defined by Equation 2.6 where 𝑄 is the stormflow in mm and 𝑃 is the total precipitation in mm.
𝑟 = 𝑄
𝑃 (2.6)
In addition, long-term simulations were performed for each redevelopment scenario using 5-minute RainVieux precipitation data from May through September for 2013, 2014, 2015, 2016, and 2017 (note that RainVieux sensors are turned off in the winter as the study site receives the majority of its rainfall from May through September). The long-term simulations were analyzed at the full study area outlet (point O1) for total runoff volume, mean and maximum statistics, and the number of data points with discharge greater than the WQCV (defined above).