Mobilization and reactive transport of selenium in a stream-aquifer
system: From field monitoring toward remediation modeling
Ryan T. Bailey1, Brent M. Cody, and Timothy K. Gates
Department of Civil and Environmental Engineering, Colorado State University
Abstract. Predicting the fate and transport of redox-sensitive species in ground water
systems requires an accurate characterization of the distribution and concentrations of all related (or interdependent) chemical constituents and the reaction rates at which these constituents interact. Ground and surface water sampling of chemical and physical properties in the stream-aquifer system of Colorado’s Arkansas River is providing an emerging picture of the nature and extent of selenium (Se) contamination as well as the strengths of correlations between Se and other constituents. Results from almost six years of field measurements, along with a detailed review of the literature, have led to a conceptual model of a redox-sensitive aquifer system wherein oxidants such as dissolved oxygen (DO) and nitrate, driven by extensive recharge from irrigation and canal seepage, mobilize sulfide and selenide species from shale bedrock and shale-derived soils. These species, dependent on the redox environment, are either reduced to immobile forms or transported through the shallow aquifer to surface water bodies. This conceptual model will be further refined through sampling along a transect of multi-level piezometers, thus enabling chemical characterization in the vertical dimension of the aquifer. This sampling, coupled with laboratory analyses of soil samples to quantify reaction kinetics, will allow the calibration of a vertical-profile reactive-transport ground water model wherein the fate and transport of DO, nitrate, and Se species are modeled. Insights from this modeling exercise will assist in developing a regional-scale, three-dimensional, reactive transport model of the Arkansas River system, providing a tool for exploring best management practices and remediation schemes.
1. Introduction
During the last few decades, high selenium (Se) concentrations in ground water and surface water supplies as well as wildlife habitats has emerged as a worldwide concern (Haygarth 1994), particularly in regions where intensively irrigated alluvial valleys overly or are in connection with Se-bearing geologic formations. Se, as a trace constituent in all igneous rocks, is present in all soils, although significantly high concentrations of Se occur mostly in marine shale deposits(Taylor 1964), wherein Se exists as a sulfur-substituting constituent in pyrite (FeS2), forming the mineral “seleno-pyrite” (FeSe2). The mobilization of selenate (SeO4), a highly toxic Se species, from bedrock shale occurs as FeSe2 is oxidized by NO3, as represented by the following oxidation-reduction (redox) reaction:
(1)
1 Department of Civil and Environmental Engineering Colorado State University
Fort Collins, CO 80523-1372 Tel: (970) 491-7620
In this redox reaction, FeSe2 is oxidized to mobilize SeO4 into the surrounding ground water, whereas NO3 is reduced (“denitrified”) to N2. Mobilized SeO4 undergoes an advection-dispersion transport path retarded by reduction to immobile forms or adsorption onto aquifer sediments, eventually entering surface water bodies, where it can bioaccumulate through the food chain and attain toxic concentrations (Lemly 2004). This paper describes the processes that govern the mobilization and transport of Se species, outlines numerical modeling efforts involving the fate and transport of Se and other redox-sensitive species, and presents data collection results and future modeling efforts regarding the reactive transport of Se in Colorado’s Lower Arkansas River Basin (LARB). The intent of the modeling is first, to understand the reactive nature of the aquifer, and second, to explore remediation schemes and best-management practices to either prevent the mobilization of SeO4 or to reduce it to non-toxic forms.
1.1. Se Chemistry
Se exists principally in the four oxidation states of selenide Se2 (-2 valence), elemental selenium Se (0 valence), selenite SeO3 (+4 valence), and selenate SeO4 (+6 valence) (Table 1). SeO4 and SeO3, the most oxidized Se species, are much more soluble than reduced Se forms, Se and Se2. Between SeO4 and SeO3, SeO4 is by far the dominant form in agricultural drainage water, with Masscheleyn et al (1989) reporting SeO4 accounting for about 95% of total Se. The movement of Se species in ground water systems is governed by redox reactions, which controls the speciation of Se, and adsorption processes, which retard SeO4 and SeO3 (Figure 1). Under highly oxidizing conditions, SeO4 and SeO3 are the principle Se constituents, whereas Se and Se2 become dominant in oxygen-depleted, reducing conditions.
Table 1. Characteristics of Se Species.
Se Species Oxidatio n State Solubl e Adsorptio n Oxidizin g conditions Reducin g conditions Toxi c Selenate
SeO4 +6 yes weak Present Absent yes
Selenite
SeO3 +4 yes strong Present Absent no
Seleniu
m Se 0 no none Absent Present no
Selenide
Se2 -2 no none Absent Present yes
Figure 1. Speciation of Se due to oxidation-reduction reactions, and adsorption of selenate and selenite
Redox reactions, inherently slow, are catalyzed and driven by bacterial respiration, which uses organic matter (OM) and mineral substrate as a source of energy through electron transfer between the donors (OM and mineral substrate), which are oxidized, and acceptors [oxygenated species such as dissolved oxygen (DO), NO3, and SeO4], which are reduced. DO, which supplies the microbial population the greatest quantity of energy per mole (McMahon and Chapelle 2008), is preferentially reduced, followed by NO3, SeO4, MnO2, Fe(III), SO4, and U(+6) (Korom 1992). Studies (Korom 1992) have noted a dramatic decrease in the concentration of NO3 and other oxidized species within the first few meters below the water table, as conditions become anaerobic. Inhibited consumption of electron acceptors occurs when an electron acceptor with a higher redox potential is present in solution. Hence, under laboratory conditions, the inhibition of SeO4 reduction in the presence of NO3, and the immediate reduction of SeO4 upon depletion of NO3, has been observed (Weres et al 1990). Correlation between DO, NO3, and SeO4 also has been reported by White and Dubrovsky (1994) and Wright (1999), with the conclusion that the presence of DO and NO3 allow SeO4 to remain in solution and undergo uninhibited transport.
Adsorption of the soluble Se species (SeO4 and SeO3) onto surface soil sites can be an important sink of Se in the ground water system. SeO3, similar in its adsorption capacity to phosphate, is strongly adsorbed onto surface sites (Ahlrichs and Hossner 1987; Neal et al 1987), whereas SeO4, similar in its adsorption capacity to SO4, is weakly adsorbed (Ahlrichs and Hossner 1987; Fio et al 1991). As reported by Fio et al (1991), the difference in adsorption capacities of SeO4 and SeO3 means that SeO4 can be easily leached from the unsaturated zone, whereas SeO3 is resistant to leaching. However, under reducing conditions, SeO4 can be reduced rapidly to SeO3, thus retarding its transport.
1.2. Modeling the Fate and Transport of Redox-Sensitive Species: A Review Many studies have been performed to determine the speciation of Se and the rate at which it occurs (Marten and Suarez 1997; Losi and Frankenberger 1998), as well as the adsorption of SeO4 and SeO3. Specifically, they have relied on laboratory batch studies to determine reaction rate coefficients for kinetic rate laws of redox reactions and equilibrium isotherms for adsorption reactions. Redox reactions are normally
approximated by first-order reaction rate laws. An equilibrium approach for adsorption, rather than a time-dependent, kinetic approach, is justified by the rapid time to
equilibrium (Neal et al 1987). In some instances, these rate coefficients and isotherms have then been incorporated into reactive transport numerical models in order to calibrate the models and predict the fate and transport of Se species. Due to the redox reactions depending on microbial, electron donor, and electron acceptor density, rate coefficients are site-specific.
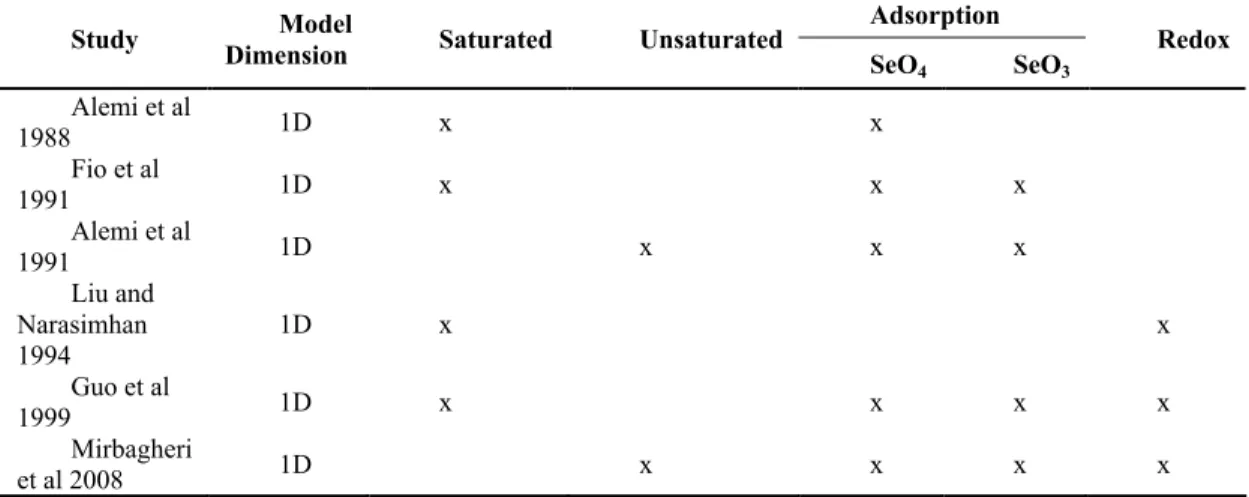
Numerical modeling studies involving Se fate and transport have been confined to one-dimensional soil profile models wherein Se transport in saturated or unsaturated conditions is subject to adsorption processes, redox reactions, or both (Table 2). For most studies, only adsorption has been simulated. Incorporation of redox reactions was first included by Liu and Narasimhan (1994) in their modeling study of the vertical movement of Se in the aquifer underlying the Kesterson reservoir. They also
highlighted the importance of bacterial characterization on Se transport. Guo et al (1999) simulated the reduction and equilibrium adsorption of SeO4 and SeO3 in saturated soil columns, with SeO4 reduction rates being estimated through calibration. Mirbagheri et al (2008) incorporated all governing processes involving Se species in the unsaturated zone, including advective-dispersive transport, adsorption, redox reactions, and volatilization.
Although Se fate and transport modeling has been restricted to 1D processes, other modeling studies dealing with redox-sensitive species, such as Frind et al (1990) and Postma et al (1991) in Europe, provide a framework for modeling Se fate and transport in a more complex aquifer system. Due to horizontal “redox fronts” in the aquifer, in which a sharp division occurs between oxidizing and reducing ground water conditions, these two studies sampled constituent concentrations in the vertical direction via multi-level sampling in preparation for numerical modeling. Other modeling studies followed suit (Tesoriero 2000). These studies have all modeled redox reactions using first-order kinetic approximations. Other models have employed more sophisticated models wherein the kinetics are represented by double –Monod microbial kinetic models, wherein the microbial, electron donor, and electron acceptor concentrations, and their influence on the chemical reaction, are accounted for through time (Molz et al 1986; Brun and Engesgaard 2002). These more complex models, however, have a large number of parameters that each need quantification.
Table 2. Summary of Se Reactive Transport Numerical Modeling Studies.
Adsorption Study Dimension Model Saturated Unsaturated
SeO4 SeO3 Redox Alemi et al 1988 1D x x Fio et al 1991 1D x x x Alemi et al 1991 1D x x x Liu and Narasimhan 1994 1D x x Guo et al 1999 1D x x x x Mirbagheri et al 2008 1D x x x x
This paper presents selected results from a long-term sampling project, a conceptual model of Se fate and transport based on sampling results as well as the literature, and finally a framework for modeling the fate and transport of Se species in a stream-aquifer system. Following the pattern of other numerical modeling studies involving redox-sensitive species, the first phase of modeling will be dependent on field sampling from a battery of nested piezometers along a ground water flow transect located within the LARB. Constituent concentrations determined from ground water samples as well as laboratory-determined redox and adsorption rates will provide parameter and boundary condition values for the two-dimensional, vertical profile reactive transport model. The two-dimensional layout will be used to investigate sensitivity of all model parameters. Insights gained from this modeling exercise, coupled with already-acquired sampling in
the surrounding region, will provide the necessary information to construct a three-dimensional, regional scale reactive transport model.
2. Field Work: Methods and Selected Results
Due to the immense size of Colorado’s LARB, approximate 235 km between Pueblo, CO and the Kansas state line, two regional scale study regions have been established. Comprising a total area of approximately 50,600 ha (125,000 ac), of which about 26,400 ha (65,300 ac) are irrigated from canals or pumping wells, the upstream study region is located upstream of John Martin Reservoir and extends between just west of the town of Manzanola to near Las Animas. Samples are routinely taken from 45 ground water observation wells, 4 locations in tributaries and drains, and 10
locations along the river (Figure 2). Samples are also taken from an additional 69 observation wells on an aperiodic schedule for use in expanding the dataset.
The second study region is located downstream of John Martin Reservoir and stretches between the city of Lamar and the Colorado-Kansas state line. The farthest west well of the downstream study region is located approximately 30 km east of the eastern edge of the upstream study region. The downstream region covers a total of about 55,200 ha (136,300 ac), of which about 33,000 ha (81,600 ac) are irrigated from canals that divert water from the river or from alluvial pumping wells. A total of 47 ground water observation wells, 12 locations in tributaries and drains, and 6 locations along the river have been routinely monitored for Se and related constituents. An additional 59 observation wells in this region were sampled aperiodically.
Figure 2. Image of Colorado showing the outlined boundaries of the upstream and downstream study
regions in the Lower Arkansas River Basin.
Water table levels and electrical conductivity (EC) have been consistently sampled in the upstream region from as early as April 1999. Sampling for Se concentrations in ground water and surface water began in April 2003 in the downstream region and June 2006 in the upstream region. Sampling events occur approximately 7 times per year
and typically alternate each time between the upstream and downstream regions. Currently, there have been 8 and 34 sampling events in the upstream and downstream regions, respectively. Using calibrated YSI 600QS Multiparameter Sampling SystemsTM several in-situ water quality measurements are taken from each specified ground and surface water point. These consist of water table depth, pH, temperature, specific conductance, DO concentration, and oxygen reduction potential. Water samples are also taken from each point and are analyzed for concentrations of Se, U, Na, K, Ca, Mg, NO3, SO4, Cl, CO3, HCO3, and B.
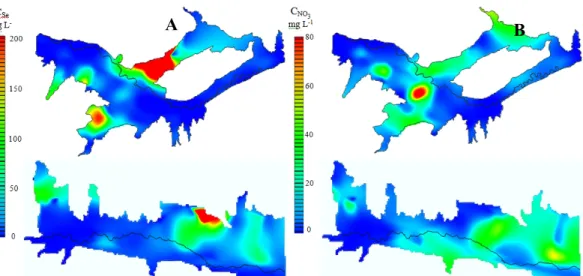
Values of the Pearson correlation coefficient, rP, were computed between a given variate X and a variate Y (designated as X-Y), between logs of the variates (log X-log Y), and between a variate and the log of a variate (log X-Y and X-log Y) for the concentrations and properties measured in the LARB study regions. Numerous variate pairs were discovered to be moderately or strongly correlated. The highest correlation found was a linear (X-Y) relationship between CSe and CNO3 in the downstream ground water dataset. Details may be found in a forthcoming paper by Gates et al (2009). This strong correlation suggests the potential to drastically reduce the loading of Se to the stream system that takes place due to the widespread practice of using nitrogen fertilizers in irrigated crop production. Contour plots generated using a natural-neighbor method (Figure 3) show relative “hot spots” as well as an illustration of the correlation between CSe and CNO3.
The relationship between CSe and the upgradient distance to Se-rich shale deposits also has been explored (Gates et al 2009). First, underlying shale deposits were located in ArcGIS by georeferencing existing USGS maps. Next, in order to show general ground water flow directions, water table contour lines were generated by importing water table data from an existing MODFLOW model into ArcGIS. Finally, distances between monitoring wells and upgradient shale deposits, Ls, were estimated using the ArcGIS measurement tool. While the downstream region yielded scattered results, the upstream region showed a strong inverse relationship between average CSe in
monitoring wells and values of Ls. The upstream region has a much larger quantity and extent of identified underlying shale deposits, hence a much higher likelihood of ground water sampling points being located near shale deposits. This may explain why little to no correlation has been found between average CSe and Ls downstream.
Further analysis has shown that a multivariate relationship between CSe, CNO3, CDO, and Ls exists. If oxic conditions are needed to mobilize Se then it is reasonable to expect that if the average CNO3 or CDO at a ground water sampling point is above a certain threshold value and Ls is small then its average CSe should be relatively large. The correlation between log CSe and log Ls has been found to significantly increase when removing CSe samples in which corresponding CNO3 and CDO values were low or Ls was high. Currently, this multivariate relationship between CSe, CNO3, or CDO and Ls is being explored with the intent of determining how high the oxidant concentrations of CDO and CNO3 must be to mobilize deposited or immobilized Se (Gates et al 2009).
Figure 3. Contour plots of (A) CSe (estimated using the “natural neighbor” interpolation method)
from samples collected during August 14-15, 2008 in the upstream study region (upper image) and during November 17-19, 2007 in the downstream study region (lower image); and (B) CNO3 for the same two
time periods.
3. Conceptualization of System
Results from the field, coupled with a review of the literature, lead to a conceptual model of Se mobilization and transport in a stream-aquifer system (Figure 4), wherein oxidants such as DO and NO3, driven by extensive recharge from irrigation and canal seepage, mobilize SeO4 from shale bedrock and shale-derived soils containing seleno-pyrite (FeSe2). SeO4, dependent on the redox environment, either is reduced to immobile forms or is transported through the shallow aquifer to surface water bodies, where dissolved concentrations and return flow rates determine the pattern of Se
loading to the river system. When DO and NO3 are present in the ground water, SeO4 is retarded only by adsorption processes. However, once DO and NO3 are reduced by bacterial respiration, SeO4 becomes the dominant electron acceptor, and through oxidation of OM or mineral substrate is reduced to SeO3, which typically adsorbs strongly to aquifer sediment, and immobile elemental Se. Reduced forms of Se such as elemental Se also can be re-oxidized to SeO3 and SeO4, thus creating the possibility of transport being retarded and accelerated in a cyclical pattern depending on the redox condition of the aquifer through which the ground water is flowing. Sources and sinks of all species involved in the fate and transport Se, due to recharging water and
chemical reactions, are summarized in Table 3.
Figure 4. Conceptual Model of Se mobilization and transport in an irrigated stream-aquifer system.
Table 3. Sources and Sinks of Se Species and Species Affecting Se speciation. (All Adsorption and
Redox Reaction Rates Require Quantification through lab methods)
Species Source Sink
Recharging waters Oxidation of substrate Oxidation of NO2 Oxidation of SeO3 DO
Oxidation of Se
Leaching from unsaturated zone Oxidation of substrate Oxidation of NO2 Oxidation of SeO3 NO3
Oxidation of Se
Leaching from unsaturated zone Adsorption
Desorption Oxidation of substrate Oxidation of SeO3 by O2
Oxidation of SeO3 by NO3 Oxidation of FeSe2 by O2 SeO4
Oxidation of FeSe2 by NO3
Leaching from unsaturated zone Adsorption
Desorption Oxidation of substrate Oxidation of Se by O2 Oxidation of SeO3 by O2 Oxidation of Se by NO3 Oxidation SeO3 by NO3 SeO3
Reduction of SeO4
Reduction of SeO3 Oxidation of Se by O2 Se
Oxidation of Se by NO3
4. Modeling the Fate and Transport of Se in the Lower Arkansas River Basin 4.1. Theoretical Development of Se Reactive Transport Model
Reactive transport involves the transport processes of advection and dispersion for a constituent as well as the reactions involving that constituent during its transport. This is summarized mathematically by the following Advection-Dispersion-Reaction (ADR) equation, as presented by Clement et al (1997) in his development of a
three-dimensional, multi-species reactive transport modeling code (RT3D):
(2)
where the four terms on the right-hand side represent advection, dispersion, source/sink mixing, and reaction, respectively, and C is aqueous-phase concentration of the
constituent [ML-3]; D is the hydrodynamic dispersion (incorporates diffusion and mechanical dispersion) [L2T-1]; v is the pore velocity [LT-1]; n is the soil porosity, q is the volumetric flux of water, representing sources and sinks [units]; Cs is the
concentration of the constituent of the source/sink[ML-3]; and r is the time-dependent reactions that occur in the aqueous phase[ML-3T-1]. Adsorption of the constituent, which is normally assumed to be equilibrium in nature, is taken into account by use of the retardation factor R, on the left-hand side of the equation. A separate ADR equation is written for all species to be included in the model, and the resulting system of
equations is solved simultaneously.
In the case of Se fate and transport, the reaction equation r represents the rate at which the constituent is either consumed or produced via redox reactions, and can be presented by the following first-order kinetic reaction rate law:
(3)
where [C] is the concentration of the constituent being considered [ML-3], k is the reaction rate coefficient [T-1], and CR is the concentration of the reactant [ML-3]. If C is consumed, k is negative, and equation (3) represents first-order decay. If first-order kinetics is assumed for all redox processes in the system (refer to Table 3), thus assuming that the reactant is in limitless supply, then each redox reaction can be approximated using the form of equation (3), which is then inserted into the ADR equation. Following this same pattern, and using the sources and sinks found in Table 3, the following reaction equation can be written for the fate and transport of SeO4 in a ground water system:
(4)
where k1 to k5 are the reaction rate coefficients for the oxidation of FeSe2 by O2, oxidation of FeSe2 by NO3, oxidation of SeO3 by O2, oxidation of SeO3 by NO3, and the reduction of SeO4 as it oxides aquifer substrate, respectively. Rate coefficients would depend on soil type, aquifer zone, and temperature. The ADR equation would also
include a retardation factor R specific to the adsorption of SeO4 on soil surface sites. Similar reaction equations representing the net rate of consumption and production can be written for DO, NO3, SeO3, and Se. The model employed by Clement (1997), RT3D, allows user-defined kinetics to be incorporated into the model framework.
Some models incorporate more complex kinetic rate laws in order to allow the rate coefficient to adapt to the changing chemical environment. As redox reaction rates are a function of time-dependent factors (microbial, electron donor, and electron acceptor concentrations), a more elegant characterization of kinetic rate laws adopts a microbial kinetics approach, wherein both constituent and microbial consumption/production are modeled (Clement 1997; Brun and Engesgaard 2002). The equations form a coupled system, as the rates are a function of the concentrations of all interacting species
considered in the system. However, the sophistication of this kinetic model is tempered by the increasing number of parameters which require quantification, and thus becomes a question of the amount of data which can be acquired from the field. Specifically, spatial and temporal concentrations of microbial populations, electron donors and electron acceptors, and laboratory-determined kinetic rates and coefficients must all be quantified.
4.2. Numerical Modeling
Using the ADR equation for each species involved in the fate and transport of Se, the first phase of modeling in the LARB will consist of a representative
two-dimensional, saturated, vertical profile model, similar to those found in Frind et al (1990) and Postma et al (1991). The 2D model will be used to calibrate to field conditions and to explore sensitivity of model parameters such as reaction rate
coefficients. Accuracy of the model parameters will be dependent on field sampling and laboratory soil analysis.
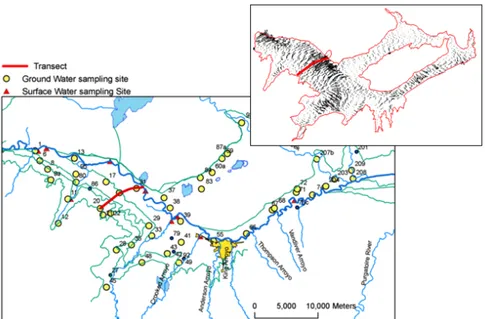
Sampling of ground water constituents will take place along a ground water flow path (Figure 5), which has been delineated using a calibrated MODFLOW ground water model. Sampling will occur at batteries of multiple-level nested piezometers along the transect in order to characterize concentrations in the vertical dimension of the aquifer (Figure 6). Drilling of the piezometers along the transect are planned to take place before the summer of 2009, whereupon preliminary sampling will take place in order to assess the spatial redox conditions of the aquifer. These preliminary sampling events will determine the subsequent sampling procedure and frequency. It is anticipated that samples will be collected 3-4 times during the irrigation season and 3 times during the off-season.
To supply the model with parameter values consistent with conditions found in the LARB, laboratory batch studies will be conducted to determine the redox and
adsorption capacity of soils along the transect as a function of initial, DO, and NO3 concentrations, as well as temperature. As the redox capacity of the soil will be dependent on the availability of an active microbial population and adequate electron donor content, multiple soil samples from representative areas will be taken and used in the laboratory studies.
Figure 5. Preliminary proposed transect for vertical and transverse sampling of Se and related
properties, with map at upper right showing average ground water flow vectors obtained from a calibrated MODFLOW simulation. Circles indicate current ground water sampling locations. Triangles indicate
current surface water sampling locations.
Figure 6. Placement of nested piezometers along a ground water flow path in the Lower Arkansas
River Basin, near Rocky Ford, CO. Dark circles indicate soil sampling sites for determination of reaction kinetics.
Currently these areas include (referring to Figure 6) (1) cultivated areas, (2) non-cultivated areas, (3) riparian zones near canals, (4) riparian zones near the Arkansas River, and (5) deep-aquifer areas, with (6) bedrock samples also being analyzed in batch studies in order to quantify the rate at which SeO4 is released due to FeSe2
oxidation by DO and NO3. Assuming first-order reaction kinetics, each reaction will be represented by equation (3). If microbial population and electron donor concentrations are not uniform and in limited supply, then modeling using microbial kinetics will be explored. However, this will require many more soil samples and laboratory batch
studies. Adsorption batch studies will also be undertaken to establish equilibrium isotherms for SeO4 and SeO3.
Results of field sampling and laboratory analysis will provide valuable insights into the distribution Se species and the rate of reactions various regions of the aquifer. It is anticipated that batch studies will allow redox patterns to be established according to land surface type, and that redox reaction rates and adsorption isotherms can be incorporated into the vertical profile model on a section by section basis, e.g. reaction rates provided for aquifer sections underlying cultivated regions will be different than reaction rates provided for sections underlying non-cultivated sections. Simulations will be run to assess the sensitivity of model parameters and the rate at which Se species are transported in the aquifer system. Anticipated key model parameters are electron donor distribution and concentration and reaction rate coefficients. In the case of microbial kinetics, bacterial distribution and concentration will be key model parameters.
Insights gained from the vertical profile simulations will assist in developing a regional-scale, three-dimensional, reactive transport model of the Arkansas River system, providing a tool for exploring best management practices and remediation schemes. The regional-scale model will be calibrated using the field work results from the ongoing region-wide sampling program. Anticipated remediation methods to be explored will consist of internal schemes, wherein the already-present SeO4 will be reduced and immobilized by adding high electron donor concentration to the aquifer, as well as preventative schemes, wherein NO3 input and excess recharge into the aquifer will be lowered, so as to minimize the mobilization of SeO4 from FeSe2 minerals contained in the shale bedrock and the aquifer substrate.
Acknowledgements. This research was supported by the Colorado Nonpoint Source Program of the CDPHE, the Colorado Agricultural Experiment Station, the United States Bureau of Reclamation, the Southeastern Colorado Water Conservancy District, and the Lower Arkansas Valley Water Conservancy District. Special appreciation is extended to more than 140 farmers and landowners and to numerous faculty and students at Colorado State University who have assisted in the field data collection efforts in the Arkansas River Valley.
References
Ahlrichs, J.S., and L.R. Hossner, 1987: Selenate and selenite mobility in overburden by saturated flow. J. Environ. Qual. 16, 95-98.
Alemi, M.H., D.A. Goldhamer, M.E. Grismer, and D.R. Nielsen, 1988: Elution of Selenium from Contaminated Evaporation Pond Sediments. J. Environ. Qual. 17, 613-618. Alemi, M.H., Goldhamer, D.A., and Nielsen, D.R, 1991: Modeling Selenium Transport in
Steady-State, Unsaturated Soil Columns. J. Environ. Qual., 20, 89-95.
Brun, A., and P. Engesgaard, 2002: Modelling of transport and biogeochemical processes in pollution plumes: literature review and model development. Journal of Hydrology 256, 211-227. and Engesgaard 2002
Clement, T.P., 1997: RT3D - A modular computer code for simulating reactive multi-species transport in 3-Dimensional groundwater systems. Draft report. PNNL-SA-28967. Richland, Washingtion, Pacific Northwest National Laboratory.
Fio, J.L., Fujii, R., and Deverel, S.J, 1991: Selenium Mobility and Distribution in Irrigated and Nonirrigated Alluvial Soils. Soil Sci. Soc. Am. J. 55, 1313-1320.
Frind, E.O., W.H.M. Duynisveld, O. Strebel, and J. Boettcher, 1990: Modeling of
Multicomponent Transport With Microbial Transformation in Groundwater: The Fuhrberg Case. Water Resources Research 26, 1707-1719.
Gates, T.K., B.M. Cody, J.P. Donnelly, A.W. Herting, R.T. Bailey, and J.M. Price, 2009: Regional assessment of Selenium Contamination in an Irrigated Stream-Aquifer System, J.
Environ. Qual., tentatively accepted and under review.
Guo, L., Frankenberger, W.T., and Jury, W.A., 1999: Evaluation of simultaneous reduction and transport of selenium in saturated soil columns. Water Resources Research 35, 663-669. Haygarth, P.M. 1994. Global Importance and Global Cycling of Selenium. In Selenium in the
Environment, ed. W.T. Frankenberger, Jr. and S. Benson, 1-27.
Korom, S.F.,1992: Natural Denitrification in the Saturated Zone: A Review. Water Resources
Research 28, 1657-1668.
Lemly, A. D., 2004: Aquatic selenium pollution is a global environmental safety issue.
Ecotoxicology and Environ. Safety 59, 44 – 56.
Lui, C.W. and Narasimhan, T.N., 1994: Modeling of selenium transport at the Kesterson reservoir, California, U.S.A. Journal of Contaminant Hydrology 15, 345-366. Losi, M.E. and W.T. Frankenberger, Jr., 1998: Microbial Oxidation and Solubilization of
Precipitated Elemental Selenium in Soil. J. Environ. Qual. 27, 836-843.
Martens, D.D. and Suarez, D.L., 1997: Selenium speciation of Marine Shales, Alluvial Soils, and Evaporation Basin Soils of California. J. Environ. Qual. 26, 424-432.
Masscheleyn, P.H., Delaune, R.D. and Patrick, William H., 1989: Transformations of Selenium As Affected by Sediment Oxidation-Reduction Potential and pH. Environmental Science
and Technology 24, 91-96.
McMahon, P.B. and F.H. Chapelle., 2008: Redox Processes and Water Quality of Selected Principal Aquifer Systems. Ground Water 46, 259-271.
Mirbagheri, S.A., Tanji, K.K. and Rajaee, T., 2008: Selenium transport and transformation modeling in soil columns and ground water contamination prediction. Hydrological
Processes 22, 2475-2483.
Molz, F.J., M.A. Widdowson, and L.D. Benefield, 1986: Simulation of microbial growth dynamics coupled to nutrient oxygen transport in porous media. Water Resources Research,
22(8), 1207-1216.
Neal, R.H., G. Sposito, K.M. Holtzclaw, and S.J. Traina, 1987: Selenite adsorption on alluvial soils: I. Soil composition and pH effects. Soil Sci. Soc. Am. J., 51, 1161-1165.
Postma, D., Boesen, C., Kristiansen, H. and Larsen, F., 1991: Nitrate Reduction in an Unconfined Sandy Aquifer: Water Chemistry, Reduction Processes, and Geochemical Modeling. Water Resources Research 27, 2027-2045.
Tesoriero, A.J., H. Liebscher, and S.E. Cox., 2000: Mechanism and rate of denitrifcation in an agricultural watershed: Electron and mass balance along groundwater flow paths. Water
Resources Research 36, 1545-1559.
Weres, O., Bowman, H.R., Goldstein, A., Smith, E.C. and Tsao, L., 1990: The effect of nitrate and organic matter upon mobility of selenium in groundwater and in a water treatment process. Water, Air, and Soil Pollution 49, 251-272.
White, A.F. and Dubrovsky, N.M., 1994: Chemical Oxidation-Reduction Controls on Selenium Mobility in Groundwater Systems. In Selenium in the Environment, ed. W.T.
Frankenberger, Jr. and S. Benson, 185-222.
Wright, W.G., 1999: Oxidation and Mobilization of Selenium by Nitrate in Irrigation Drainage.