Furrow irrigaton system design for clay soils in arid regions
13
0
0
Full text
(2) Furrow Irrigation System Design for Clay Soils in Arid Regions. world's irrigated land, including 27% of that in the United States. The problems of salinity and waterlogging are of global proportions, estimated worldwide productivity loss at about $10 billion per year. Improved efficiency in irrigation system design can help reduce the amount of irrigation water applied thereby reducing waterlogging and salinity problems while at the same time maintaining crop water needs (Postel, 1999 and Ghassemi et al., 1995). Almost 20% of the total cultivated lands in the world (1.0 billion hectares) are irrigated (Walker and Skogerboe, 1987). The majority of this land is irrigated using surface methods. Surface irrigation systems have many advantages such as; lower capital and operating costs, simplicity of maintenance and ability to use unskilled labor. Also, recent improvements in surface irrigation methods such as automation, cutback, and surge irrigation have furthered increased their appeal. Furrow irrigation is the most common type of surface irrigation, but in most cases the design of furrow systems is not optimal for water use in arid regions with unique infiltration characteristics, such as those present with clay soils. Furrow design parameters are often chosen with limited or no analysis of unique local conditions. There is a need for basic parameters that can be easily applied to furrow irrigation system design in order to optimize for local conditions. Optimizing the design of furrow irrigation systems has been approached by a number of researchers. For example, Reddy and Clyma (1981 a, b) applied Kelly’s cutting-plane algorithm to solve the border and furrow irrigation optimal design problem. They found that the main constraint on furrow irrigation efficiency is that a significant amount of water is lost to runoff and deep percolation. These losses depend on the furrow length, discharge and cut-off times. Wallender and Rayej (1987) conducted a study in which they maximized profits for a surface irrigation system using both uniform and non-uniform soils while analyzing two design variables (inflow rate and cutoff time). However, deep percolation was not considered in their analysis. Soil infiltration plays an important role in irrigation design efficiency and in the selection of irrigation methods. Infiltration characteristics are highly variable. This high variability has motivated studies on the effects of spatial variability of infiltration rates on surface irrigation system performance (Nielsen et al., 1973, Bautista and Wallender, 1985, Prasher et al. 1997, Childs et al., 1993, and Greminger et al., 1985). This paper describes an improved methodology for the design of furrow irrigation systems based on field data from an arid site in Egypt with clay soils. This methodology can be used for the design of new furrow systems as well as for the evaluation of existing systems.. Theoretical Approach There are many models commonly used to design and simulate furrow irrigation systems. The most common approaches include hydrodynamic (characteristic approach - Eluorine integration), zero–inertia, kinematic wave, and volume balance models. 43.
(3) Eldeiry et al.. In this study, a volume balance model was used that produces accurate results with modest data requirements. Shirini et al., (1999) presents a number of mathematical models for surface irrigation developed to simulate the depth of flow, advance time, recession time, infiltrated volume, runoff volume, and deep percolation. These models utilise full hydrodynamic, zero inertia, and kinematic wave methods for furrow irrigation design. Two approaches can be used to implement these models. The first approach is to use the principle of mass conservation (volume balance) and to assume a surface storage shape factor that replaces the momentum equation. The second approach is to use the conservation of mass and energy principle (momentum), also known as the Saint–Venant equations. Since the conservation of mass approach requires tedious numerical solutions, very intense computational efforts, and extensive datasets, it is difficult and expensive to run for a wide range of field conditions. Additional models were evaluated and the volume balance model was chosen for this study since it has proven to be accurate, the data it requires can be readily collected and it contains few assumptions.. Model Description: The volume balance model assumes that at any time, t, water entering the field will progress a distance X, toward the lower end of the field. The discharge at the inlet of the field, Qo, is assumed steady, so that at time, t, the product of Qo and t equals the volume of water on the soil surface Vy(t), plus the volume infiltrated Vz(t), which are both time dependent. Qot = Vy(t) + Vz(t). (1). Vy(t) = σ y Ao X= A X. (2). x. ∫. Vz (t) = z(s,t) dsW f 0. (3). here A is the average area and Wf is the furrow width Qo t = σ y Ao X + σ z XW f. (4). In order to solve this equation the volume balance model uses the following two assumptions: The trajectory of the advance of the water front in a furrow or border can be described as a simple power function: X = P (ts ) r. (5). where X is the distance that the front has advanced at time ts, and r and P are empirically fitted parameters. The infiltration function has a Kostiakov-Lewis characteristic form (Walker and Skogerboe, 1987): Z = k τ a + fo τ. (6) 44.
(4) Furrow Irrigation System Design for Clay Soils in Arid Regions. where Z is the volume of infiltrated water per unit length, τ is the opportunity time, fo is the basic intake rate in units of volume per unit length per unit time, and k and a are empirically fitted parameters. Utilising these two assumptions in the Lewis-Milne equation, the volume balance model can be written as follows (Walker and Skogerboe, 1987): f o ts X W f a (7) Q o t s = σy Ao X + σzKt s X W f + (1 + r ) (a + r (1 − a) + 1) σz = (1 + a )(1 + r ). σ z' =. 1 1+ r. where: (8) (9). Design procedure: The design procedure requires the determination of the furrow geometry factors, the advance time, and the application efficiency. These parameters will be discussed here. Furrow geometry (shape factor parameters): The furrow geometry data collected was used to derive the relationship between the depth of water in the furrow and the corresponding top width. Equation 10 was used to approximate this relationship. The parameters α 1 , α 2 can be obtained using data fitting for the equation: B = α1 yα 2. (10). where B, is top width of water in the furrow, y, is the depth of water in the furrow, α 1 , and α 2 are the top width factor parameters. The wetted perimeter factor parameters γ 1 and γ 2 can be obtained from the following relation: WP = γ 1y γ 2 (11) where WP is the wetted perimeter of the furrow. Therefore the area shape factor parameters σ1 and σ2 can be obtained as follows:. σ = 1. α1. (α 2 + 1). ,. σ 2 = α2 + 1. (12). Cross - Sectional Flow Area: The cross-sectional flow area at the field inlet, Ao , can be calculated using the Manning equation as follows: Qon Ao = C 1 ( )C 2 (13) 0 .5 60 S o where: 45.
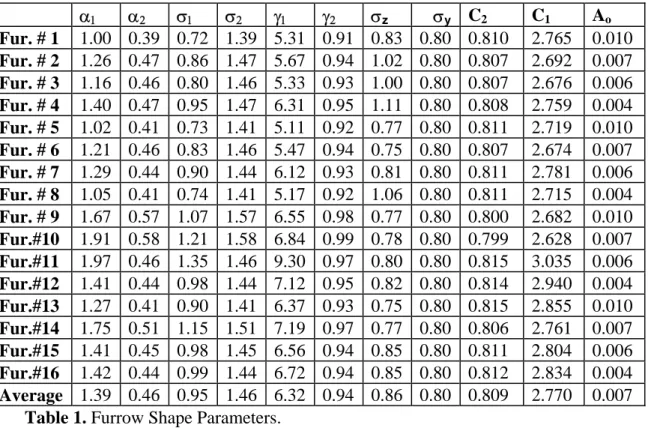
(5) Eldeiry et al.. C2 =. 3σ 2 , (5σ 2 − 2γ 2 ). C1 = σ 1 (. γ 10.67 ) σ 11.67. (14). where Qo, is the field inlet discharge (m3/min), n is the Manning roughness coefficient, and So is the field slope. From the above equations, the furrow shape parameters were calculated and summarized in table (1) for all furrows used in this study. α1 α2 σ1 σ2 γ1 Fur. # 1 1.00 0.39 0.72 1.39 5.31 Fur. # 2 1.26 0.47 0.86 1.47 5.67 Fur. # 3 1.16 0.46 0.80 1.46 5.33 Fur. # 4 1.40 0.47 0.95 1.47 6.31 Fur. # 5 1.02 0.41 0.73 1.41 5.11 Fur. # 6 1.21 0.46 0.83 1.46 5.47 Fur. # 7 1.29 0.44 0.90 1.44 6.12 Fur. # 8 1.05 0.41 0.74 1.41 5.17 Fur. # 9 1.67 0.57 1.07 1.57 6.55 Fur.#10 1.91 0.58 1.21 1.58 6.84 Fur.#11 1.97 0.46 1.35 1.46 9.30 Fur.#12 1.41 0.44 0.98 1.44 7.12 Fur.#13 1.27 0.41 0.90 1.41 6.37 Fur.#14 1.75 0.51 1.15 1.51 7.19 Fur.#15 1.41 0.45 0.98 1.45 6.56 Fur.#16 1.42 0.44 0.99 1.44 6.72 Average 1.39 0.46 0.95 1.46 6.32 Table 1. Furrow Shape Parameters.. γ2 0.91 0.94 0.93 0.95 0.92 0.94 0.93 0.92 0.98 0.99 0.97 0.95 0.93 0.97 0.94 0.94 0.94. σz 0.83 1.02 1.00 1.11 0.77 0.75 0.81 1.06 0.77 0.78 0.80 0.82 0.75 0.77 0.85 0.85 0.86. σy 0.80 0.80 0.80 0.80 0.80 0.80 0.80 0.80 0.80 0.80 0.80 0.80 0.80 0.80 0.80 0.80 0.80. C2 0.810 0.807 0.807 0.808 0.811 0.807 0.811 0.811 0.800 0.799 0.815 0.814 0.815 0.806 0.811 0.812 0.809. C1 2.765 2.692 2.676 2.759 2.719 2.674 2.781 2.715 2.682 2.628 3.035 2.940 2.855 2.761 2.804 2.834 2.770. Advance Time: Shrini et al., (1999) stated that improving furrow irrigation performance requires parameter information for the advance function. In a furrow event, advance time depends on soil infiltration characteristics, roughness of the soil surface, inflow rate, and furrow slope and shape, whereas the recession time is usually short and negligible for undiked furrows (Fok and Bishop, 1965). The Newton - Raphson procedure can be used to get the advance time using the following equation:. t = ts −. Qo t s − σ y Ao L − σ z kt sa LW f − Qo −. σ z akW f t s (1 − a ). −. f o t s LW f. f o LW f. (1 + r ). (15). 1+ r. From the above equation, the advance time was calculated for all furrows at eight different points in each furrow.. 46. Ao 0.010 0.007 0.006 0.004 0.010 0.007 0.006 0.004 0.010 0.007 0.006 0.004 0.010 0.007 0.006 0.004 0.007.
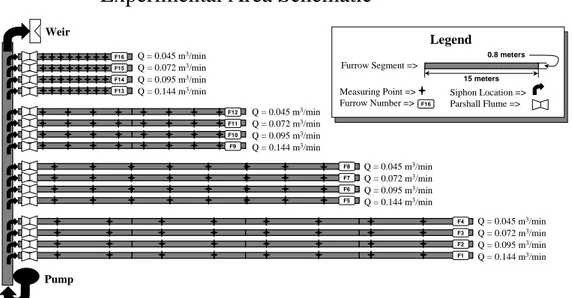
(6) Furrow Irrigation System Design for Clay Soils in Arid Regions. The application efficiency (Ea) is the volume of water required to fill the required depth of water in the soil divided by the volume of water delivered to the furrow and is calculated using the following equation: Ea =. Z(req)LW f t(co)Q o. (16). where Z(req) is the required depth to be filled and t(co) is the cut off time in minutes.. Experimental Study A detailed field experiment was implemented to determine the accuracy of the modeling in representing a typical furrow design. The study site in an arid region in Egypt's Nile River Valley where there is a critical need for judicial water use and productive agriculture.. Study Site Description: A two acres study site was chosen in the Bani-Suef district of Egypt along the Nile. The irrigation system used at this site is furrow irrigation with furrow lengths of between 10 to 15 m in length. Approximately one third of an acre of the study site was used to conduct the detailed study described in this paper. The experimental site has clay soils, cultivated with cotton and irrigated by a three-turn crop rotation. Several parameters were measured before and during the experiment including the furrow shape geometry, slope, furrow width, furrow length, infiltration tests, advance time, cut-off time, depletion time, discharge amount, and recession time. The layout of the experiment area is shown in Figure 1. The area consists of four groups of furrows each consisting of four furrows. All the furrows have the same width (0.8 m), and each furrow group contains four furrows with lengths of 90, 60, 30, and 15 m respectively. The four furrows in each group have the same lengths, respectively (ie. 90, 60, 30, and 15 m). A gasoline powered centrifugal pump having a discharge of 4 m3/min was used to maintain a constant water level at the head ditch. The head ditch was used to deliver water to each furrow group by sets of pipe siphons. The siphons were chosen in a way that four different discharges for each group of furrows could be applied and measured with Parshall flumes during irrigation. The measured discharges for the four furrows during irrigation. 47.
(7) Eldeiry et al.. Experimental Area Schematic Weir. Legend F16 F15 F14 F13. Q = 0.045 m3/min Q = 0.072 m3/min Q = 0.095 m3/min Q = 0.144 m3/min. 0.8 meters. Furrow Segment => 15 meters. F12 F11 F10 F9. Q = 0.045 m3/min Q = 0.072 m3/min Q = 0.095 m3/min Q = 0.144 m3/min. Measuring Point => Furrow Number =>. F8 F7 F6 F5. F16. Siphon Location => Parshall Flume =>. Q = 0.045 m3/min Q = 0.072 m3/min Q = 0.095 m3/min Q = 0.144 m3/min F4 F3 F2 F1. Q = 0.045 m3/min Q = 0.072 m3/min Q = 0.095 m3/min Q = 0.144 m3/min. Pump. Figure 1. Schematic of the Experimental Area were 0.144, 0.094, 0.072, and 0.045 m3/min, respectively. The total measured discharge for each furrow group was 0.355 m3/min. A weir was constructed at the end of the head ditch to maintain the water level and to deliver the excess water to irrigate the rest of the field.. Field Measurements: Field Slope: A surveying instrument was used to adjust the level of the land at different locations throughout the furrow lines. The weighted average method was used to calculate an average furrow slope, where each line was divided into sectors and the slope was estimated for each individual sector. Finally, a weight is assumed for each sector and the weighted average slope was estimated. Furrow Shape Geometry: A wooden frame consisting of two horizontal wooden pieces and two vertical legs was used to measure the furrow geometry. Steel rods with constant lengths were fixed in the horizontal pieces of wood through small holes. A drawing paper was fixed behind the rods on the frame. The two vertical legs of the apparatus are placed in a way that the steel rods were plumb and then the steel rods were lowered until they touched the furrow surface. Hence, the shape of the furrow is repeated at the top of the steel rods on the drawing paper and can be traced. The furrow shape was traced four times for each furrow and the average of the four values for each furrow was used. The average for all furrows was calculated to get the overall furrow shape parameters for the model calculations.. 48.
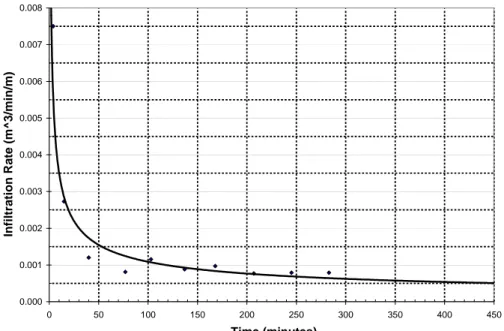
(8) Furrow Irrigation System Design for Clay Soils in Arid Regions. Soil infiltration parameters: The soil basic infiltration (fo) parameter was measured in the field by using a double ring infiltrometer. The two rings penetrated the soil about 0.2 m. The inner ring has two marks separated by a standard distance of 0.03 m. The time taken for the water to drop from the upper mark to the lower mark was recorded. This procedure was repeated until the time taken for the water level to drop from the first mark to the second mark became the same for at least three consecutive readings. Advance time, Cutoff time, Depletion time, and Recession time: At each furrow, eight pieces of wood were set into the furrows at equal distances along the furrow length. The travel time of water advancing through each furrow was recorded at each mark. The cutoff time for each furrow was recorded along with the depletion and recession times for each furrow. Furrow Discharge: Four siphon diameters each with different discharge characteristics were used for each group of furrow lines, and Parshall flumes were used to measure the actual discharge. The dimensions for construction of the 1-inch Parshall flumes and the coefficients for the discharge calculations were taken from Skogerboe et al. (1969).. Results Infiltration Test: Figure (2) illustrates draw down versus time and the estimated infiltration rate. Parameter fo was estimated as 0.0005 m3/min/m from the results of the infiltration tests. Therefore, the infiltration function is in the form: Z = κτ a + 0.0005τ. (18). As stated in the model description section, the infiltration function is very important for two reasons. The first is that the basic infiltration rate is used to determine the advance time of the flow through the furrow length and this parameter is very sensitive. The second is, calculating parameters k and a in the infiltration function depend on the basic infiltration rate and are used later to calculate the advance time.. Efficiency and Furrow Lengths Figure (3) represents the relationship between the furrow length (from near zero to 500m) and application efficiency for selected furrows used for the model calculations. Figure (3) illustrates that high efficiencies can be achieved for small furrow lengths with relatively low discharges and alternatively larger discharges are needed as furrow length increases to obtain 49.
(9) Eldeiry et al.. high efficiencies. Figure (3) can be used to determine where this change in trends occurs in order to achieve an optimal furrow length given a discharge. 0.008. Infiltration Rate (m^3/min/m). 0.007. 0.006. 0.005. 0.004. 0.003. 0.002. 0.001. 0.000 0. 50. 100. 150. 200. 250. 300. 350. 400. 450. Time (minutes). Figure 2: Time vs. Infiltration Rate 100 90. Application Efficiency (%). 80 70 60. Qo = 0.30 Qo = 0.25. 50. Qo = 0.20 Qo = 0.15. 40. Qo = 0.10. 30 20 10. 500. 475. 450. 425. 400. 375. 350. 325. 300. 275. 250. 225. 200. 175. 150. 125. 100. 75. 50. 0. 25. 0. Length (meters). Figure 3: Furrow Lengths vs. Application Efficiency for Modeled Discharges For example, in the first case, where the discharge is 0.1 m3/min, it is clear that the highest efficiency occurs at a furrow length of 130.0 m. As the length increases beyond 130.0 m. the efficiency decreases to 48% at 430 m. In the second case with a discharge of 0.175 m3/min, an efficiency of 90% is obtained with a length of 210 m and then the efficiency decreases to 61% at 50.
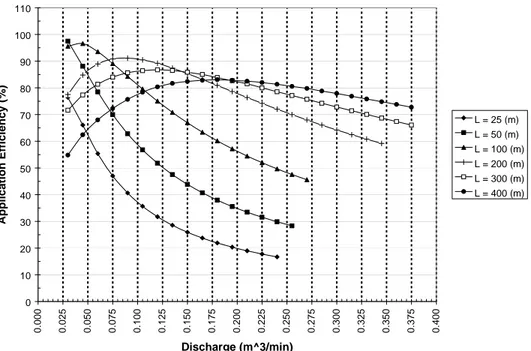
(10) Furrow Irrigation System Design for Clay Soils in Arid Regions. 490 m. With a discharge of 0.2 m3/min, the maximum efficiency of 87% is achieved at 310 m while the efficiency reduces slightly to 74% at 490 m. The fifth case with a discharge of 0.25 m3/min, achieves its maximum efficiency (84%) at 370 m and again reduces slightly to 78% at 490 m. The final case further illustrates this trend with a discharge of 0.3 m3/min the maximum efficiency 82% is achieved at 410 m and only reduces to 80% at 490 m.. Efficiency and Furrow Discharges Figure 4 illustrates efficiency as a function of discharge for selected furrow lengths. High efficiencies can be achieved for the 25 and 50 m furrow lengths for very small discharge values. Small errors in selecting or applying selected discharges can reduce efficiency with small furrow lengths due to the dramatic peak in the graph at low discharges. However with a 100 m furrow length, an efficiency above 80% can be achieved for a range of discharges from 0.05 to 0.10 m3/min. Longer furrow lengths generally yield a higher security factor for applying discharges given the constraints of water delivery systems. Although the maximum efficiency of small furrow lengths can be higher, the overall efficiency of long furrows with less dependence on discharge application rates is probably the more practical design for most systems. 110 100. Application Efficiency (%). 90 80 70. L = 25 (m) L = 50 (m). 60. L = 100 (m) L = 200 (m). 50. L = 300 (m) L = 400 (m). 40 30 20 10. 0.400. 0.375. 0.350. 0.325. 0.300. 0.275. 0.250. 0.225. 0.200. 0.175. 0.150. 0.125. 0.100. 0.075. 0.050. 0.025. 0.000. 0. Discharge (m^3/min). Figure 4: Furrow Discharge vs. Application Efficiency for Modeled Lengths Figures 3 and 4 can be used to guide farmers with similar clay soil types to select the optimal length and discharge of their furrow system. Based on the size of the field, the farmer can select which discharge will produce the desired efficiency, or alternatively what furrow lengths could be used for a given discharge. However as discussed previously, given a choice, higher discharges and longer furrow lengths have the advantage of lower 51.
(11) Eldeiry et al.. installation and maintenance costs and require less accuracy in discharge application while at the same time producing only small reductions in efficiencies.. Summary and Conclusions A common practice in Egypt and most of the developing world is to use short furrow lengths to improve application efficiencies. However, the extra effort in forming dykes and ditches and the added expense of materials for accurately applying discharge amounts required for the shorter furrow lengths might not be necessary as was shown by the results of this research. In addition, with less direct intervention during irrigation applications the deformation of the furrow shape characteristics can be reduced. Tractors and pumps are now common in Egypt, however small furrow lengths are still implemented due to tradition or fear of change. Where farmers have implemented longer furrow lengths in Egypt, the savings in time and effort have been very substantial. As farmers begin implementing longer furrow lengths, it is important to consider the optimal application rate and feasible furrow length given ownership boundaries and/or topography. This research shows that in clay soils relatively high efficiencies can be obtained over a wide range of furrow lengths (100 m to 300 m). For example, with a discharge of 0.15 m3/min, efficiencies between 80% and 90% can be achieved for lengths ranging from 115 m to 330 m. Longer furrow lengths should be used under these conditions since they make the irrigation system more robust. When using longer furrow lengths the irrigation system is less sensitive to variations in discharge, furrow shape, field slope and roughness. However, where longer furrow lengths are not possible, the application of water should be carefully controlled to maintain high efficiencies. The results of this research can be summarized as follows: 1) The volume balance model was satisfactorily applied for clay soils in an arid environment. The model operated well within practical design constraints. 2) Furrow length and application discharge are the main factors affecting application efficiency. 3) For clay soils, using long furrows with relatively high discharges can achieve reasonable efficiencies given the constraints of installation and maintenance costs. 4) The use of short furrow lengths with low discharges is not recommended for clay soils given the sensitivity these systems have to furrow length and discharge. 5) Furrow shape is a critical parameter for determining the advance time, therefore design characteristics for furrow shape should be considered in installation and maintenance of furrow irrigation systems. 6) The basic infiltration rate is one of the most important factors in designing a system. Since as the infiltration rate decreases, it is more 52.
(12) Furrow Irrigation System Design for Clay Soils in Arid Regions. economic to use long furrow lengths. However, this study can say nothing about this relationship for soils with higher infiltration rates.. References Bautista, E., and Wallender, W. W., 1985. “Spatial variability of infiltration in furrows.”, Trans. ASAE. 28(6), 1846-1851, 1855. Childs, J. L., Wallender, W. W., and Hopmans, J. W., 1993. “Spatial and Seasonal Variation of Furrow Infiltration”, Journal of Irrigation and Drainage Engineering, ASAE, 119(1), 74-90. Fok Y. S., and Bishop, A. A., 1965. “Analysis of water advance surface irrigation.” J. of Irrigation and Drainage Div., ASCE, 91(1), 99-116. Gates, T. K., and Grismer. M. E., 1989. “Irrigation and drainage strategies in salinityaffected regions.” J. of Irrigation and Drainage Engineering, ASCE, 115(2), 255-283. Ghassemi, F.J., A.J.; Nix, H.A., 1995. Salinisation of land and water resources : human causes, extent, management and case. University of New South Wales Press,1995. xviii, 526 p. : ill., maps ; 24 cm Greminger, P. J., Sud, Y. K., and Nielson, D. R., 1985. “Spatial variability of field-measured soil-water characteristics. “ Soil Sci. Soc. Am. J., 49, 1075-1082. Nielsen, D.R., J.W. Biggar and K.T. Erh, 1973. Spatial variability of field measured soilwater properties. Hilgardia 42(7):215-259. Prasher, S.O., M. Singh, A.K. Maheshwari, R.S. Clemente, 1997. Effect of spatial variability in hydraulic conductivity on water table drawdown. Transactions of the ASAE: 40(2): 371-375. Postel, Sandra, 1999. Pillar of sand: can the irrigation miracle last? New York:W.W. Norton. 313 p. Reddy, J. M., and Clyma, W., 1981a. “Optimal Design of Border irrigation systems”, Journal of irrigation and Drainage Engineering, ASAE 107(3): 1013-1042. Reddy, J. M., and Clyma, W., 1981b. “Optimal Design of Furrow irrigation systems”, Transactions of the ASAE 24(3): 617-623. Skogerboe G. V., 1969. Analysis of small water management structures in irrigation distribution systems summary technical completion report. U.S. Clearinghouse for Federal Scientific and Technical. Information. PB-189391. Logan, Utah State University. Shirini K. and Raghuwanshi N. S., 1999. “Semiempirical Infiltration Equation For Furrow Irrigation systems”, Journal of Irrigation and Drainage Engineering, Vol. 125, No. 4, July/August. Walker, W.R., and Skogerboe G. V., 1987. Surface Irrigation Theory and Practice. Utah State University, USA. Wallender, W. W. and Rayej, M., 1987. “Economic Optimization of Furrow Irrigation with uniform and non-uniform soil”, Transactions of the ASAE 33(5): 1605-1611. Zerihum D., Feyen J., Mohan Reddy J., and Wang Z., 1999. “Minimum Cost Design of Furrow Irrigation systems", Transactions of the ASAE (American Society of Agricultural Engineers, Vol. 42(4): 945-955.. Appendix I: Notation List a, is an empirical fitting parameter α1 and α 2 , are top width factor parameters A , is the average area Ao , is the cross-sectional flow area at the field inlet. σ z , is the the sub-surface shape parameter σ y , is the surface shape parameter 53.
(13) Eldeiry et al.. σ1 and σ2, are area shape factor parameters γ and γ , are wetted perimeter factor parameters 1. 2. B, is the top width of water in the furrow Ea, is the application efficiency fo, is the basic infiltration rate k, is an empirical fitting parameter L, is the length of the furrow n, is the Manning roughness coefficient P, is an empirical fitting parameter Qo, discharge at the inlet of the field r, is an empirical fitting parameter So, is the field slope t, time ts, is the advanced at time at distance s τ, is the opportunity time T(co), is the cutoff time in minutes Vy(t), volume of water at the surface Vz(t), volume of water infiltrated Wf , furrow width WP, is the wetter perimeter of the furrow X, furrow distance Z(req), is the depth required to be filled Z, is the volume of infiltrated water per unit length. 54.
(14)
Figure
Related documents
The Scandinavian Brown Bear Research Project is a co-operation between Sweden and Norway, and has a number of different goals such as studying the bear´s choice of food,
More research can also be done on difference between different consciousness-raising groups online, and differences between different social media platforms, as it is important
How can we frame the research within urban studies, in order to analyse the effects of halal food consumption on the urban tissue (how the places where people buy, consume and
Min uppfattning är att motståndshandlingar genom våld och våldsamhet, som jag uttolkat som motståndsmetoder i ”From Protest to Resistance” samt ”Setting Fire
[r]
Jag började arbeta med trådar, som skulle skapa en rumslighet, men samtidigt inte stänga ute ljuset, utan istället fånga upp det, och leda ner dagsljuset som idag inte når ner
In order to create a long-term successful offshore outsourcing, it is of essence for companies to have guidance in how to establish and maintain an effective and
Since 59 percent of the articles does stand as the main article of this day, without the need to precisely clarify when the event took place, I would say that indicates that the
