Journal for Person-Oriented Research
2017, 3(2), 86-100Published by the Scandinavian Society for Person-Oriented Research Freely available at http://www.person-research.org
DOI: 10.17505/jpor.2017.08
86
Revisiting measurement invariance in intelligence testing
in aging research: Evidence for almost complete metric
invariance across age groups
Briana N. Sprague*, Jinshil Hyun, & Peter C. M. Molenaar
Department of Human Development and Family Studies, The Pennsylvania State University, 119 Health and Human Development Building, University Park, PA, 16802, USA
* Corresponding author.
Email address:
sprague.briana@gmail.com
To cite this article:
Sprague, B.N., Hyun, J., & Molenaar, P. C. M. (2017). Revisiting measurement invariance in intelligence testing in aging research: Evidence for almost complete metric invariance across age groups. Journal for Person-Oriented Research, 3(2), 86-100. DOI: 10.17505/jpor.2017.08.
Abstract
Background/Objectives: Invariance of intelligence across age is often assumed but infrequently explicitly tested. Horn and McArdle (1992) tested measurement invariance of intelligence, providing adequate model fit but might not consider all relevant aspects like subtest differences. The goal of the current paper is to explore age-related invariance of the WAIS-R using an alternative model that allows direct tests of age on WAIS-R subtests.
Methods: Cross-sectional data on 940 participants aged 16-75 from the WAIS-R normative values were used. Subtests examined were information, comprehension, similarities, vocabulary, picture completion, block design, picture arrange-ment, and object assembly. The two intelligence factors considered were fluid and crystallized intelligence. Self-reported ages were divided into young (16-22, n = 300), adult (29-39, n = 275), middle (40-60, n = 205), and older (61-75, n = 160) adult groups.
Results: Partial metric invariance holds in the WAIS-R. Although most subtests reflected fluid and crystalized intelligence similarly across different ages, invariance did not hold for block design on fluid intelligence and picture arrangement on crystallized intelligence for older adults. Additionally, there was evidence of a correlated residual between information and vocabulary for the young adults only. This partial metric invariance model yielded acceptable model fit compared to previously-proposed invariance models of Horn and McArdle (1992).
Conclusion: Almost complete metric invariance holds for a two-factor model of intelligence. Most subtests were invariant across age groups, suggesting little evidence for age-related bias in the WAIS-R. However, we did find unique relationships between two subtests and intelligence. Future studies should examine age-related differences in subtests when testing measurement invariance in intelligence.
Keywords:
WAIS-R, Measurement Invariance, Intelligence, Cognitive Aging.Introduction
Understanding how intelligence differs or changes across the lifespan is a question developmental researchers have explored for decades (e.g., Schaie, Maitland, Willis, &
Intrieri, 1998). Intelligence is frequently conceptualized as two factors - fluid intelligence, or skills involving adapta-tion or integraadapta-tion of novel informaadapta-tion, and crystallized intelligence, or acquired knowledge (Cattell, 1963). When examining developmental differences or changes in intelli-gence, it is critical to establish measurement invariance, or
87 the assumption that measures function in the same way across varied conditions, e.g., age, so that the measures are not systematically biased across the varied conditions (Millsap, 2011; Sass, 2011). Recently, Wicherts (2016) argued that failure to establish measurement invariance is problematic because disparities could be perpetuated by imposing universal, normative values on groups outside of those used to establish the normative values.
Unfortunately, measurement invariance in intelligence testing is assumed but infrequently examined. When age-related invariance is examined in adults, it generally remains stable except for young and older adults (Schaie et al., 1998). Previous work by Horn and McArdle (1992) examined age-related invariance in a common intelligence battery, the Wechsler Adult Intelligence Scale-Revised (WAIS-R; Wechsler, 1981). In brief, they found invariance held across adults aged 16-75 when assuming a two-factor complex model of intelligence but did not hold when using alternative intelligence models like a single-factor g or a two-factor simple structure model (see Figure 1 for their final model). In this model, alternative fit indices such as RMSEA, standardized RMR, CFI, and NNFI were acceptable, but the values were significant, suggesting significant omnibus model misfit. This may be due to a large sample size (Brown, 2006), but it suggests alternative models may be at least as tenable as the Horn and McArdle (1992) model. Adapting their model to relax the assumption of pure measurement invariance through examining partial measurement invariance may address substantive issues (Byrne, Shavelson, & Muthén, 1989). For example, if a specific subtest was related to both fluid and crystallized intelligence (henceforth Gf and Gc, respectively), it would be important to examine if the subtest was as influential to both constructs across age. If it was not, this could indicate the meaning of the subtest was changed either with, or as a result of, age.
Additionally, Horn and McArdle’s (1992) analytic strategy poses some limitations. In their analyses, they modeled age to predict the two latent intelligence factors (Gf and Gc, or performance in verbal in their manuscript) instead of modeling age as a predictor of each subtest. This was partly problematic due to how previous studies have conceptualized intelligence; not all studies used the same two-factor performance and verbal intelligence model (Bowden, Weiss, Holdnack, & Lloyd, 2006; Molenaar & Borsboom, 2013), so the effect of age on intelligence may not be consistent across studies if a two-factor intelligence solution was not present. This was also problematic because the two latent variables did not obey simple struc-ture, i.e., subtests did not load onto one latent factor only, since the subtests could be related to both intelligence factors. Although each subtest was allowed cross-loadings, some subtests may have had small but statistically signifi-cant cross-loadings. For example, if vocabulary (concep- tualized as a measure of Gc) was allowed to cross-load onto the Gf factor but has a small loading on it, one would
expect that it was less sensitive to age-related differences compared to a subtest that had a higher loading on the Gf factor (e.g., block design). However, this would not neces-sarily be evident using the method Horn and McArdle (1992) proposed. Rather, a person may erroneously assume older adults would uniformly perform worse on all of Gf subtests, including vocabulary. In reality, the older adults likely have similar performance to younger adults on the vocabulary subtest. If the factors were used to examine age-related differences without considering age-related differences in the subtests themselves, some of the factor differences may be dampened by less robust subtests.
Directly testing the subtests also allows more nuanced explorations of the age-subtests relationships. For example, certain subtests may be related to each other independent of verbal or performance scores, and this relationship may only appear for certain age groups. That is, there could be more intelligence factors than a two-factor solution that appears in certain age groups only. Implementing a more flexible, partial invariance model could uncover develop-mentally meaningful differences in the structure of intelli-gence across age.
The proposed analytic strategy is novel in its application but not in its rationale. Previously, similar models were pro- posed to examine substantively-interesting questions such as the effect of age on cognitive and non-cognitive factors (Allen et al., 2001). As with any analytic strategy, this method will answer specific a priori research questions and may not be appropriate for all invariance-related research questions. Cases where this method would be preferred to other invariance-testing methods (e.g., Horn & McArdle, 1992) would be instances where restricting age to predict the factor itself would be unnecessarily restrictive. This model, conversely, will allow age to directly predict subtest performance and bypass the emphasis of age on the factors only. Practically speaking, this tests whether age is associ-ated with subtest performance within each age grouping. A sample research question this strategy could address would be, “Within the young adult age group, is performance across the eight WAIS-R subtests predicted by age?” If re- searchers are interested in within-group variability in sub-test scores, this method would be appropriate or preferable.
Lastly, although this model answers substantively different research questions, it tests invariance because the underlying model building process is the same as previous methods (Horn & McArdle, 1992; Meredith, 1993). Although this proposed method is not evaluating pure measurement invariance because of the direct age-subtest loadings, it does allow for exploration of age-related in- variance and whether the direct effect of age on intelligence subtests are equivalent across age groups. The critical differences between this and the Horn and McArdle (1992) model are (1) observed age loading on specific subtests instead of the latent factor age loading on the intelligence factors, and (2) relaxing the assumption of full metric invariance.
Sprague et al.: Invariance testing in intelligence
88
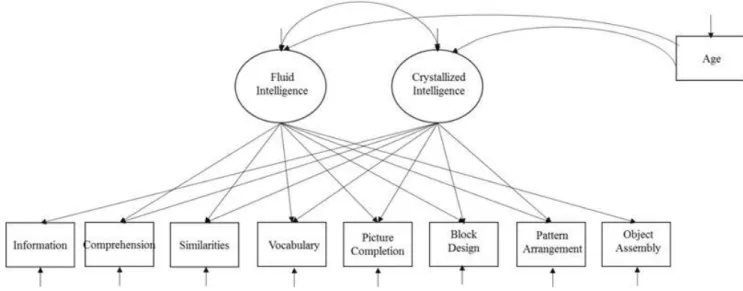
Note. All subtests were allowed to cross-load on both the fluid and crystallized intelligence factors except Information on Gf and Object Assembly on Gc. The factor loadings of information on crystallized intelligence (lambda 1,1; see Appendix 1), object assembly on fluid intelligence (lambda 8,2; see Appendix 1), and age on the age factor (lambda 9,3; see Appendix 1) remained fixed to 1 for scaling pur-poses.
Figure 1. Visual Schematic of the Original Horn and McArdle (1992) Invariance Model.
Goals of Current Paper
The current study was a short response to Horn and McArdle (1992). Using the same WAIS-R normative data, the aim of the current study was to test measurement in- variance across age groups, accounting for differences in intelligence subtests. This was addressed in two ways. First, we examined an alternative model that allowed subtests to directly load onto age and relaxed assumptions of factor loading equality across age. Relaxing the factor loading equality constraint allowed for partial measurement invari-ance evaluation (Byrne et al., 1989). It is important to note that this alternative model did not strictly test invariance of the WAIS-R but rather evaluated age-related invariance and whether the direct effect of age on WAIS-R subtests was similar across age groups. The final model was evaluated against the original Horn and McArdle (1992) model using two metrics, (1) χ2 goodness-of-fit, and (2) χ2 difference tests. The purpose of the evaluations was to examine whether model fit using the most conservative fit index and ensure the additional parameters did not unnecessarily complicate the proposed model compared to existing models, respectively. Second, we examined the factor means of the final model to examine whether mean performance on the factors differed as a function of age. Additional model features, such as within-group variability, were also examined.
Method
Sample
Data were used from the statistics provided by Horn and McArdle (1992). The data used were collected between 1976 and 1980 by the Psychological Corporation for the WAIS-R (Wechsler, 1981), a pencil-and-paper test designed to assess intelligence in adults 16 and older. Additional details can be found in the WAIS-R manual.
There were data available for 940 individuals; self-reported age at the time of assessment was the only demographic covariate of interest for the current analyses. The sample was divided into four age groups, abbreviated young (16-22, n = 300), adult (29-39, n = 275), middle (40-60, n = 205), and older (61-75, n = 160). In the original Horn and McArdle article (1992), the analytic sample was a random selection of 50% of the full sample.
Eight of the 11 WAIS-R subtests were used for these analyses: information, comprehension, similarities, voca- bulary, picture completion, block design, picture arrange-ment, and object assembly. To keep continuity in naming conventions between the current paper and the larger body of literature, the two factors were Gf and Gc, representing the performance and verbal factors in the original (Horn & McArdle, 1992) text, respectively. The raw-score means and standard deviations were used in these analyses. Scores represented the percent correct.
89 Three WAIS-R variables were omitted in the original and the current analyses. These subtests were arithmetic, memory span, and digit symbol substitution. In the original analyses, these were omitted because work suggested that these subtests were narrow or complex indicators of factors not well sampled and could not be sampled in the original paper (Horn & McArdle, 1992). Other work found these subtests may represent a factor of freedom from distracti-bility (Burton, Ryan, Paolo, & Mittenberg, 1994; Gignac, 2005; Leckliter, Matarazzo, & Silverstein, 1986; Waller & Waldman, 1990), but the three-factor model was not con-sidered here in order to allow direct comparison to the model proposed by Horn and McArdle (1992).
Analytic Strategy
To assess invariance, the current analyses followed Meredith’s (Meredith, 1993) invariance testing. Importantly, these series of invariance tests modified traditional invari-ance by including age both as a grouping variable and as a factor. That is, configural and metric invariance were tested in the Gf and Gc factors across age groups, but these equa- lity constraints were not imposed on the age factor. The age factor was used for interpreting within-group effects of age on subtest performance. Implications of this model inter-pretation will be discussed.
Configural invariance was tested by examining if the same pattern of freed and fixed parameters held across the four age groups for the Gf and Gc factors. Next, metric invariance (i.e., weak factorial invariance) was tested by examining if the factor loadings were equivalent across groups for the Gf and Gc factors. Using modification indi-ces, parameters were allowed to vary across groups until acceptable model fit was obtained. Similarly, non-signifi- cant values were constrained to 0 in a modified stepwise fashion; to reduce the number of iterations, all values with t-values less than 1.5 were constrained to 0 and analyses were rerun to determine if any more non-significant path-ways needed to be pruned. A value of t = 1.5 was chosen as a conservative value to ensure that significant values were kept, as fixing parameters impacts the significance of other
values. Significance was set at p < .01 for all χ2 tests. Crit-ical values for the RMSEA and standardized RMR were ≤ .05, and critical values for NNFI and CFI were ≥ .95. More detail on critical values can be found in introductory texts for confirmatory factor analysis (Brown, 2006). All analyses were run using LISREL 8.12 (Jöreskog & Sörbom, 1988).
Results
Configural Invariance Testing
Configural invariance was obtained across the four groups, χ2 (52) = 75.61, p = .018, demonstrating that the pattern of fixed and freed parameters, i.e., allowing each subtest to cross-load onto each intelligence factor and age, was the same across age groups. The alternative fit indices also suggested configural invariance was tenable (RMSEA = .022, standardized RMR = .013, NNFI = .99, CFI = 1.00). See Figure 2a for a visual schematic of the final model and Table 1 for the omnibus fit statistics.
Complete Metric Invariance Testing
First, complete metric invariance was tested. The model had poor χ2 model fit, χ2(88) = 190.94, p < .001, but the alternative fit indices generally suggested acceptable model fit (RMSEA = .035, NNFI = .97, CFI = .98) except for the standardized RMR (standardized RMR = .11).
Next, vocabularly’s loading on the Gf factor was con-strained to zero for all groups due to a small factor loading; this model had poor χ2 model fit, χ2 (89) = 190.95, p < .001, but the alternative fit indices generally suggested accepta-ble model fit (RMSEA = .035, standardized RMR = .11, NNFI = .97, CFI = .98). The significant χ2 may be due to the large sample size. Compared to the model without the constraint of vocabulary on the Gf factor, this model did not yield significant model misfit using χ2 difference test-ing, χ2 difference (1), = .01, p = .92. See Figure 2b for a visual schematic of the final model and Table 1 for the om-nibus fit statistics.
Table 1. Fit Statistics for Final Models. Configural Invariance Complete Metric Invariance Partial Metric Invariance Partial Metric Invariance + Means df = χ2 value 52 = 75.61 89 = 190.95** 106 = 135.69 126 = 250.27* RMSEA .02 .04 .02 .06 Standardized RMR .01 .11 .06 .05 NNFI .99 .97 .99 .99 CFI 1.00 .98 .99 .99
Note. RMSEA = Room Mean Square Error of Approximation; RMR = Root Mean Square Residual; NNFI = Non-Normed Fit Index; CFI = Comparative Fit Index. *p < .01, **p < .001.
Sprague et al.: Invariance testing in intelligence
90 a.
Note. Figure 2a. All subtests were allowed to cross-load on both the fluid and crystallized intelligence factors. The test for configural invariance assessed whether the pattern of freed and fixed parameters (i.e., do all WAIS-R subtests load onto both the fluid and intelli-gence factors for all age groups) was equivalent across all groups. Fit indices indicated configural invariance was met, χ2(52) = 75.61, p = .018. The factor loadings of information on crystallized intelligence (lambda 1,1; see Appendix 1), object assembly on fluid intelli-gence (lambda 8,2; see Appendix 1), and age on the age factor (lambda 9,3; see Appendix 1) remained fixed to 1 for scaling purposes. Age was also tested as a latent variable, and the model results did not change.
b.
Note. Figure 2b: The test for complete metric invariance assessed whether the factor loadings were equivalent across all age groups. Fit indices indicated the final model for complete metric invariance was not tenable using the conservative χ2 test, χ2 (89) = 190.95, p < .001. However, alternative fit indices indicated acceptable model fit (RMSEA = .035, standardized RMR = .11, NNFI = .97, CFI = .98). The factor loading of the fluid intelligence factor on information and vocabulary for all ages was fixed to zero, so the pathway was removed. Additionally, the factor loading of crystallized intelligence on object assembly for all ages was fixed to zero and were also removed. Be-cause the factor loading of age on the intelligence subtests was not of interest in this stage, all factor loadings were constrained to be equal across age groups. The factor loadings of information on crystallized intelligence (lambda 1,1; see Appendix 1), object assembly on fluid intelligence (lambda 8,2; see Appendix 1), and age on the age factor (lambda 9,3; see Appendix 1) remained fixed to 1 for scaling purposes. Age was also tested as a latent variable, and the model results did not change.
91 c.
Note. Figure 2c: The test for partial metric invariance assessed whether the factor loadings were mostly equivalent across all age groups. In all but three instances, this invariance held. In fluid intelligence, the factor loading on block design (bolded) was smaller in the older adult group only (.74 in young, adult, and middle adults vs. .39 in older adults). In crystallized intelligence, the factor loading on pattern arrangement (bolded) was smaller in the older adult group only (1.16 in young, adult, and middle adults vs .67 in older adults). Addition-ally, the correlated residual between information and vocabulary (dashed line) was in the younger adult group only. The factor loading of age on the intelligence subtests varied substantially and are described in Figure 6. Fit indices indicated the final model for partial metric invariance was tenable, χ2 (106) = 135.69, p = .027. The factor loadings of information on crystallized intelligence (lambda 1,1; see Ap-pendix 1), object assembly on fluid intelligence (lambda 8,2; see ApAp-pendix 1), and age on the age factor (lambda 9,3; see ApAp-pendix 1) remained fixed to 1 for scaling purposes. Age was also tested as a latent variable, and the model results did not change.
Figure 2. Visual Schematic of the Invariance Models.
Partial Metric Invariance Testing
To explore partial invariance testing, several pruning and parameter adjustment steps (i.e., freed or fixed parameters in the lambda matrix) were run. In these steps, lambda matrix estimates, or the estimates of the latent factors (i.e., Gf, Gc, age) on the WAIS-R subtests, were either set to zero, or the equality constraint across age groups was removed. These were done in a modified stepwise fashion; estimates were set to zero if the t-value was < 1.5. Equality constraints were removed if the modification indices sug-gested that the constraint removal would significantly im-prove model fit. These steps were done until χ2 difference tests revealed significant model misfit. After this, correlated residuals (i.e., theta-epsilon matrix, or the residual error of the WAIS-R subtests) between the information and voca- bulary subtests for young adults were allowed as deter-mined by modification indices. This final model had acceptable fit, χ2(106) = 135.69, p = .027. The alternative fit indices generally supported partial metric invariance (RMSEA = .017, standardized RMR = .056, NNFI = .99,
CFI = .99). Compared to the final model proposed by Horn and McArdle (1992), this model provided significantly better model fit, χ2(6) = 85.07, p < .001. There were no differences in model fit when age was treated as an observed variable instead of a latent variable. See Figure 2c for a visual schematic of the final model and Table 1 for the omnibus fit statistics.
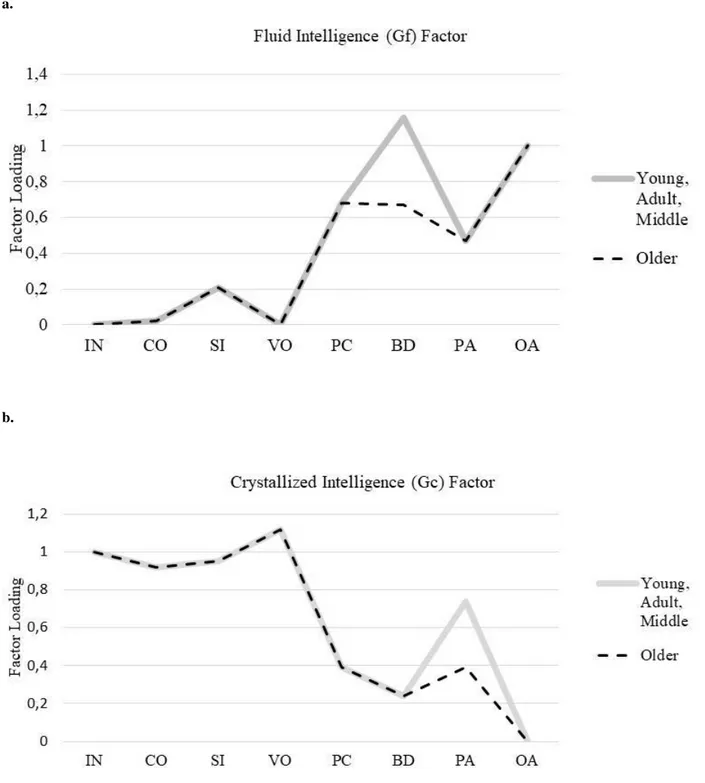
In the final model, Gf was less predictive of block design (BD) for older adults than in the younger three groups (Figure 3a). Gc was less predictive of pattern assembly (PA) for older adults than in the three younger age groups (Figure 3b). All other subtests across the two factors were invariant, demonstrating the same factor loadings across age groups. For both factors, older adults also had higher variance compared to the other age groups, demonstrating greater variability in the Gf and Gc factors. For example, compared to young adults, older adults had a larger Gf variance (231.84 vs. 355.24); similarly, compared to young adults, older adults had a larger Gc variance (126.11 vs. 303.00). See Appendix 1 for the final model syntax.
Sprague et al.: Invariance testing in intelligence
92 a.
b.
Note. IN: Information, CO: Comprehension, SI: Similarities, VO: Vocabulary, PC: Picture Completion, BD: Block Design, PA: Pattern Arrangement, OA: Object Assembly
93
Note. The mean differences with respect to the younger adults of adult, middle adult, and older adult age groups. Fluid intelligence was stable for the young and adult groups; there was a steep decrease across the two older adult groups. Meanwhile, crystallized intelligence increased in adulthood, was mostly maintained in middle adulthood, and decreased in older adulthood. Older adults performed statisti-cally equivalent to the young adults in the crystallized intelligence factor.
Figure 4. Mean Latent Score By Age Group.
Sprague et al.: Invariance testing in intelligence
94
Note. IN: Information, CO: Comprehension, SI: Similarities, VO: Vocabulary, PC: Picture Completion, BD: Block Design, PA: Pattern Arrangement, OA: Object Assembly.
Figure 6. Factor Loadings of WAIS-R Subtests on Age Factor.
Means Modeling
When latent means are not explicitly modeled, as was the case in the previous models (Figures 2a-2c), they are assumed to be zero (Kline, 2011). Latent mean scores were added to the final model to compare performance across the age groups. The young adult served as the reference group, so mean scores represented deviations in mean from the young adult group. That is, if a score was negative, the mean score of that group was lower than the young adults. This final model had poor model fit when using the test, χ2(126) = 250.27, p < .01, but this was likely due to a large sample size (Table 1). The alternative fit indices indicated acceptable model fit (RMSEA = .064, standardized RMR = .050, NNFI = .99, CFI = .99). In comparison to young adults, adults and middle adults had higher mean Gc, and older adults had the same Gc mean as young adults. In Gf, however, mean scores for young adults and adults were the same, and mean scores decreased for middle adults and older adults (Figure 4). See Appendix 2 for the final means model syntax.
Additional Descriptive Features of Final Model
In addition to means testing, this analysis also modeled within-group variability for both intelligence factors. In both the Gf and Gc factors, there was higher within-group
variability for the older adults compared to the other adult groups. This was especially true for Gf. This demonstrates that within the older adult group, Gf scores were more varied compared to other age groups; this is also true but less dramatic in Gc (Figure 5).
Lastly, this analysis modeled age-related differences on subtest performance within each age group (Figure 6). For young adults, there were higher factor loadings of subtests on age, particularly those associated more strongly with Gc. In comparison, adults, middle, and older adults did not have strong loadings. This indicated that for young adults, higher age was associated with better performance on all subtests; this association was more pronounced in measures more associated with Gc.
Discussion
Previous work, notably by Horn and McArdle (1992), among others (O'Grady, 1983; Parker, 1983; Silverstein, 1985), have attempted to understand the factor structure and age-related invariance of intelligence using the WAIS-R. The major aim of this study was to examine whether an alternative model could uncover either full or partial metric invariance across different adult age groups.
Compared to the model proposed by Horn and McArdle (1992), the final model in these analyses had both accept- able model fit using the most conservative χ2 test and found
95 that partial metric invariance held, indicating that Gf and Gc were mostly stable across adult age groups. The model comparison also suggested the introduction of these addi-tional parameters did not unnecessarily complicate the model. Invariance held on all subtests except block design on the Gf factor and pattern assembly on the Gc factor for older adults. For both of these subtests, the factor loadings were weaker for older adults than the three younger groups, indicating that the underlying intelligence factors did not predict these subtests as strongly for older adults as they did for the other age groups.
In the young group only, there was a correlated residual between the information and vocabulary subtests. This rela-tionship, equivalently conceptualized as a factor, was un- related to Gf and Gc. χ2 difference tests indicated this addi-tional factor should be included, χ2 difference = 35.88, de-grees of freedom difference = 1, p < .001. This unnamed factor may be important to explore further, particularly for cognitive development in late adolescence and young adulthood. It is possible, however, that the factor is in- appropriate in other datasets. Future work should examine if this represents a true intelligence factor independent of Gf and Gc or if this is a dataset-specific artifact.
Analyses examining latent mean differences between groups replicated results found elsewhere (Kaufman & Horn, 1996); Gf means were significantly lower for older adults, whereas Gc means improved across adulthood and were relatively stable for middle and older adults. It is important to note that these were cross-sectional data and should not be interpreted as changes over time, but these findings were similar to previous longitudinal work examining age-related intelligence changes (McArdle, Ferrer-Caja, Hamagami, & Woodcock, 2002). Even with cross-loadings, this model is capable of uncovering patterns that theoretically align with previous work.
This analysis also revealed within-group influences of age on specific subtests, particularly for young adults. For the young adult group, age played a significant role in performance, particularly for the tests considered to typify Gc (information, comprehension, similarities, and vocabu-lary). This relationship demonstrated that within young adults (16-22 years old), older age was associated with better Gc performance, replicating previous findings (Hartshorne & Germine, 2015; Kaufman & Horn, 1996; Wisdom, Mignogna, & Collins, 2012). In the other age groups, age did not substantially affect subtest performance, indicating that subtest performance did not substantially fluctuate within a group after the early 20s.
When examining the within-group variance on the Gf and Gc factors, a different pattern emerged. For older adults, there was larger within-group variability on both the Gf and Gc factors compared to the other adult groups, replicating previous work demonstrating increased heterogeneity in older adulthood (Ardila, 2007; Christensen et al., 1994; Hultsch, MacDonald, & Dixon, 2002; Mella, Fagot, & de Ribaupierre, 2016; Rabbitt, 1993; Stone, Lin, Dannefer, &
Kelley-Moore, 2017; Sylvain-Roy & Belleville, 2015; Ylikoski et al., 1999). Some posit that increased variability in older age is due to a lifetime of accumulating risk and protective factors like increased brain pathology (Rabbitt, 2011), but others find an increased variability is not inevi-table across one’s cognitive development (Salthouse, 2011) or may be due to ceiling effects in young adulthood (Green, Shafto, Matthews, Cam-CAN, & White, 2015). Future work should examine if this pattern holds longitudinally, and if so, elucidate potential mechanisms of increased variability (e.g., ceiling effects in youth).
A Brief Note on Parsimony
Although previous investigations into whether the WAIS-R was invariant across age used more statistically parsimonious models, there may be instances where statis-tical parsimony may be overly simplistic. A more statisti-cally complex model, like that presented in this study, would be appropriate if constraining the age-subtest rela-tionship to be entirely explained through the latent factors (i.e., Gf or Gc) would be too restrictive. For example, it may be of interest that there is greater within-group varia-bility in vocabulary than similarities subtest performance for young adults. If the more statistically parsimonious model was used (Horn & McArdle, 1992), it would be erroneously assumed that within-group variability would be equal across the two subtests. In this case, the direct path from age to the subtest would more faithfully reproduce the age-subtest relationships. Ultimately, substantive research questions will dictate which invariance test models are appropriate. Comparing competing invariance models with a χ2 difference test may indicate that direct age effects are both statistically and substantially meaningful. However, using both more parsimonious (Horn & McArdle, 1992) and more complex models in tandem can provide a more holistic understanding of age-related effects on intelligence subtests.
Strengths, Limitations, and Future Directions
This study has a few limitations worth noting. Since these are cross-sectional data from the late 1970s, we are unable to extrapolate longitudinal changes from these data. However, this analytic strategy could be implemented in longitudinal research to examine how invariance does or does not hold over time. Relatedly, this study should be replicated in more recent cohorts and recent versions of the WAIS to ensure that the same pattern of invariance holds and that these results were not an artifact of period effects. These analyses were exploratory, so some patterns such as the correlated residual between information and vocabulary in the young adults may not hold across samples. Future studies with more recent versions of the WAIS are also required to replicate and further examine the partial metric invariance revealed in the current study, as these are
Sprague et al.: Invariance testing in intelligence
96 exploratory and may either be substantively meaningful or an artifact of this dataset.
In addition to the exploratory nature of this model, it is not clear whether partial metric invariance using this model would hold across other, more recent versions of the WAIS. Invariance does not necessarily hold from the WAIS-R to more recent versions like the WAIS-III or WAIS-IV (Benson, Beaujean, & Taub, 2015), so this factor structure may not hold across test versions. If researchers or clini-cians change intelligence measures during their study, it is important to test invariance across versions to ascertain if comparisons between versions are feasible.
One last limitation of this analytic strategy is that this model is not a pure test of invariance. Instead, this model simultaneously tests age invariance and the effect of age on subtest performance. If one wishes to only analyze invari-ance and is not interested in direct effects, such as the effect of age or gender on WAIS-R subtests or other manifest variables, this analytic strategy would not be appropriate. If one wishes to use this model, it is recommended to first establish pure invariance before introducing covariates into modified invariance tests.
However, this analytic strategy has several strengths worth highlighting. Namely, one is able to directly model within-group variability in subtest performance inde- pendent of intelligence factors. In gerontological research, within-group heterogeneity is implied but rarely examined (Stone et al., 2017). Using this alternative model, there are two ways to explore within-group heterogeneity: (1) through the factor variance (eta) scores, and (2) the factor loadings of the WAIS-R subtests on the age factor. This approach provides a nuanced understanding of the rela-tionship between age, intelligence, and the WAIS-R sub-tests. For instance, older adults had greater variability in the intelligence factor scores than young adults (Figure 5), but there were larger age effects on WAIS-R subtests in young adults compared to older adults (Figure 6). These differen-tial results suggest within-group variability may be dependent on whether a manifest (e.g., WAIS-R subtest) or latent (e.g., Gf or Gc) variable is of interest and warrant future exploration (Stone et al., 2017).
Taken together, these results demonstrate the utility of using a modified invariance test to evaluate intelligence across and within age groups. Future research should examine longitudinal invariance to assess whether this same pattern of partial metric invariance holds. Similarly, future studies could extend these analyses to the middle-old and oldest-old (i.e., older adults 75+) to examine both factor structure and mean performance changes to explore if intelligence is stable throughout older adulthood.
Conclusion
This study found partial metric invariance held across different age groups on the WAIS-R using a two-factor intelligence model. This method will allow examination of
questions above pure measurement invariance, like which subtests are not invariant for which age groups. Additional-ly, this model is flexible enough to handle exploration of within-group age influences. Although theory and specific research questions will dictate the use of this or previously proposed models (i.e., Horn & McArdle, 1992), this model is not unnecessarily complex (as determined by χ2 differ-ence tests) and yields acceptable model fit across several indices. Future work should examine whether partial metric invariance holds across newer WAIS versions or longitudi-nally.
Acknowledgments
Portions of these results were presented at the 68th Annu-al GerontologicAnnu-al Society of America Meeting in Orlando, Florida.
Funding: B. N. Sprague received additional support by the Joseph and Jean Britton Distinguished Graduate Fel-lowship through The College of Health and Human Devel-opment and The Center for Healthy Aging, The Pennsylva-nia State University.
Authors’ Contributions:
PCMM, BNS, and JH designed the research questions. BNS and JH completed the statistical analyses. BNS draft-ed the first version of the manuscript and revisdraft-ed the man-uscript based on coauthor feedback. All authors read and approved the final manuscript.
References
Allen, P. A., Hall, R. J., Druley, J. A., Smith, A. F.,
Sanders, R. E., & Murphy, M. D. (2001). How shared are age-related influences on cognitive and noncognitive variables? Psychology and Aging, 16(3), 532-549. doi:10.1037//0882-7974.16.3.532
Ardila, A. (2007). Normal aging increases cognitive heterogeneity: Analysis of dispersion in WAIS-III scores across age. Archives of Clinical Neuropsychology, 22(8), 1003-1011. doi:10.1016/j.acn.2007.08.004
Benson, N., Beaujean, A. A., & Taub, G. E. (2015). Using score equating and measurement invariance to examine the Flynn effect in the Wechsler Adult Intelligence Scale. Multivariate Behavioral Research, 50, 398-415. doi:10.1080/00273171.2015.1022642
Bowden, S. C., Weiss, L. G., Holdnack, J. A., & Lloyd, D. (2006). Age-related invariance of abilities measured with the Wechsler Adult Intelligence Scale- III. Psychological Assessment, 18(3), 334-339.
doi:10.1037/1040-3590.18.3.334
Brown, T. A. (2006). Confirmatory factor analysis for applied research. New York, NY: The Guilford Press.
97 Burton, D. B., Ryan, J. J., Paolo, A. M., & Mittenberg, W.
(1994). Structural equation analysis of the Wechsler Adult Intelligence Scale—Revised in a normal elderly sample. Psychological Assessment, 6(4), 380-385. doi:10.1037/1040-3590.6.4.380
Byrne, B. M., Shavelson, R. J., & Muthén, B. (1989). Testing for the equivalence of factor covariance and mean structures: The issue of partial measurement invariance. Psychological Bulletin, 105(3), 456-466. doi:10.1037/0033-2909.105.3.456
Cattell, R. B. (1963). Theory of fluid and crystallized intelligence: A critical experiment. Journal of Educational Psychology, 54(1), 1-22. doi:10.1037/h0046743
Christensen, H., Mackinnon, A., Jorm, A. F., Henderson, A. S., Scott, L. R., & Korten, A. E. (1994). Age differences and interindividual variation in cognition in community-dwelling elderly. Psychology and Aging, 9(3), 381-390 doi:10.1037/0882-7974.9.3.381
Gignac, G. E. (2005). Revisiting the factor structure of the WAIS-R: Insights through nested factor modeling. Assessment, 12(3), 320-329.
doi:10.1177/1073191105278118
Green, E., Shafto, M. A., Matthews, F. E., Cam-CAN, & White, S. R. (2015). Adult lifespan cognitive variability in the cross-sectional Cam-CAN cohort. International Journal of Environmental Research and Public Health, 12(12), 15516-15530. doi:10.3390/ijerph121215003 Hartshorne, J. K., & Germine, L. T. (2015). When does
cognitive functioning peak? The asynchronous rise and fall of different cognitive abilities across the life span. Psychological Science, 26(4), 433-443.
doi:10.1177/0956797614567339
Horn, J. L., & McArdle, J. J. (1992). A practical and theoretical guide to measurement invariance in aging research. Experimental Aging Research, 18(3), 117-144. doi:10.1080/03610739208253916
Hultsch, D. F., MacDonald, S. W. S., & Dixon, R. A. (2002). Variability in reaction time performance of younger and older adults. Journal of Gerontology: Psychological Sciences, 57B(2), P101-P114. doi:10.1093/geronb/57.2.p101
Kaufman, A. S., & Horn, J. L. (1996). Age changes on tests of fluid and crystallized ability for women and men on the Kaufman Adolescent and Adult Intelligence Test (KAIT) at ages 17-94 years. Archives of Clinical Neuropsychology, 11(2), 97-121.
doi:10.1016/0887-6177(95)00003-8
Kline, R. B. (2011). Principles and practice of structural equation modeling (3 ed.). New York, NY: The Guilford Press.
Leckliter, I. N., Matarazzo, J. D., & Silverstein, A. B. (1986). A literature review of factor analytic studies of the WAIS-R. Journal of Clinical Psychology, 42(2), 332-342.
doi:10.1002/1097-4679(198603)42:2<332::AID-JCLP 2270420220>3.0.CO;2-2
McArdle, J. J., Ferrer-Caja, E., Hamagami, F., & Woodcock, R. W. (2002). Comparative longitudinal structural analyses of the growth and decline of multiple intelligence abilities over the life span. Developmental Psychology, 38(1), 113-142.
doi:10.1037//0012-1649.38.1.115
Mella, N., Fagot, D., & de Ribaupierre, A. (2016). Dispersion in cognitive functioning: Age differences over the lifespan. Journal of Clinical and Experimental Neuropsychology, 38(1), 111-126.
doi:10.1080/13803395.2015.1089979
Meredith, W. (1993). Measurement invariance, factor analysis, and factorial invariance. Psychometrika, 58(4), 525-543. doi:10.1007/bf02294825
Millsap, R. E. (2011). Statistical approaches to
measurement invariance. New York, NY: Routledge. Molenaar, D., & Borsboom, D. (2013). The formalization
of fairness: Issues in testing for measurement invariance using subtest scores. Educational Research and
Evaluation, 19(2-3), 223-244. doi:10.1080/13803611.2013.767628
O'Grady, K. E. (1983). A confirmatory maximum likelihood factor analysis of the WAIS-R. Journal of Consulting and Clinical Psychology, 51(6), 826-831. doi:10.1037/0022-006x.51.6.826
Parker, K. (1983). Factor analysis of the WAIS-R at nine age levels between 16 and 74 years. Journal of Consulting and Clinical Psychology, 51(2), 302-308. doi:10.1037/0022-006x.51.2.302
Rabbitt, P. (1993). Does it all go together when it goes? The nineteenth Bartlett memorial lecture. The Quarterly Journal of Experimental Psychology, 46A(3), 385-434. doi:10.1080/14640749308401055
Rabbitt, P. (2011). Between-individual variability and interpretation of associations between
neurophysiological and behavioral measures in aging populations: Comment on Salthouse (2011).
Psychological Bulletin, 137(5), 785-789. doi:10.1037/a0024580
Salthouse, T. A. (2011). All data collection and analysis methods have limitations: Reply to Rabbitt (2011) and Raz and Lindenberger (2011). Psychological Bulletin, 137(5), 796-799. doi:10.1037/a0024843
Sass, D. A. (2011). Testing measurement invariance and comparing latent factor means within a confirmatory factor analysis framework. Journal of Psychoeducational Assessment, 29(4), 347-363.
doi:10.1177/0734282911406661
Schaie, K. W., Maitland, S. B., Willis, S. L., & Intrieri, R. C. (1998). Longitudinal invariance of adult psychometric ability factor structures across 7 years. Psychology and Aging, 13(1), 8-20. doi:10.1037/0882-7974.13.1.8 Silverstein, A. B. (1985). Cluster analysis of the Wechsler
Sprague et al.: Invariance testing in intelligence
98 Psychology, 41(1), 98-100.
doi:10.1002/1097-4679(198501)41:1<98::aid-jclp22704 10117>3.0.co;2-j
Stone, M. E., Lin, J., Dannefer, D., & Kelley-Moore, J. A. (2017). The continued eclipse of heterogeneity in gerontological research. Journals of Gerontology: Social Sciences, 72(1), 162-167. doi:10.1093/geronb/gbv068 Sylvain-Roy, S., & Belleville, S. (2015). Interindividual
differences in attentional control profiles among younger and older adults. Neuropsychology, Development, and Cognition. Section B, Aging, Neuropsychology, and Cognition, 22(3), 259-279.
doi:10.1080/13825585.2014.926305
Waller, N. G., & Waldman, I. D. (1990). A reexamination of the WAIS-R factor structure. Psychological
Assessment: A Journal of Consulting and Clinical Psychology, 2(2), 139-144.
doi:10.1037/1040-3590.2.2.139
Wechsler, D. (1981). Manual for the Wechsler Adult Intelligence Scale-Revised. New York: Psychological Corporation.
Wicherts, J. M. (2016). The importance of measurement invariance in neurocognitive ability testing. The Clinical Neuropsychologist, 30(7), 1006-1016.
doi:10.1080/13854046.2016.1205136
Wisdom, N. M., Mignogna, J., & Collins, R. L. (2012). Variability in Wechsler Adult Intelligence Scale-IV subtest performance across age. Archives of Clinical Neuropsychology, 27(4), 389-397.
doi:10.1093/arclin/acs041
Ylikoski, R., Ylikoski, A., Keskivaara, P., Tilvis, R., Sulkava, R., & Erkinjuntti, T. (1999). Heterogeneity of cognitive profiles in aging: successful aging, normal aging, and individuals at risk for cognitive decline. European Journal of Neurology, 6(6), 645-652. doi:10.1046/j.1468-1331.1999.660645.x
APPENDICES
Appendix 1. Final Model LISREL Syntax.
WAIS-R Young
da no=300 ni=9 ma=cm ng=4 km sy fi=Cor.doc
sd fi=SD.doc me fi=Mean.doc
mo ny=9 ne=3 ly=fu,fr te=sy,fi ps=sy,fr fi ly(1,1) ly(8,1) ly(9,1)
fi ly(1,2) ly(8,2) ly(9,2) fi ly(9,3)
va 1 ly(1,1) ly(8,2) ly(9,3) fi ps(3,1) ps(3,2)
fr te(1,1) te(2,2) te(3,3) te(4,4) fr te(5,5) te(6,6) te(7,7) te(8,8) fi ly(4,2)
va 0 ly(4,2) fr te(4,1) st 1 all
st 500 ps(1,1) ps(2,2)
st 100 te(1,1) te(2,2) te(3,3) te(4,4) st 100 te(5,5) te(6,6) te(7,7) te(8,8) ou ns ad=off it=999 ss WAIS-R Adult da no=275 km sy fi=Cor.doc sd fi=SD.doc me fi=Mean.doc
mo ny=9 ne=3 ly=ps te=ps ps=ps eq ly(1,2,1) ly(2,1)
99 eq ly(1,4,1) ly(4,1) eq ly(1,5,1) ly(5,1) eq ly(1,6,1) ly(6,1) eq ly(1,7,1) ly(7,1) eq ly(1,2,2) ly(2,2) eq ly(1,3,2) ly(3,2) eq ly(1,4,2) ly(4,2) eq ly(1,5,2) ly(5,2) eq ly(1,6,2) ly(6,2) eq ly(1,7,2) ly(7,2)
fi ly(2,3) ly(4,3) ly(5,3) ly(6,3) ly(8,3) va 0 ly(2,3) ly(4,3) ly(5,3) ly(6,3) ly(8,3) fi te(4,1) va 0 te(4,1) ou WAIS-R Middle da no=205 km sy fi=Cor.doc sd fi=SD.doc me fi=Mean.doc mo te=ps fr ly(2,3)
fi ly(1,3) ly(3,3) ly(7,3) va 0 ly(1,3) ly(3,3) ly(7,3) ou WAIS-R Older da no=160 km sy fi=Cor.doc sd fi=SD.doc me fi=Mean.doc mo fi ly(2,3) va 0 ly(2,3) fr ly(6,2) ly(7,1) ou
Appendix 2. Means Model LISREL Syntax.
WAIS-R Young
da no = 300 ni = 9 ma = cm ng = 4 km sy fi = cor.txt
sd fi = sd.txt me fi = Mean.txt
mo ny = 9 ne = 3 ly = fu,fr te = sy, fi ps = sy, fr al = fi ty=fr fi ly(1,1) ly(8,1) ly(9,1)
fi ly(1,2) ly(8,2) ly(9,2) fi ly(9,3)
va 1 ly(1,1) ly(8,2) ly(9,3) fi ps(3,1) ps(3,2)
fr te(1,1) te(2,2) te(3,3) te(4,4) fr te(5,5) te(6,6) te(7,7) te(8,8) fi ly(4,2)
va 0 ly(4,2) fr te(4,1)
Sprague et al.: Invariance testing in intelligence
100 st 1 all
st 500 ps(1,1) ps(2,2)
st 100 te(1,1) te(2,2) te(3,3) te(4,4) st 100 te(5,5) te(6,6) te(7,7) te(8,8)
st 60 ty(1) ty(2) ty(3) ty(4) ty(5) ty(6) ty(7) ty(8) ou ns ad=off it=999 ss rs WAIS-R Adult da no=275 km sy fi=Cor.txt sd fi=SD.txt me fi=Mean.txt
mo ny=9 ne=3 ly=ps te=ps ps=ps al = fr ty=in eq ly(1,2,1) ly(2,1) eq ly(1,3,1) ly(3,1) eq ly(1,4,1) ly(4,1) eq ly(1,5,1) ly(5,1) eq ly(1,6,1) ly(6,1) eq ly(1,7,1) ly(7,1) eq ly(1,2,2) ly(2,2) eq ly(1,3,2) ly(3,2) eq ly(1,4,2) ly(4,2) eq ly(1,5,2) ly(5,2) eq ly(1,6,2) ly(6,2) eq ly(1,7,2) ly(7,2)
fi ly(2,3) ly(4,3) ly(5,3) ly(6,3) ly(8,3) va 0 ly(2,3) ly(4,3) ly(5,3) ly(6,3) ly(8,3) fi te(4,1) va 0 te(4,1) fi al(2) ou WAIS-R Middle da no=205 km sy fi=Cor.txt sd fi=SD.txt me fi=Mean.txt mo te=ps al=ps fr ly(2,3)
fi ly(1,3) ly(3,3) ly(7,3) va 0 ly(1,3) ly(3,3) ly(7,3) fr al(2) ou WAIS-R Older da no=160 km sy fi=Cor.txt sd fi=SD.txt me fi=Mean.txt mo fi ly(2,3) va 0 ly(2,3) fr ly(6,2) ly(7,1) fi al(1) ou