BIOCOVER - REDUCTION OF GREENHOUSE
GAS EMISSIONS FROM LANDFILLS BY USE OF
ENGINEERED BIO-COVERS
A.M. Fredenslund
P. Kjeldsen
C. Scheutz
G. Lemming
Technical University of Denmark
ABSTRACTEmission of methane from landfills due to anaerobic decomposition of organic material is one of the most important environmental concerns with regards to solid waste management. This is due to the amount of methane released from landfills globally and the relatively high global warming potential of methane. An approach to reduce emissions is to improve conditions for biological oxidation of methane in the top cover using engineered biocovers.
A demonstration project was initiated at the Technical University of Denmark under the EU Life Environment program, where this technology is applied in full scale at section I on Fakse landfill in Denmark. Construction of the full scale biocover at the test site was completed at time of writing.
The main project objective was to document the construction and efficiency of the system. The project actions consist of a logical order of tasks performed in able to meet the objectives of the project. At first the landfill was characterized. Expected landfill gas production was estimated based upon the collected data using models. Then, a baseline study was performed, consisting of an evaluation of the spatial variability in methane emission at the site. The total methane emission from the landfill was measured by use of a tracer technique.
Mixtures of locally available soils and organic waste residuals were tested by laboratory batch and column experiments. A cover improvement plan included details on material additions to selected areas of the landfill, maintenance plans of the total landfill cover. A plan for monitoring performance was setup. The emissions after the cover improvement will be compared to the emissions obtained during the baseline study. Scenarios for other landfills will be calculated based on the experiences obtained from the studied landfill.
KEYWORDS
Landfill gas; Greenhouse gas; Methane; Biological methane oxidation; Demonstration project; Mitigation technology.
I INTRODUCTION
Most landfills contain organic wastes which produce biogas, containing methane (55-60 vol.%) and carbon dioxide (40-45 vol.%). Methane from landfills still accounts for between 7 5 1
and 20% of the global anthropogenic sources of methane emissions and thereby significantly contributes to global climate change. Landfill gas (LFG) is at some landfills extracted and utilized for energy purposes leading to methane emission reduction. However, it is not always feasible to extract and utilize the gas. In these cases the gas is flared with risk of producing toxic combustion products, or is just escaping the landfill to the atmosphere.
An alternative with even lower costs could be to improve and maintain the cover of the landfill in order to optimize the biological methane oxidation. Laboratory experiments have documented that a very high methane oxidation rate can be obtained in bio-covers, high enough to significantly reduce the methane emission from the landfill. The biological methane oxidation transforms methane into carbon dioxide, and since methane has a 20 times stronger global warming potential than carbon dioxide, a significant reduction in the source to global warming is obtained. Bio-covers may also be a very cost-effective supplementary method at landfills with landfill gas utilization. However, the documentation of the efficiency of bio-covers as a methane emission reduction approach is more challenging in comparison to a utilization system.
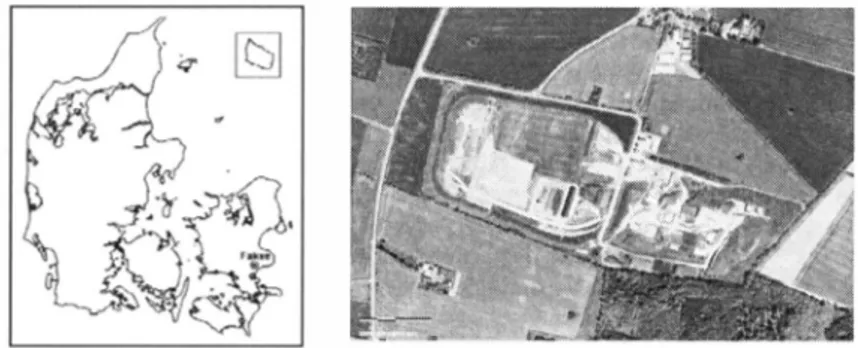
This new suggested innovative technology is to be demonstrated at Fakse Landfill, Denmark (see Figure I). The landfill is divided in two parts; section I which was in use from 1 98 1 until I 996 will be the focus of the project activities. This part of the landfill has an area of I 3 ha and received mixed waste. Section I contains 700,000 tons of waste. The oldest part is finally covered with a relatively thick layer of soil having low gas permeability, while the rest of the landfill is temporary cover with a thinner layer of the same soil type.
The idea of the project is to construct a biocover system by establishing permeable regions, so-called windows, containing locally available materials with proven high methane oxidation potential.
Figure I. a) Map of Denmark showing the location of Fakse landfill. b) Arial photo of Fakse landfill showing the both section I (right) and section II (left).
2 STATE OF THE ART
Estimations of the methane production at Danish landfills without LFG utilization were carried out in 1 998 [8]. Based on the original data the potential methane surface emissions
1
have been calculated for 2004. Typical potential methane surface emissions are in the order of 1
2-20 g CHa4 m·2d· with most emissions in the 2- 1 0 range. For a new landfill with a thickness of 15 meter receiving municipal solid waste a typical methane surface emission is 30 g CH4 m·2d- .The attenuation of methane in landfill top covers by methane oxidation has been subject to several studies [ I ], [4], [5], [9], [ I I ]. The top covers often consist of a lower anaerobic zone where pore gas consists mainly of LFG, and an upper methanotrophic zone characterized by a pore gas mixture of LFG and atmospheric air diffusing into the top cover from the atmosphere. Studies of landfill covers through simulating column experiments have
1
obtained methane oxidation capacities in the order of I 00-250 g CH4 m·2d· . Thus, the oxidation capacity determined is much higher that the observed potential methane emissions for landfills as mentioned above. This indicates that biological methane oxidation in landfill soil covers indeed is a possible technology, which especially for landfills with medium to low methane production may be a very cost-effective solution to reduction of green house gas em1ss1ons.
Attempts to enhance the attenuation process have worked with addition of organic material (compost, sludge etc.) to the soil. It proves that manipulation of landfill cover soils to maximize their methane oxidation potential might provide a complementary strategy for controlling emissions. However, at present, landfill caps are not designed with methane oxidation in mind. At many landfills the quality of the cover is in many cases not perfect, and can be of a very heterogeneous nature, and in many cases consisting of clay soils with low gas permeabilities. In such cases, regions with much higher gas permeabilities may exist. Besides, cracks may form during dry periods, or by settlement or erosion, and methane venting through such regions will not reside in the cover long enough to be oxidized. In these cases a significant attenuation benefit could be achieved with relatively simple design and/or manipulation of the top-soil cover followed up by continuous monitoring of the cover. For example, attenuation can be considerably improved thanks to better soil porosity allowing better through-flow of methane and oxygen and selection of materials with significant methane oxidation potential.
The stimulating effects of biocovers on methane oxidation in the field have been studied [6]. They have measured the methane emission from Austrian landfill test cells covered with sewage sludge compost or municipal solid waste compost during a three-year period. For both type of biocovers the results indicated a significant removal of methane. No methane emission could be detected at the surface during the whole measuring period. The research, however, did not include quantitative measurements of LFG fluxes through the cover before and after cover improvement, so it is difficult to estimate a methane oxidation rate from the results. This high performance was obtained when a layer of coarse gravel was installed beneath the compost layer. This layer facilitated a homogeneous gas distribution. The Austrian experiment which was performed in a temperate climate is the only field scale documentation of methane oxidation stimulation in landfill soil covers.
Mixtures of materials (including organic waste materials, coarse sandy and gravel type soils, and landfill soil containing the methanothrophic bacteria) in the soil covers probably 53
constitute the most efficient biocovers for methane oxidation. Studies to optimize the methane oxidation performance by mixing different materials have only been carried out in a few cases and have never been followed up by full scale implementation at landfills.
Documentation of the efficiency of improved covers at landfills for mitigation greenhouse gas emission is not a fully developed methodology. A documentation procedure includes measurements of the whole landfilal emission of methane before and after the cover has been improved for better mitigating the methane emissions. Several methods exist for whole landfill emission measurement, incaluding mass balance modeling, flux chamber techniques. micrometeorological techniques, and tracer techniques [3]. The tracer technique as developed by the Chalmer group [3] seems to be the most reliable method for landfills.
Policy development is needed to secure a sustainable and cost effective management of landfill gas at landfills also incorporating low technology solutions based on natural methane emission reduction by biocovers. To obtain a reliable technology the reduction in methane emission from the landfill by installing a biocover system a guideline needs to be developed. The guideline should describe the full procedure of establishing a biocover system on a landfills and methods for documenting the efficiency of the installed biocover system for mitigating the methane emission from the landfill.
3 PROJECT OVERVIEW
The full title of the BIOCOVER project is "Reduction of Greenhouse Gas Emissions from Landfills by use of Engineered Bio-covers'·. The project is funded by the LIFE I l l ENVIRONMENT program, the Danish Environmental Protection Agency, and RENOSAM and runs from August 2005 to November 2008. The project is divided into a logical order of activities. The project activities are as follows:
• Initial characterization of landfill. The landfill is characterized according to area. volume, waste characterization, soil thicknesses and types, and vegetation. Expected landfill gas production is estimated based upon the collected data using available landfil l gas generation models.
• Baseline study of methane emissions. On each of the landfills an initial evaluation of the spatial variability in methane emission is carried out, and the total methane emission is measured by use of the tracer technique.
• Testing improvement strategies in the laboratory. Mixtures of locally available soils and organic waste residuals are tested in the laboratory to determine the best suited material mixture to be used for cover improvement.
• Improvement of cover layer. On the basis of the baseline study which showed the spatial variability of the gas emission, and the tests on the improvement strategies, a cover improvement plan is developed. The plan will include details on material additions to selected areas of the landfill and maintenance plans of the total landfill cover. The covers are improved following the proposed plans.
• Establishing full scale demonstration biocover system. After the cover has been improved a monitoring plan is setup including the activities as described under
--Baseline study of methane emissions ... The spatial variability and the whole landfill emissions will be evaluated, and the emissions after the cover improvement will be compared to the emissions obtained during the baseline study. Evaluation of the oxidation efficiency at selected localities within the landfills will be made using the probe/flux chamber approach.
• Analysis of the economic viability of the biocover technology. The standard cost for
this reduction technology (in DKK/tons CO2 GWP removed) will be calculated and
compared to other reduction technologies, especially the gas flaring technology. Scenarios for other landfills will be calculated based on the experiences obtained from the two studied landfills.
4 LANDFILL CHARACTERIZATION 4.1 Basic site characteristics
Fakse Landfill is situated in Fakse Municipality in South-eastern Zealand, Denmark. The site consists of two sections. Section I is the oldest part of the landfill and is the main focus of this study. Disposal of waste in Section I was initiated in I 98 I and continued until I 997. After this period. Section II, the new part of Fakse Landfill was brought into operation and waste disposal has mainly taken place in this part since I 998. Section I I is expected to be an active disposal site until approximately 2040.
Section I covers an area of approximately I 3 hectares, and has a total capacity of 760,000 ml
of which 660,000 ml have been utilized for waste disposal. 1 40.000 tons of waste is deposited
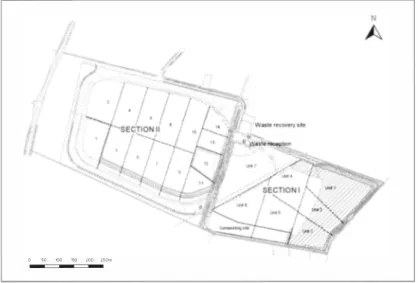
in the western part of Section I I . Most of this section is either unused, or used for composting garden waste or temporary storage of combustible waste intended for waste incineration. A site plan of Fakse Landfill is presented in Figure 2.
0 50 100 150 200 250m
Figure 2. Site plan of Fakse landfill.
A natural layer of clay ( 1 5-20 meters in extent) functioning as a bottom liner is present beneath the landfill. The natural liner has locally been supplemented by compacted clay. A draining layer on top of the liner consists of 0.3 meters of gravel overlying the bottom liner. Leachate drainage pipes are placed in filter elements ( coarse gravel) placed in trenches. The drainage pipes are made of PVC or PEH with diameters ranging from 95- 1 30 mm and are placed 1 5-20 m apart. I n each of the disposal units the drainage pipes are connected to an inspection well placed at the top of the unit and a collection well placed in the lowest point of the unit. From each collection well, leachate is led to a pumping station from where it is pumped to a municipal waste water treatment plant.
Sampling and analysis of cover soil from the capped and uncapped parts of Section I respectively showed that the finalized part (Units I - 3) is covered by a clayey soil and classified as sandy clay loam. The soil cover in the temporarily covered part (Units 4 - 7) varies from sandy clay loam to a more porous sandy loam, with a high content of wood and plant material. The thickness of the temporary soil cover was evaluated to vary from 0.8 to
1 . 1 meter based on hand drillings and previous soil profiles from the site [7]. There is no LFG extraction system installed at Fakse landfill.
4.2 Waste data
A total of approximately 600,000 tonnes of waste have been disposed of at Section I in the period 1 98 1 -2005. The dominating waste types deposited in section I are: soil fill (26%). household refuse (23%) and mixed waste (2 1 %) (see Figure 3)
As bestos 2%
Soil fill and oil 23%
contamainated soil 26% Comabustibles 4% Non-combustibles 1 2% 1 2% Mixed waste 2 1 %
Figure 3. Waste types deposited at Section I at Fakse landfill.
The disposal units in Section I have been filled one or two at a time. In all subunits, co disposal of all received waste types has been carried out. No special cells for specific waste
fractions exist in Section I. However, in the period 1 986- I 996, all asbestos waste has been disposed of at Unit 2.
4.3 Gas production modeling
Four available gas production models were applied for estimating the production of Landfill gas at Fakse Landfill. These were:
• LandGEM version 3.02 by US EPA
• GasSim version 1 .52 by UK Environment Agency and Golder Associates • Multi Phase Model by the Dutch waste management company Afvalzorg (AMPM) • IPCC First Order Decay method by the Intergovernmental Panel on Climate Change Table I summarizes input and output of the models, model type etc. All models describe the waste degradation using 1ast order kinetics and required waste input data on an annual basis. However, the models are different in relation to detail of the waste input data, methodology for evaluating the biodegradable content of waste and for simulating biodegradation. Whereas the LandGEM model calculates the gas production based on a theoretical methane yield per tonne of total landfilled waste, the three remaining models base the gas generation on the content of biodegradable material in the waste. With the I PCC model all degradable waste is assumed to degrade at the same rate (single phase model). GasSim and Afvalzorg Multi Phase Model operate with three grades of degradability of the organic waste (multi phase models). The multi phase models allows for a differentiation into fractions of slow, moderate and fast degradables.
�---=:�"''•�a�--�
�---Table I. Short presentation of the 4 applied gas production models [7].
LandGEM GasSim Afvalzorg lPCC First Order
(Version 3.02) (Version 1 .52) Multi Phase model Decay method
Provider US EPA UK EA Afvalzorg l PCC
Model type I . order generation I . order decay of I . order decay of I . order decay of of CH4 biodegradable biodegradable biodegradable
organic carbon organic material organic carbon (Multi phase) (Multi phase) (Multi phase) Input Annual waste Annual waste Annual waste Annual waste
amounts amounts amounts amounts
Waste Waste types Waste composition composition/types
Output LFG production LFG production LFG production CH4 production (m3/yr) (m3/yr) (m3/yr) (Gg/year)
Intended use U.S. landfills Screening tool for Dutch landfills IPCC Tier 2
receiving MSW evaluation of guideline for
landfill gas estimation of CH4 emission and emissions from
exposure solid waste
disposal sites
Spreadsheet/
✓
✓
✓
software (Spreadsheet) (Software) (Spreadsheet)
400 350 ---... ? 300 ---.'-�-"c--- ---C 250 ____,________________
g
200 ----·�···•�,,..,___--..____________ _·· ..
,,
a.··•..
e
1so --��=�--+---:::-=·� ... ·· .. ···.
..
·-...
--�.---.,-,-��-��---� 1 00 ...J ·• ...·• .... ;:: 50 ---..,.>----�·• ... ,.,c,::... ,1, ····• ... '-�-��.?",.._ ::::---==::. � ""5f1f!1»3Npt:usnr p?i3lt 1 970 1 980 1 990 2000 201 0 2020 2030 2040 2050 2060 2070 2080 2090 2 1 00• LandGEM • IPCC • GasSim , AMPM
Figure 4. Total landfill gas production of currently deposited waste material at Fakse landfill estimated using four gas production models [7].
LFG production simulations were performed for both Section I, which is the main focus of the project, and for Section I I . Furthermore, the production of LFG in the capped and uncapped part of Section I has been evaluated separately as has each of the 7 disposal subunits in Section I.
The resulting LFG production for 2005 in Section I of Fakse Landfill was estimated in the 1 range from 0.6 - 1 .3 million m3 LFG/yr 5 corresponding to 555 to I 1 65 kg CH
4 d- (see
Figure 4). Seventy-five percent of this gas production was estimated to take place in the uncapped part of Section I comprised by Units 4-7. The reported range includes model estimates obtained using the models I PCC, GasSim and Multi Phase Model. LandGEM results were assessed to overestimate the gas production at Fakse Landfill, since the model intended for U.S. landfills with a high amount of municipal solid waste.
5 MAPPING SPATIAL VARIABI LITY IN EMISSIONS
5.1 Conceptual model of LFG emission
A conceptual model of LFG emission from Fakse landfill was setup based on initial methane concentration screenings, cover soil characterization and considering the technical design of the landfill. Clayey soil has been used for both temporary and final covering. This leads to low permeability, which in turn leads to gas emitting in more concentrated parts of the landfill, where permeability is higher rather than more uniformly upwards through the top soil over the entire area.
Main pathways of emission were considered to be leachate collection wells, which are part of the leachate drainage system and high emission areas (hot spots) on the soil cover. These areas were believed to be found on slopes and parts of the temporary cover, where the soi l cover i s thin, and thereby more permeable.
5.2 Measurement of methane emission through leachate collection system
To measure methane emission rates from the leachate collection system, a continuous tracer release method was used on desired locations. This was done to evaluate the necessity of
modifying the leachate system to reduce gas emissions through this pathway, which would constitute a bypass of the biocover system.
The principle of the method used was to continuously release a gaseous tracer ( carbon monoxide) at a constant known rate near the source of the methane emission (bottom of leachate wells), and subsequently compare measurements of concentrations of tracer and methane in the plume downwind after background concentrations of tracer and methane have been measured. Concentrations of carbon dioxide were also measured.
The basic equation for calculating emission rates through these measurements of concentration was derived from the assumption that the ratio between flow rates of methane and tracer is equal to the ratio between observed concentrations measured downwind.
( 1 )
Where Qrn4 is the flow rate of methane (I/min), Qco is the flow rate of carbon monoxide tracer, Crn4 is the concentration down wind of methane (ppmv), Ceo is the concentration of carbon monoxide tracer (ppmv).
This relationship assumes perfect mixing of LFG and carbon monoxide tracer, and that background levels of methane and carbon monoxide were negligible. To take background levels into account, an approximate compensation is introduced, so that
* c( .ll .i .r - Cc,14 .halkgrmmd
Qrn, -- Qco (2)
Cro , f - CCO.hac kwo1111d
The tracer release system consisted of a CO-gas bottle fitted with a two stage gas regulator and a simple flow meter. The tracer release rate used was 2. 7 I/min, and carbon monoxide was added through 4 mm internal diameter tubing to the bottom of each leachate well.
Using this method, the rates of methane emitting from all leachate collection and inspections wells were measured once. Measurements were performed under stable weather conditions to avoid, as much as possible, influence on emission rates caused by rise or fall of barometric
1 1
pressure. Emission rates from each of the wells ranging from 1 kg CH4 d- to 76 kg CH4 d' were observed. At two out of 1 6 wells the rates of methane emission were not measurable.
1
The sum of methane emitting through the wells was 35 1 kg CH4 d- , which suggested that as much as 50% of the methane produced in the waste emitted through the leachate collection system, by comparing this rate to the results of the LFG production models [2].
5.3 Measurement of methane emission through hot spots in soil cover
The methane emission through the soil cover at Fakse landfill was considered to occur mostly through so-called hot spots rather than more uniformly through the entire soil cover. Localization of the hot spots and measurement of the methane flux through these were done, to evaluate the need for cover improvement in connection with installation of the biocover. Another objective was to test the presumptions of the conceptual model with regards to the spatial variability of the emission through the soil cover.
To systematically evaluate the spatial variability of the emission. a measurement grid was marked on each of the seven disposal units on the site with grid spacings ranging from 22 to 28 meters. After marking the grid of point locations for measurement, each location was measured for methane concentration just above ground level in four screening campaigns. Concentrations are measured on the grid points and hot spots using a Photovac portable flame
ionization detector (FID) (detection limit: 0.5 ppm CH4) connected via I m tube to a 20cm diameter funnel.
Location of hot spots was done by systematically measuring near surface methane concentrations using the FID and funnel walking slowly along the grid between all grid points in both north-south, and east-west directions. The screening between grid points was supplemented with a screening on slopes and other features were emission through the soil cover was potentially high. On most grid points concentrations were near background level (<2 ppm). On located hot spots, concentrations of several thousand ppm were measured. Hot spots were found almost exclusively on slopes at the site. The observations made during concentration screenings confirmed the conceptual model of methane emission at the site. Through approximately 200 measurements of flux rates primarily at the hot spots, average
1 emission from each of the identified hot spot areas ranged from 5 to 4000 g CH4 111·2 d- , where the highest emissions were measured at the temporarily covered part of the landfill. ln most cases the area of the hot spots were very clearly defined and these were evaluated using the FID and funnel screening near surface concentrations of methane. Emission through identified hot spots covering a combined area equal to 0.4% of the site was measured using a mobile type flux chamber. Measurements of the concentration inside the flux chamber were done using the FID. Time of each flux measurement was approximately five minutes, and the concentrations of methane in the flux chamber were measured 6-7 times during each measurement.
Through the flux measurements, a total emission through identified hot spots was measured to 1
be 1 82 kg CH4 d· , of which 97% emitted through the temporarily covered part of section I .
The sum of the emission measurements o f the local sources (leachate collection system and 1
hot spots in soil cover) was 533 kg CH4 d' .
6 TOTAL METHANE EMISSION M EASUREMENTS
The total methane emission from the disposal site was measured using a tracer technique, combining controlled tracer gas release from gas bottles placed on the landfill with time resolved concentration measurements downwind the landfill using FTIR absorption spectroscopy.
Initially to the tracer release measurement, a general leak search at the landfill was conducted with the main purpose to identify high emission areas for placement of the tracer release bottles. In all two field campaigns were performed; during October 1 1 a-1 2, 2006 and February I 9-20. 2007. At both field campaigns an overall leak search showed that the methane emission from the old landfill section was localized to the leachate collection wells and some slope areas with cohered with previous observations.
During the first campaign the methane emission from section I was estimated to be 1
748.8± 1 63.2 kg CH4 h' • During the second campaign the methane emission from section I 1
was estimated to be 732.0±52.8 kg CH4 h- [ I O].
1
The difference between results measurement of local emissions (533 kg CH4 h" ) and total 1
emission (average: 740.4 kg CH4 h" ) can be explained by more diffuse emission sources not being quantified in the first case. By comparing the values, it was concluded that the most important sources of methane emission were identified while assessing spatial variability in emissions.
7 ONGOING AND FUTURE WORK
At time of writing, construction of a full scale biocover system to reduce methane emission from Fakse landfill was completed. The biocover material chosen was five year old composted garden waste, produced at the site. Based on results from column experiments investigating methane potentials of available biocover materials (not described in this paper). and measured total methane emission, a necessary total area of the biocover windows was set to 5000 m2 . The windows were constructed by removing top soil, placing a 1 0- 1 5 cm gravel layer and placing I meter of composted garden waste over the gravel layer.
After construction of the biocover system, performance will be assessed using whole site methane emission measurement, of which results will be compared to baseline values. Studies on methane oxidation in the biocover windows will also be studies at a more local level. The performance will be studied over a full calendar year, to observe effiaciency under different weather conditions.
Finally, a viability analysis of using biocover technology to reduce greenhouse gas emissions from landfills will be done, involving desk studies on five other European landfills using experiences gained from constructing the system at Fakse landfill.
ACKNOWLEDGEMENTS
This project was funded through the EU Life Environment program. We thank Bente Munk and the staff at Fakse landfill for their cooperation.
REFERENCES
[ I ] De Visscher, A., Thomas, D., Boeckx, P . and Cleemput V . 0., 1 999. Methane Oxidation in Simulated Landfill Cover Soil Environments. Environmental Science and Technology 33, 1 854- 1 859.
[2] Fredenslund, A.M., Kjeldsen, P., Scheutz, C., 2006. Reduction of greenhouse gasses by engineered biocovers: Measurement of Spatial Variability in Emissions. Biocover project report D3.2. l a. Available at: http://www.biocover.er.dtu.dk. Institute of Environment and Resources, Technical University of Denmark, October 2006.
[3] Galle, B., Samuelsson, J., Svensson, B., Borjesson, G., 200 1 . Measurements of CH4 emissions from landfills using a time correlation tracer method based on FT! R absorption spectroscopy. Environmental Science and Technology 35 ( I ). 2 1 -25.
[4] Gebert, J., Grongroft, A .. 2006. Performance of a passively vented field-scale biofilter for the methane oxidation of landfill methane. Waste Management, 26(4), 399-407. [5] H ilger, H .A., Cranford, D.F., Barlaz, M .A., 2000b. Methane oxidation and microbial
exopolymer production in landfill cover soil. Soil Biology and Biochemistry 32, 457-467.
(6] Humer. M. and Lechner, P. Methane oxidation in optimized landfill cover layers under different seasonal conditions. Paper presented at Lulea 2000, Intercontinental Landfill Research Symposium, 1 1 - 1 3 December 2000, Lulea University of Technology, Lulea, Sweden.
[7] Lemming. G., Kjeldsen, P. 2006. Reduction of greenhouse gasses by engineered biocovers: Initial Characterization of Fakse Landfill. Biocover project report D.2.4. 1 . Available at: http://www.biocover.er.dtu.dk. Institute of Environment and Resources, Technical University of Denmark, April 2006.
(8] LFG Consult ( 1 998): Fremme af lossepladsudnyttelse i Danmark. Energistyrelsen, K0benhavn, Danmark. ( in Danish)
[9] Scheutz, C., Mosbrek, H. and Kjeldsen, P., 2004. Attenuation of Methane and Volatile Organic Compounds in Landfill Soil Covers. Journal of Environmental Quality, 33, 6 1 -7 1 .
( 1 0] Scheutz, C.. Fredenslund, A.M, Samuelsson, J . , Jacobs, J., Scharff, H . , Hensen, A., Kjeldsen. P .. 2007. Whole landfill methane emission. Biocover project report D 3.2. 1 b. Available at: http://www.biocover.er.dtu.dk. Institute of Environment and Resources, Technical University of Denmark, April 2007.
( 1 1 ] Whalen, S.C., Reeburgh, W.S., Sandbeck, K.A., 1 990. Rapid methane oxidation in a landfill cover soil. Applied and Environmental Microbiology 56, 3405-34 1 1 .

![Figure 4. Total landfill gas production of currently deposited waste material at Fakse landfill estimated using four gas production models [7]](https://thumb-eu.123doks.com/thumbv2/5dokorg/3689164.45874/8.643.108.597.140.568/landfill-production-currently-deposited-material-landfill-estimated-production.webp)
