This is the published version of a paper published in US-China Education Review.
Citation for the original published paper (version of record): Fredriksson, U., Taube, K., Eklund, M. (2009)
Reading and education for students of immigrant origin in some Swedish municipalities. US-China Education Review, 6(11): 17-33
Access to the published version may require subscription. N.B. When citing this work, cite the original published paper.
Permanent link to this version:
Reading and education for students of immigrant origin
in some Swedish municipalities
Ulf Fredriksson1, Monica Eklund2, Karin Taube3
(1. Department of Education, Mid Sweden University, Härnösand SE-871 88, Sweden; 2. School of Teacher Education, Halmstad University, Halmstad SE-301 18, Sweden;
3. Department of Teacher Education in Swedish and Social Sciences, Umeå University, Umeå SE-901 87, Sweden)
Abstract: Researchers from Mid Sweden University and Kalmar University organised surveys on reading
skills in Swedish municipalities. This paper will focus on the surveys made in four municipalities between 2002 and 2007. All students in grade 8 in these four municipalities participated in the surveys—in total 16,287 students. These surveys included a reading test for the students and information about the students collected from the teachers, including participation in instruction in Swedish as a second language and in their mother tongues. Students of immigrant origin in Sweden are offered the possibility to participate in instruction in Swedish as a second language and in instruction in the student’s mother tongue. No obvious trends over time in the participation in Swedish as a second language and mother tongue instruction were found in the four municipalities on the tests we gave, in spite of national trends. There was no difference in results on the reading tests in Swedish between those students who participated in mother tongue instruction and those who did not, but there was a difference in test results between those who participated in Swedish as a second language and those who did not. Those who did not participate (in Swedish as a second language instruction) did, on average, score higher on the test. When different language groups are compared, it can be noted that a majority in all groups of immigrant students neither participate in Swedish as a second language nor in mother tongue instruction. However, there are important differences between boys and girls and between language groups. Girls seemed to be more willing than boys to participate in voluntary mother tongue instruction, while boys more often than girls had to participate in compulsory lessons in Swedish as a second language.
Key words: reading; students of immigrant origin; Sweden
1. Introduction
Since the end of the World War II, international migrations have grown in volume and changed character (Castles & Miller, 1993). This trend has affected Sweden in a similar way with most other Western European societies (Allwood & Franzén, 2000). Since 1930, about 2.4 million people have immigrated to Sweden and during the same period, 1.4 million people have emigrated (Hedberg & Malmberg, 2008, s. 16).
Ulf Fredriksson, Ph.D., senior lecturer, Department of Education, Mid Sweden University; research fields: reading, reading among students of immigrant origin, learning to learn, comparative education.
Monica Eklund, Ph.D., senior lecturer, School of Teacher Education, Halmstad University; research fields: intercultural teaching and learning, reading comprehension and democratic schools.
Karin Taube, Ph.D., professor, Department of Teacher Education in Swedish and Social Sciences, Umeå University; research fields: reading comprehension, international comparative studies, dyslexia.
Immigration has confronted the education system in Sweden, as elsewhere, with new challenges (Churchill, 1986). The Swedish Education Act stipulates that, “all children and young people must have access to education of equal quality, irrespective of gender, their geographical place of residence and their social and financial situations” (Government of Sweden, 2008). This directive includes students of immigrant origin, but how to do this has been a topic for controversy. A variety of measures have been taken by people in the Swedish education system over the years to meet the needs of immigrant students. These measures have followed two main paths: to help students improve their Swedish language knowledge, and to help them maintain and develop their mother tongue.
Since 1966, various measures have been taken to provide education in Swedish for students with a mother tongue other than Swedish. During the 1970s, this education was generally referred to as “Swedish as a foreign language”. In the mid 1980s, the term “Swedish as a second language” was introduced and today the term is officially used to describe such education (Viberg, 1996). According to the syllabus of Swedish as a second language, the objective of instruction is to give students the knowledge in Swedish that they need in order to benefit from instruction in other subjects, to take part in social life with other students and, in a wider perspective, to take part in life in society. The student should be able to master the Swedish language at a level comparable to that of native speakers (Skolverket, 2000: National Agency of Education, in Swedish). Swedish as a second language is compulsory for those students who need this instruction and who have a mother tongue other than Swedish, who have received their previous education in schools outside Sweden and who are of immigrant origin. It is up to each head teacher to determine if and when such a need exists (Comprehensive School Decree, 2001, Chap. 2, para. 15). There are many different models for the organisation of Swedish as a second language in schools (Bergman & Forshage, 2000; Myndigheten för skolutveckling, 2004: Swedish National Agency for School Improvement, in Swedish). Most students follow the major part of the lessons in an ordinary Swedish class but leave the class for Swedish as a second language instruction. The number of hours per week in Swedish as a second language varies depending on the needs of the students.
The way in which decisions about the organisation of Swedish as a second language have been taken has been criticised. It has been argued that the decision-makers do not have sufficient knowledge about the nature of this subject and the need for qualified teachers (Hyltenstam, 1993; Myndigheten för skolutveckling, 2004).
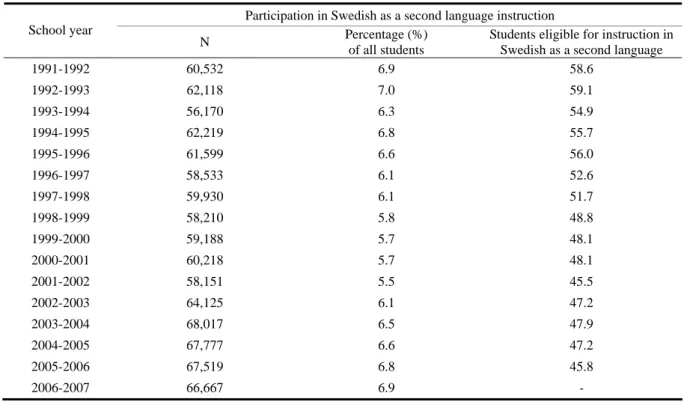
Table 1 shows the number of students participating in Swedish as a second language instruction, the number of students as a percentage of all students and the number of these students as a percentage of all students eligible for instruction in Swedish as a second language.
The percentage of all students eligible for participating in instruction in Swedish as a second language who actually participated in this type of instruction varied from almost 59 percent to 45 percent. There was a gradual decrease between 1991 and 2007, where the highest proportion of students participating in Swedish as a second language instruction can be found in school year 1992-1993 and the lowest proportion in school year 2005-2006. The development after 2001-2002 seems to have been less variable than the development between 1991-1992 and 2001-2002.
Concerning the students’ skills, it has been shown in several studies (Fredriksson, 2002; Skolverket, 2003) that students of immigrant origin on average do not reach the same level as Swedish students when for example reading skills in Swedish are compared.
Table 1 Participation in Swedish as a second language instruction in Sweden 1991-2007
Participation in Swedish as a second language instruction School year
N Percentage (%)
of all students
Students eligible for instruction in Swedish as a second language
1991-1992 60,532 6.9 58.6 1992-1993 62,118 7.0 59.1 1993-1994 56,170 6.3 54.9 1994-1995 62,219 6.8 55.7 1995-1996 61,599 6.6 56.0 1996-1997 58,533 6.1 52.6 1997-1998 59,930 6.1 51.7 1998-1999 58,210 5.8 48.8 1999-2000 59,188 5.7 48.1 2000-2001 60,218 5.7 48.1 2001-2002 58,151 5.5 45.5 2002-2003 64,125 6.1 47.2 2003-2004 68,017 6.5 47.9 2004-2005 67,777 6.6 47.2 2005-2006 67,519 6.8 45.8 2006-2007 66,667 6.9 -
Source: Skolverket (2008a).
The other main path used for supporting students of immigrant origin, mother tongue instruction, was introduced later. This form of instruction has also been more controversial as witnessed in educational and political debates. The legal right of immigrant students to receive some instruction in their mother tongue was first introduced in 1977 and was initially referred to as “home language” instruction (Hyltenstam & Tuomela, 1996). The criteria used to decide who has the right to such instruction have changed over the years. In 1996, the subject title was also changed from “home language” to “mother tongue” instruction, often with reference to a specific language such as “instruction in Spanish as mother tongue” (Government bill, 1996-1997, p. 110). According to present regulations, the students who have the right to receive some instruction in their mother tongue should meet the following criteria:
(1) have one or two parents (or legal guardians) who have a language other than Swedish as their mother tongue and who use this language as a daily means of communication at home;
(2) speak Sami, Finnish, Meänkieli (Tornedal-Finnish), Jiddish or Romany, even if they do not use the language as a daily means of communication at home;
(3) have been adopted and who have a mother tongue other than Swedish, even if they do not use the language as a daily means of communication at home.
(Comprehensive School Decree, 2001, Chap. 2, para. 9)
Students have the right to instruction in their mother tongue for a period not longer than seven years during the nine years of compulsory schooling. It may be possible to extend this period if there are special reasons. Participation in mother tongue instruction is voluntary for those students who meet the criteria referred to above. Parents have to decide if they wish their children to participate or not. It is compulsory for municipalities to provide this instruction, provided they can find qualified teachers, if there are at least five students demanding
instruction in a specific language1 (Comprehensive School Decree, 2001, Chap. 2, paras. 9-13). There is no limit imposed on the number of lessons in the mother tongue that a student can receive. In most cases, schools offer two lessons a week (Tuomela, 2001). In addition to mother tongue instruction, the student has the right to get individual guidance in their mother tongue for other subject areas (Comprehensive School Decree, 2001, Chap. 5, para. 2).
Mother tongue instruction can, according to present regulations, either be chosen as a subject within the schedule of the ordinary school day or offered outside the school day. If the student has mother tongue instruction as a subject within the school day, this instruction must replace instruction in another subject such as a second foreign language. If the student chooses to have this instruction outside the ordinary school day he/she must follow these lessons after normal school hours, and in addition to all the other subjects studied (Comprehensive School Decree, 2001, Chap. 2, paras. 10-12). There is another possibility, however, where, instead of just a few hours of the mother tongue instruction, students are offered bilingual instruction in special bilingual classes. The way in which these classes can be organised differs, but one common characteristic is that a substantial part of all lessons, not just those in the mother tongue instruction, are taught in the mother tongue (Bergman, 1993). According to present regulations, such classes can be organised for students who on a daily basis, speak a language other than Swedish at home with at least one parent. Such classes can only be organised in grade 1 to 6. There is an exception for Finnish-speaking students, who can also receive this type of instruction in grade 7 to 9. On the average, half of the instruction such students receive over the years should be in Swedish with the proportion of lessons held in Swedish gradually increasing over time (Comprehensive School Decree, 2001, Chap. 2, para. 7).
As shown above, the rules deciding which children are entitled to mother tongue instruction has changed over the years. This change has affected the possibilities for students of immigrant origin to participate in mother tongue instruction. A study of students in grade 3 in Stockholm from 1993 to 1999 indicated that the proportion of students of immigrant origin who received mother tongue instruction dropped from 77.6 percent in 1993 to 58.9 percent in 1999 (Fredriksson, 2002).
Table 2 shows the number of all students of immigrant origin who participated in mother tongue instruction in Sweden during the period 1991 to 2007. The concept “eligible” in the table refers to those students of immigrant origin who according to present regulations have the right to receive some instruction in their mother tongue. The last column shows the percentage of those students who participate in mother tongue instruction outside of the normal school day.
As can be seen in the table above, the percentage of eligible students who participate in mother tongue instruction is between 51 and 59 percent. There is a modest decrease from school year 1991-1992 from 59.3 percent to 51.6 percent in school year 2001-2002. From 2001-2002 there was a modest increase up to 55.9 in 2006-2007. It can be noted that the majority of students who participated in mother tongue instruction between 1995-1996 and 2006-2007 received this instruction outside normal school hours. Figures for earlier years are not available in the national statistics.
The National Agency for Education (Skolverket) has in several reports (Skolverket, 2004, 2007) expressed concerns about a decreasing number of students of immigrant origin who participate in mother tongue instruction. Specifically the agency has been concerned about the decrease within pre-school institutions, but has also
1
expressed a concern about a decrease in the comprehensive school system. According to the National Agency for Education (Skolverket, 2007), the resources available for this type of instruction have decreased, the size of the groups in which the students receive the instruction increased and the number of hours of instruction given to the students decreased. The agency noted that students may not get the support they are entitled to and that this affects the objective to provide all students with an education of equal quality. In a recent report about education for students with immigrant background (Skolverket, 2008b) the National Agency of Education showed that those students of immigrant origin who had received mother tongue education had higher average grades than those who had not participated in mother tongue education.
Table 2 Participation in mother tongue instruction in Sweden 1991-2007
Participation in mother tongue instruction School year
Number of students eligible for mother tongue
instruction Percentage (%) of all students Number Percentage (%) of all students Eligible students Participation outside the school day 1991-1992 103,304 11.8 61,289 7.0 59.3 - 1992-1993 105,091 11.8 59,796 6.7 56.9 - 1993-1994 102,284 11.4 58,801 6.6 57.5 - 1994-1995 111,720 12.2 61,306 6.7 54.9 - 1995-1996 109,924 11.7 60,338 6.4 54.9 54.2 1996-1997 111,351 11.6 60,745 6.3 54.6 55.2 1997-1998 115,846 11.8 62,100 6.3 53.6 59.7 1998-1999 119,352 11.8 62,671 6.2 52.5 59.6 1999-2000 123,057 11.9 63,986 6.2 52.0 63.5 2000-2001 125,253 11.9 65,322 6.2 52.2 52.8 2001-2002 127,929 12.1 66,006 6.2 51.6 54.2 2002-2003 135,945 12.9 73,572 7.0 54.1 56.7 2003-2004 141,930 13.6 76,811 7.3 54.1 55.4 2004-2005 143,665 14.0 78,699 7.7 54.8 59.6 2005-2006 147,415 14.8 80,561 8.1 54.6 54.5 2006-2007 148,674 15.4 83,042 8.6 55.9 52.8
Source: Skolverket (2008a).
2. Background
During the school year 1990-1991, a large survey of reading skills among 210,000 children in 32 national education systems was conducted within the project IEA Reading Literacy2 (Elley, 1992). In Sweden 4,429 students in grade 3 and 3,736 students in grade 8 participated (Taube, 1995). IEA Reading Literacy was prepared with most possible care. This careful construction of the test resulted in a reading test that was almost equivalent in all the participating countries.
Starting from 1993 a number of surveys have been organised in Sweden using the tests developed in IEA Reading Literacy to test students’ reading skills. Between 1993 and 1999, a series of surveys on reading skills
2
The International Association for the Evaluation of Educational Achievement (IEA) is an international organisation specialised in coordinating and organising large surveys onstudent skills and knowledge in different subjects such as reading, mathematics, science and civics.
among all students in grade 3 in Stockholm were organised (Taube, 1993, 1994a, 1996; Taube & Skarlind, 1996, 1997a, Taube, Skarlind & Karlsson, 1998a, 1999a) and from 1997 to 2000 all students in grade 8 in Stockholm were tested (Taube & Skarlind, 1997b, 2000; Taube, Skarlind & Karlsson, 1998b, 1999b). At the same time other municipalities showed interest in organising similar surveys. In the municipality of Täby, surveys were organised in grade 3 in 1993 (Taube, 1994b) and in grades 3 and 8 during the years 1998-2000 (Taube & Skarlind, 1998; Taube & Karlsson, 1999a; Taube, 2000a). The surveys in Stockholm and Täby included not only reading tests, but also information about students and teachers collected by means of questionnaires. Surveys were also organised in grade 8 in Kristianstad 2002-2006 (Taube, 2002b, 2003b, 2005b; Fredriksson, Eklund & Taube, 2006) and in Härnösand 2005-2006 (Eklund, Fredriksson & Taube, 2005, 2006; Eklund & Taube, 2006).
Since year 2000, surveys have been organised in a number of municipalities near and around the city of Stockholm. The results of these surveys have been presented in several reports (Fredriksson & Taube, 2005; Taube, 2000b, 2001, 2002a, 2003a, 2004, 2005a; Taube & Karlsson, 1999b). This paper will use data collected during 2002 and 2007 in four municipalities: Nacka, Sollentuna, Tyresö and Upplands-Väsby. All four municipalities are part of the greater Stockholm region. All 16,287 students in grade 8 in the municipalities have participated in the studies. These surveys have included a reading test and information collected from the teachers about students’ age, gender, mother tongue, participation in mother tongue instruction and participation in instruction in Swedish as a second language.
3. Earlier analysis of reading among students with an immigrant background
In all the surveys which have been organised since the IEA Reading Literacy study in 1991, information has been collected that have made it possible to analyse differences in reading skills between students of immigrant origin and Swedish students. In 1995, the results from the Swedish IEA study were analysed with a focus on reading skills among students with an immigrant background (Taube & Fredriksson, 1995). The data collected in Stockholm 1993-2000 have also been used to analyse reading skills among students with an immigrant background in two reports (Fredriksson & Taube, 2001; Fredriksson, 2002). However, these studies have mainly focused on students in grade 3.
Results from these studies have shown that there are significant differences in results on reading tests between students of immigrant origin and Swedish students. When students of immigrant origin who received instruction in Swedish as a second language have been compared with students of immigrant origin who have not received Swedish as a second language it was found that those who did not received Swedish as a second language instruction had better results on the reading tests. This was interpreted in the reports as a sign that in general the students most in need of this instruction also have received it. In the case of mother tongue instruction no significant differences was found between the students of immigrant origin who received this instruction and those who did not. This finding seems to indicate that there is no reason to believe, as sometimes assumed in the public opinion, that immigrant students who are offered opportunities to learn and develop their mother tongue would be weaker in skill development in the official language of the society in which they live.
4. Differences between Swedish students and students with an immigrant background
In the remaining part of this paper, the results on the reading test of the students of immigrant origin in grade 8 will be analysed. Collected data from the four municipalities will be used to:
(1) Identify trends in the municipalities related to the participation in mother tongue and Swedish as a second language instruction;
(2) Look at differences between those students of immigrant origin who participated and did not participate in these types of instruction.
Our intentions, when trying to identify trends in the municipalities, were to explore whether the percentage of students of immigrant origin participating in mother tongue instruction is increasing or decreasing and whether the percentage of students of immigrant origin participating in Swedish as a second language instruction is increasing or decreasing.
When looking at differences between the students of immigrant origin who participated and who did not participate in these types of instruction, our intentions were to look at whether there were differences in the results on the reading tests between those who had participated in these types of instructions and those who had not. We also wanted to look at different language groups and differences between boys and girls.
5. The surveys in grade 8 in Nacka, Sollentuna, Tyresö and Upplands-Väsby
During the period 2002-2007, Karin Taube was contracted to organise surveys on reading skills in Nacka, Sollentuna, Tyresö and Upplands-Väsby (Fredriksson & Taube, 2005; Taube, 2000b, 2001, 2002a, 2003a, 2004, 2005a).
5.1 Instruments
To collect information about the students, two instruments were used—reading test and student list.
The reading test was composed of 9 texts different in character: 3 narratives, 2 expository texts and 4 documents. Each text was followed by 40 tasks related to the text. The students were given 40 minutes to complete the test. Further information about the reading test can be found in the reports which have been sent to the participating municipalities (Fredriksson & Taube, 2005). The texts and tasks used were used earlier in the IEA Reading Literacy study in 1991.
The student list contained information about the students’ age, gender, reasons for absence at the test (when relevant), participation in mother tongue instruction, participation in Swedish as a second language instruction and participation in remedial instruction. The student lists were completed for each class by the subject teacher in Swedish. More information about the lists can be found in earlier reports (Fredriksson & Taube, 2005).
5.2 Implementation of the surveys
Teachers in the subject Swedish in grade 8 distributed a booklet to the students containing the reading test. The teachers had the responsibility for collecting the booklets and sending them back to the Department of Health and Behavioural Science at the University of Kalmar. The surveys were given to students in March each year between 2002 and 2007.
5.3 Populations
The surveys were compulsory for all schools with students in grade 8 in the participating municipalities. This means that the surveys are surveys of the whole population of grade 8 students in the selected municipalities for that year. Table 3 shows number of students who participated in the surveys in the different municipalities.
The figures in Table 3 refer to all students from which some information is available. However, all students did not participate in the reading test because of sickness or other reasons. On average, about 10 percent of the students in each survey did not do the test. In total, 18,167 students were enrolled in grade 8 in the four
municipalities during the period 2002-2006. Out of this total number, 16,287 students participated in the reading test.
Table 3 Number of students in grade 8 who participated in the reading surveys in the municipalities
Municipalities When the surveys was administered Number of students who participated in the surveys
Nacka Spring semester 2002-2007 6,118
Sollentuna Spring semester 2002-2007 4,546
Tyresö Spring semester 2002-2007 3,222
Upplands-Väsby Spring semester 2002-2007 2,401
Total number of students 16,287
5.4 Students of immigrant origin in Nacka, Sollentuna, Tyresö and Upplands-Väsby
In the earlier reports from the surveys made in Nacka, Sollentuna, Tyresö and Upplands-Väsby (Taube & Karlsson, 1999b; Taube, 2000b, 2001, 2002a, 2002b, 2003a, 2003b, 2004, 2005; Eklund, Fredriksson & Taube, 2005, 2006; Eklund & Taube, 2006), reading skills among the students were discussed more generally and the reports dealt only, to some extent, with students of immigrant origin.
In all the municipalities selected, there were students of immigrant origin. A student was defined as being of immigrant origin when the student met at least one of three criteria: (1) the student had participated in Swedish as a second language instruction; (2) the student had participated in mother tongue instruction; and (3) the teacher had indicated that the student had a mother tongue other than Swedish.
6. Results
6.1 A description of the population
Table 4 shows the number of students of immigrant origin and Swedish students in grade 8 who participated in the survey in the four municipalities during the period 2002-2007. Average reading results of the two groups of students and the standard deviation within the groups are also indicated in the table.
Table 4 Number of students, percentage, average test results and standard deviation, grade 8 students
N % Mean Std. deviation
Students of immigrant origin 2,016 12.4 25.5 7.0
Swedish students 14,241 87.6 30.3 6.0
All students 16,257 100 29.7 6.3
As can be seen in the table, the group of students of immigrant origin corresponds to a bit more than 10 percentage of the total population of students. The Swedish students had an average result on the reading test that was 4.2 points higher than the average result of the students of immigrant origin. The standard deviation within the group of students of immigrant origin is higher than the standard deviation within the group of Swedish students.
6.2 Participation in mother tongue instruction
Table 5 shows the total number of students of immigrant origin in the four municipalities who participated in mother tongue instruction and the number who did not participate. The table also shows the average scores on the reading test of the two groups.
Table 5 Participation in mother tongue instruction: Number of students, percentage and average test results
N % Mean
No participation 1,238 61.4 25.5
Participation 778 38.6 25.5
Total 2,016 100.0 25.5
A majority (61.4 percent) of the students of immigrant origin did not participate in mother tongue instruction. On average, both those who participated and those who did not participate had the same test score on the reading test in Swedish.
Table 6 shows the number of students of immigrant origin who participated in mother tongue instruction and the percentage of all students of immigrant origin who participated in mother tongue instruction in each of the four municipalities.
Table 6 Participation in mother tongue instruction four municipalities: Percentage of all students of immigrant origin who participate
Nacka Sollentuna Tyresö Upplands-Väsby
N % N % N % N % 2002 57 48.7 43 33.6 33 64.7 30 42.3 2003 36 28.3 49 34.3 18 54.5 23 26.4 2004 57 43.8 69 43.1 16 50.0 18 36.7 2005 44 34.6 49 36.0 13 28.9 17 29.8 2006 50 40.3 56 42.1 13 34.2 28 40.6 2007 45 40.5 25 22.9 28 50.0 28 40.6 Average 48 39.4 48 35.3 20 47.0 24 36.1
The percentage of students of immigrant origin who participated in mother tongue instruction seems to have fluctuated between the years. It is impossible to talk about a trend in any direction based on the figures in the table. Tyresö seems to have had a larger proportion of the students of immigrant origin who participated in mother tongue instruction than the other municipalities.
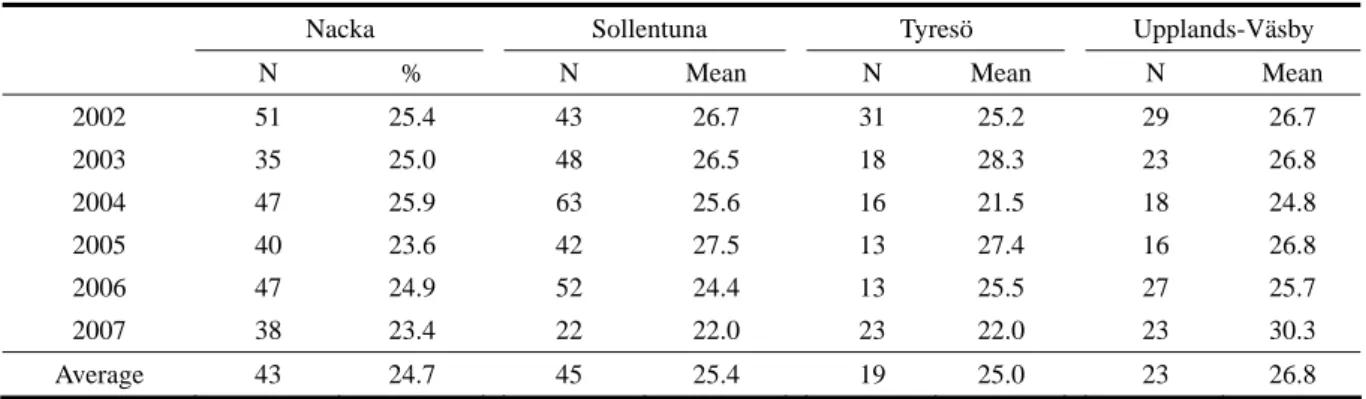
Table 7 shows the number of students who participated in mother tongue instruction in the four municipalities during the year 2002 to 2007 and average test score for each municipality and year.
Table 7 Participation in mother tongue instruction and average scores on reading test four municipalities
Nacka Sollentuna Tyresö Upplands-Väsby
N % N Mean N Mean N Mean
2002 51 25.4 43 26.7 31 25.2 29 26.7 2003 35 25.0 48 26.5 18 28.3 23 26.8 2004 47 25.9 63 25.6 16 21.5 18 24.8 2005 40 23.6 42 27.5 13 27.4 16 26.8 2006 47 24.9 52 24.4 13 25.5 27 25.7 2007 38 23.4 22 22.0 23 22.0 23 30.3 Average 43 24.7 45 25.4 19 25.0 23 26.8
The table shows that the variation of the average scores on the reading test in Swedish was not that large between the years. The average scores for some years in some municipalities stand out as lower than the others
(2007 in Sollentuna and Tyresö) or higher than the others (Upplands-Väsby, 2007), but if these results are not taken into consideration, the variation is very modest. It should be kept in mind that the groups examined were in some cases quite small and that makes the average scores much more dependent on the actual composition of the group from year to year.
6.3 Participation in Swedish as a second language instruction
Table 8 shows the total number of students of immigrant origin in all four municipalities who participated in and who did not participate in instruction in Swedish as a second language. The table also shows the average test scores on the reading test of the two groups.
Table 8 Participation in instruction of Swedish as a second language: Number of students, percentage and average test results
N % Mean
No participation 1,320 65.5 27.3
Participation 696 34.5 22.1
Total 2,016 100.0 25.5
A majority (65.5 percent) of the students of immigrant origin did not participate in instruction in Swedish as a second language. Those who did not participate had, on average, a higher test score on the reading test than those who participated.
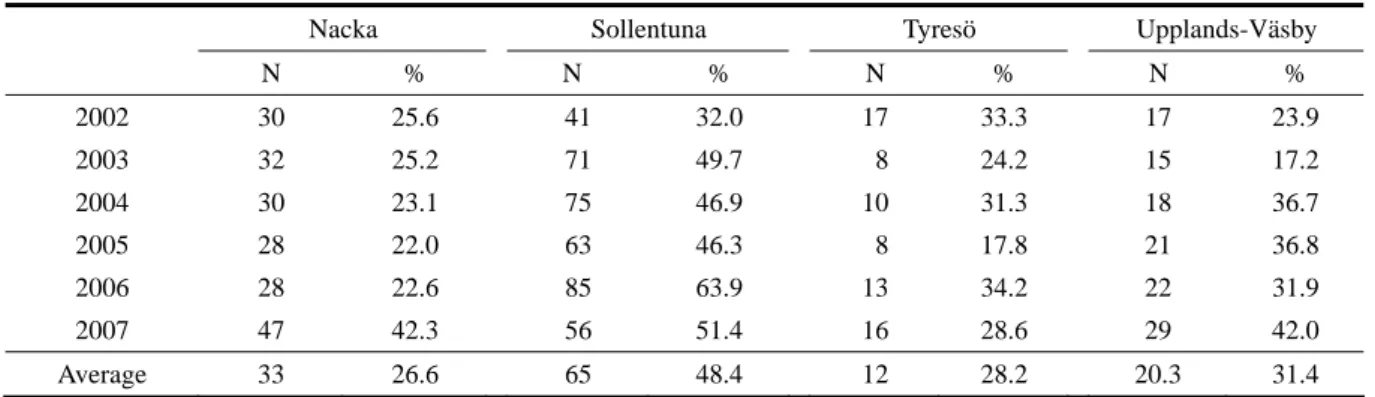
Table 9 shows the number of students of immigrant origin who participated in Swedish as a second language instruction and the percentage of all students of immigrant origin who participated in Swedish as a second language instruction in each of the four municipalities.
Table 9 Participation in Swedish as a second language and percentage of all students of immigrant origin who participate
Nacka Sollentuna Tyresö Upplands-Väsby
N % N % N % N % 2002 30 25.6 41 32.0 17 33.3 17 23.9 2003 32 25.2 71 49.7 8 24.2 15 17.2 2004 30 23.1 75 46.9 10 31.3 18 36.7 2005 28 22.0 63 46.3 8 17.8 21 36.8 2006 28 22.6 85 63.9 13 34.2 22 31.9 2007 47 42.3 56 51.4 16 28.6 29 42.0 Average 33 26.6 65 48.4 12 28.2 20.3 31.4
There was a considerable variation in the percentage of students of immigrant origin who participated in instruction in Swedish as a second language between the municipalities and between different years within the municipalities. The lowest percentage of students who participated is to be found in Tyresö in 2005 and the highest percentage in Sollentuna in 2006. On average, it can be noted that more than a quarter of the students participated in Nacka and Tyresö, about a third in Upplands-Väsby and almost half of the students in Sollentuna. It is diffucult to find any trends in the table. There seems to be a higher percentage of students who participated in the most recent years than in earlier years.
Table 10 shows the number of students who participated in instruction in Swedish as a second language in the four municipalities during the years 2002 to 2007 and average test score for each municipality and year.
Table 10 Participation in Swedish as a second language instruction and average scores on reading test
Nacka Sollentuna Tyresö Upplands-Väsby
N Mean N Mean N Mean N Mean
2002 27 21.3 40 24.7 16 17.1 15 21.9 2003 30 18.4 66 24.6 8 22.3 12 21.7 2004 27 18.7 64 24.2 10 19.9 18 21.3 2005 26 23.3 56 23.9 7 20.6 16 17.8 2006 27 17.9 76 23.6 12 20.3 21 21.2 2007 40 22.3 46 21.7 12 17.3 24 21.6 Average 29 20.3 51 23.8 11 19.6 18 20.9
The tables show no large variation in average scores between the years. It is also difficult to talk about any obvious trends, with the exception of Sollentuna where the average score dropped from a reasonably high score of 24.7 to an average score of 21.7 which is more in line with the average scores in the other municipalities. There are some years when the average scores are considerably lower than during other years, for example 2006 in Nacka, 2002 and 2007 in Tyresö and 2005 in Upplands-Väsby.
6.4 Differences in reading between students of immigrant origin who participated in mother tongue instruction and not participated in mother tongue instruction
As was shown in Table 5 those who participated and those who did not participate in mother tongue instruction had the same average test scores on the reading test in Swedish.
Table 11 shows the number of students who participated and who did not participate in mother tongue instruction and the average reading test scores for the largest language groups in the four municipalities.
Table 11 Results on reading tests for students of immigrant origin from different language groups who participated in mother tongue instruction
Participated in mother tongue instruction Did not participate in mother tongue instruction N % Mean N % Mean Arabic 102 38.2 24.4 165 61.8 24.5 Finnish 43 38.0 29.4 70 62.0 29.0 Kurdish 62 45.6 24.3 74 54.4 24.3 Persian 103 42.9 26.5 137 57.1 26.6 Spanish 126 39.3 25.7 195 60.7 24.5 Turkish 62 47.7 23.8 68 52.3 24.4
All language groups
except Swedish 755 38.2 25.4 1,215 61.8 25.5
In all the largest language groups, the majority of the students did not participate in mother tongue instruction. This majority was largest in the Finnish group with 62 percent and smallest in the Turkish group with 52.3 percent. It can also be noted that the difference in average test scores between those who participated in mother tongue instruction and those who did not is generally quite small.
Table 12 shows the number of boys and girls among the students of immigrant origin who participated in and who did not participate in mother tongue instruction and their average reading test scores.
Table 12 Results on reading tests for boys and girls of immigrant origin who participated in mother tongue instruction
Participated in mother tongue instruction Did not participate in mother tongue instruction
N % Mean N % Mean
Girls 409 42.0 25.4 564 58.0 25.8
Boys 367 35.4 25.6 669 64.6 25.2
Total 776 38.6 25.5 1,233 61.4 25.5
It seems that girls participated in mother tongue instruction to a higher degree than boys. While 35.4 percent of the boys participated the corresponding figure for girls was 42.0 percent. The differences in average scores between those who participate and not participated among the boys and the girls were very small.
6.5 Differences in reading between those students of immigrant origin who participated in instruction in Swedish as a second language and those who did not participate in participate
As can be seen in Table 9 above, those who did not participate in instruction in Swedish as a second language had, on average, higher test scores on the reading test than those who participated.
Table 13 shows the number of students who participated in and who did not participate in instruction in Swedish as a second language and the average reading test scores for the largest language groups in the four municipalities.
Table 13 Results on reading tests for students of immigrant origin from different language groups who participated in instruction of Swedish as a second language
Participated in mother tongue instruction Did not participate in mother tongue instruction N % Mean N % Mean Arabic 114 42.7 22.6 153 57.3 25.8 Finnish 16 14.2 25.7 97 85.8 29.7 Kurdish 56 41.2 20.2 80 58.8 27.2 Persian 76 31.7 23.5 164 68.3 28.0 Spanish 102 31.8 21.9 219 68.2 26.4 Turkish 56 43.1 22.7 74 56.9 25.2
All language groups
except Swedish 675 34.3 22.1 1295 65.7 27.2
The table shows that different language groups did not participate to the same extent in Swedish as a second language instruction. While 42.7 percent of the Arabic speaking students participated in Swedish as second language instruction only 14.2 percent of the Finnish speaking students did. Those who did not participate also have higher average scores on the reading test than those who did participate. When comparisons are made between different language groups, it can be noted that those who did not participate had better results than those who participated. The only exception is that the Turkish speaking students who did not participate had an average test score (25.2) which is slightly lower than the corresponding score for the Finnish students who participated (25.7).
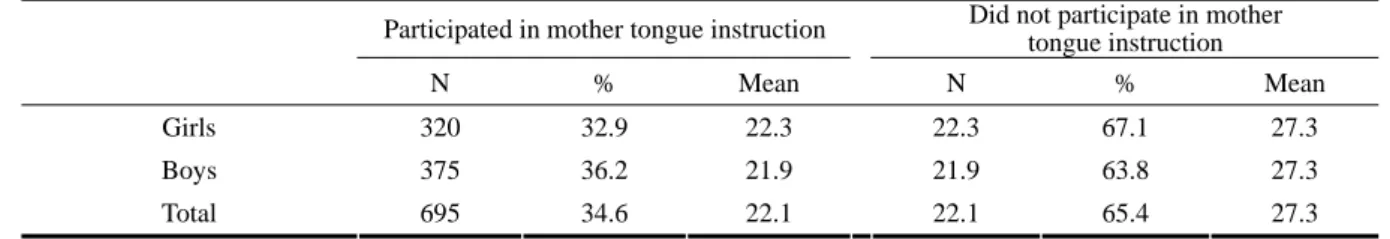
Table 14 shows the number of boys and girls among the students of immigrant origin who participated and who did not participate in instruction in Swedish as a second language and their average reading test scores.
Table 14 Results on reading tests for boys and girls of immigrant origin who participated in instruction of Swedish as a second language
Participated in mother tongue instruction Did not participate in mother tongue instruction
N % Mean N % Mean
Girls 320 32.9 22.3 22.3 67.1 27.3
Boys 375 36.2 21.9 21.9 63.8 27.3
Total 695 34.6 22.1 22.1 65.4 27.3
A slightly larger proportion of the boys participate in Swedish as a second language instruction than of among the girls. While there is a small difference in average scores between boys and girls who had participated there are no differences between those who did not participate.
7. Discussion
The purpose of this study is to examine whether trends could be found in the municipalities on the participation of students of immigrant origin in mother tongue instruction and in instruction in Swedish as a second language. The intention is also to look at differences in reading performance between those students of immigrant origin who participate and not participate in these types of instruction. As noted, such studies had been done earlier with similar data, but these data were based on surveys in grade 3 in Stockholm in the 1990s. The results presented in this article are based on data which were collected in grade 8 in suburban municipalities in the greater Stockholm area in the years 2002 to 2007.
The first question to explore is whether the percentage of students of immigrant origin participating in mother tongue instruction increased or decreased? When national statistics are examined, as in Table 1, one can conclude that there seems to have been a decrease in participation from 1991 to about 2001-2002. This decrease is even more obvious in the figure covering only Stockholm (Fredriksson, 2002). From 2001-2002 there seems to have been a modest increase. In the four examined municipalities, it is more difficult to see any trends. The proportion of students of immigrant origin participating in mother tongue instruction fluctuated between the years.
The second question is whether the percentage of students of immigrant origin participating in instruction of Swedish as a second language increased or decreased? The national statistics indicate that there was a decrease of the proportion of students of immigrant origin who participated in Swedish as a second language instruction between 1991 and 2001. The development after 2001-2002 seems to have been more stable than the development between 1991-1992 and 2001-2002. The figures from the four municipalities do not seem to indicate any trends.
In relation to these questions, it may be of importance, also, to explore whether there has been any trend among students of immigrant origin in respect of participation in remedial instruction. The reason to examine this question is to see whether any trends in the participation in mother tongue instruction and Swedish as a second language instruction would be mirrored in the number of students of immigrant origin who participated in this type of instruction. Although the figures related to participation are not presented in this study, it can be concluded, based on the calculations made, that, in the same way as it was difficult to talk about any trends in the participation in mother tongue and Swedish as a second language instruction, it turned out to be difficult to find any trends in participation in remedial education.
The third question to explore is whether there are differences in the results on the reading tests between those students of immigrant origin who participate and not participate in mother tongue instruction and in instruction of
Swedish as a second language? No difference in average test scores was found between those students of immigrant origin who participated in mother tongue instruction and those who did not participate. This result could be seen as support for those who argue that instruction in the mother tongue does not lead to weaker results in Swedish. Those students who received instruction in Swedish as a second language had on average lower scores on the reading test than those students who had not received such instruction. This result could be seen as an indication that the students most in need of this instruction actually are those who also receive it. Both the findings concerning differences between those who participated and not participated in mother tongue instruction and those who participated and not participated in Swedish as a second language instruction are consistent with findings in other surveys covering grade 3 in Stockholm in the 1990s (Fredriksson, 2002).
The fourth question to explore is whether different language groups are participating to the same extent in mother tongue instruction and in instruction of Swedish as a second language. Many of the language groups are quite small and the analyses have been limited to the six largest language groups which are Arabic, Finnish, Kurdish, Persian, Spanish, and Turkish. A majority of students in these groups do not participate in mother tongue education but the size of this majority varies from 62 percent among the Finnish-speaking students to 52.3 percent among the Turkish-speaking students. Also, in the case of Swedish as a second language instruction, there is a majority in all groups who do not participate. This majority is quite large among the Finnish-speaking students (85.8 percent) and much smaller among the Turkish-speaking students (56.9 percent). It could be assumed that these differences reflect differences between the groups in respect to when the main emigration to Sweden took place. Most Finnish immigrant came much earlier than Turkish immigrants and in Sweden there is also a big Finnish-speaking national minority.
The fifth question to explore is whether there are gender differences related to those students who participate in mother tongue instruction and in instruction of Swedish as a second language and those who do not. A larger proportion of the girls (42 percent) participated in mother tongue instruction than of the boys (35.4 percent) did. In the case of Swedish as a second language instruction it was the other way around—a higher proportion of boys participated (36.2 percent) than girls (32.9 percent). These differences may be related to the pattern often found in surveys that girls are more interested in language and reading than boys are. The participation in mother tongue instruction in school is voluntary while instruction in Swedish as a second language is determined on the basis of the needs of the students.
8. Final remarks
No obvious trends in the participation in Swedish as a second language and mother tongue instruction were found in the four municipalities, in spite of the perception of this trend at a national level. One reason for this may be that the national trends seem to have been more noticeable in the 1990s than in recent years. We did not study conditions in the four municipalities in the 1990s, but it is possible that changes took place during that period and that percentage of students who participate have now become more stable at a lower level other than previously.
To what extent participation in Swedish as second language and mother tongue instruction have an impact on the students’ reading skills is not possible to judge from this study. We can note that, there is no difference in results on the reading tests in Swedish used in this study between those who participated in mother tongue instruction and those who did not. We can also note that, there is a difference in our test results between those who participated in Swedish as a second language and those who did not participate in. In order to be able to draw
more far-reaching conclusions, it would be necessary to follow different groups of students in longitudinal studies. When different language groups are compared, it could be noted that, in spite of the fact that a majority in all groups do not participate in either Swedish as a second language or in mother tongue instruction, there are important differences between the groups. Even if it is sometimes necessary to talk about students of immigrant origin in general terms, it is important to recognize that these students have diverse socio-economic and language backgrounds.
Finally, it is has often been asserted that girls are better than boys, not only in language oriented activities in general, but also in reading (Wagemaker, et al., 1996). This notion was also confirmed in this study but what may be of greater interest is that girls seemed to be more willing than boys to participate in voluntary mother tongue instruction, while boys more often than girls had to participate in compulsory lessons in Swedish as a second language.
References:
Allwood, C. M. & Franzén, E. C. (2000). Cross cultural meetings. Stockholm: Natur och Kultur.
Bergman, P. (1993). To teach in two languages. In: Reports on bilingualism. Stockholm: Stockholms Universitet, Centrum för två språkighetsforskning.
Bergman, P. & Forshage, P. (2000). Organization and content. In: To teach students in Swedish as a second language. Stockholm: Skolverket.
Castles, S. & Miller, M. J. (1993). The age of migration. London: Macmillan
Churchill, S. (1986). The education of linguistic and cultural minorities in the OECD countries. Clevedon: Multilingual Matters Elley, W. B. (1992). How in the world do students read? Hamburg: The International Association for the Evaluation of Educational
Achievement.
Eklund, M., Fredriksson, U. & Taube, K. (2005). Reading skills among students in grade 8, Härnösand Spring 2005. Härnösand: Institutionen för utbildningsvetenskap, Mittuniversitetet.
Eklund, M., Fredriksson, U. & Taube, K. (2006). Reading among students in grade 8, Härnösand Autumn 2006. Härnösand: Institutionen för utbildningsvetenskap, Mittuniversitetet.
Eklund, M. & Taube, K. (2006). Reading skills among students in grade 8, Härnösand Spring 2006. Härnösand: Institutionen för utbildningsvetenskap, Mittuniversitetet.
Fredriksson, U. (2002). Reading skills among students of immigrant origin in Stockholm. Stockholm: Institute of International Education, Stockholm University.
Fredriksson, U., Eklund, M. & Taube, K. (2006). Reading skills among students in grade 8, Autumn 2004 in Kristianstad. Härnösand: Institutionen för utbildningsvetenskap, Mittuniversitetet.
Fredriksson, U. & Taube, K. (2001). Reading skills among students of immigrant origin: A study of reading skills and background
factors among students in Grade 3, 1993-1996 in Stockholm. Stockholm: Stockholm University, Institute of International
Education.
Fredriksson, U. & Taube, K. (2005). Reading among students in grade 8, Spring 2004 in Ekerö, Nacka, Sollentuna and Tyresö. Härnösand: Institutionen för utbildningsvetenskap, Mittuniversitetet.
Government of Sweden. (2008). Retrieved September 8, 2008, from http://www.sweden.gov.se/sb/d/2063/a/21953. Government Bill (Regeringens proposition). (1996/1997). Certain school issues. Stockholm: Utbildningsdepartementet.
Hedberg, C. & Malmberg, B. (2008). The great challenge: International migration in a globalized world. Background report 18 to
the Globalization Council. Stockholm: Globaliseringsråde.
Hyltenstam, K. (1993). The knowledge domain Swedish as a second language. In: E.Cerú. (Ed.). Swedish as a second language:
More about language and learning (Textbook 2). Stockholm: Utbildningsradion/Natur och Kultur.
Hyltenstam, K. & Tuomela, V. (1996). Home language instruction. In: K. Hyltenstam. (Ed.). Obstacles for bilingualism? Migrant and
minority education in Sweden. Lund: Studentlitteratur.
Myndigheten för skolutveckling (National Agency for School Improvement). (2004). Mapping Swedish as a second language (Dnr
2003: 757). Stockholm: Myndigheten för skolutveckling.
Skolverket.
Skolverket (National Agency of Education). (2000). Syllabus for Swedish as a second language. Stockholm: Skolverket.
Skolverket (National Agency of Education). (2003). Reading skills among students with foreign background. Stockholm: Skolverket. Skolverket (National Agency of Education). (2007). National Agency of Education Review 2007: Pre-school, child care, school and
adult education. Stockholm: Skolverket.
Skolverket (National Agency of Education). (2008a). Retrieved September 3, 2008, from http://www.skolverket.se.
Skolverket (National Agency of Education). (2008b). With another mother tongue—Students in compulsory school and the
organisation of teaching and learning. Stockholm: Skolverket
Taube, K. (1993). Reading skills among 5325 nine-year-old students in Stockholm. Stockholm: Lärarhögskolan i Stockholm, Institutionen för språk och litteratur/Stockholms skolor centralförvaltning.
Taube, K. (1994a). Reading skills among 5873 nine-year-old students in Stockholm. Stockholm: Lärarhögskolan i Stockholm, Institutionen för språk och litteratur/Stockholms skolor centralförvaltning.
Taube, K. (1994b). Reading skills among 668 nine-year-old students in Täby. Täby: Täby kommun, Barn- och ungdomsnämnden. Taube, K. (1995). How in the world do Swedish students read? A comparative study of children reading in 31 countries (Skolverkets
rapport nr 78). Stockholm: Skolverket.
Taube, K. (1996). Reading skills among 6305 nine-year-old students in Stockholm. Stockholm: Lärarhögskolan i Stockholm, Institutionen för språk och litteratur/Stockholms skolor centralförvaltning.
Taube, K. (1998). How do nine-year-old who have received reading instruction with the support of different methods for initial reading instruction read? SCIRA Reading, 23(1), 9-14.
Taube, K. (2000a). Reading skills among 897 nine-year-old students and 750 fourteen-year-old students in Täby. Kalmar: Högskolan i Kalmar, institutionen för Hälso- och beteendevetenskap.
Taube, K. (2000b). Reading among students in grade 3 in Ekerö, Nacka, Sollentuna, Upplands-Väsby and Tyresö comprehensive
schools Spring 2000. Kalmar: Högskolan i Kalmar, Institutionen för Hälso- och beteendevetenskap.
Taube, K. (2001). Reading among students in grade 3 in Ekerö, Nacka, Sollentuna, Upplands-Väsby and Tyresö comprehensive
schools Spring 2001. Kalmar: Högskolan i Kalmar, Institutionen för Hälso- och beteendevetenskap.
Taube, K. (2002a). Reading among students in grade 8 in Ekerö, Nacka, Sollentuna, Upplands-Väsby and Tyresö comprehensive
schools Spring 2002. Kalmar: Högskolan i Kalmar.
Taube, K. (2002b). Reading among students in grade 8 in Kristianstad Autumn 2002. Kalmar: Högskolan i Kalmar.
Taube, K. (2003a). Reading among students in grade 8 in Ekerö, Nacka, Sollentuna, Upplands-Väsby and Tyresö comprehensive
schools Spring 2003. Kalmar: Högskolan i Kalmar.
Taube, K. (2003b). Reading among students in Grade 8 in Kristianstad Autumn 2003. Kalmar: Högskolan i Kalmar.
Taube, K. (2004). Reading among students in grade 8 in Ekerö, Nacka, Sollentuna, Upplands-Väsby and Tyresö comprehensive
schools Spring 2004. Kalmar: Högskolan i Kalmar.
Taube, K. (2005a). Reading among students in grade 3 and grade 8 in Ekerö, Nacka, Sollentuna, Upplands-Väsby and Tyresö
Comprehensive Schools Spring 2005. Kalmar: Högskolan i Kalmar.
Taube, K. (2005b). Reading among students in grade 8 in Kristianstad Autumn 2004. Kalmar: Högskolan i Kalmar.
Taube, K. & Fredriksson, U. (1995). How do immigrant students read in Sweden? (Skolverkets rapport, nr. 79). Stockholm: Skolverket.
Taube, K. & Karlsson, E. (1999a). Reading skills among 815 nine-year-old students and 668 fourteen-year-old students in Täby,
Spring 1999. Täby: Täby kommun, Barn- och grundskolenämnden.
Taube, K. & Karlsson, E. (1999b). Reading among students in grade 3 and grade 8 in Ekerö, Nacka, Sollentuna, Upplands-Väsby
and Tyresö Comprehensive Schools Spring 1999. Kalmar: Högskolan i Kalmar, institutionen för pedagogik och metodik.
Taube, K. & Skarlind, A. (1996). Reading skills among 6112 nine-year-old students in Stockholm. Kalmar: Högskolan i Kalmar/ Stockholms skolor centralförvaltning.
Taube, K. & Skarlind, A. (1997a). Reading skills among 6420 nine year old students in Stockholm. Kalmar: Högskolan i Kalmar/ Stockholms skolor centralförvaltning.
Taube, K. & Skarlind, A. (1997b). Reading skills among 4734 fourteen-year-old students in Stockholm. Kalmar: Högskolan i Kalmar / Stockholms skolor centralförvaltning.