J
Ö N K Ö P I N GI
N T E R N A T I O N A LB
U S I N E S SS
C H O O L JÖNKÖPING UNIVERSITYLinkages between Universities and patent applications
-An empirical study conducted on patent application data.
Master thesis in economics
Authors: Erik Elgquist
Tutor: Lars Petterson
Master Thesis in Economics
Title: Linkages between Universities and patent applications. -An empirical study conducted on patent application data. Authors: Erik Elgquist
Supervisor: Lars Petterson Deputy supervisor: Olof Ejermo Date: February 2005
Subject terms: Universities, Human capital, Patent applications,
____________________________________________________________________
Abstract
Numbers of persons with a higher education have inclined fast during the last dec-ades, as the University sector in Sweden has increased. This due to that the Swedish government has had a very encouraging attitude towards the Universities position for economic regional growth. The aim of this thesis is to see if there are any relation-ships between students at a University in a region and the number of patents that have been applied for in the same region using data taken from European patent of-fice and Statistics Sweden. Patent is one way to measure innovations, and knowledge is one of the core foundations for new innovations. Different models have been used to determine if any significant relationship between patent applications and number of people with higher education is present. The empirical findings came up with the results that numbers of people with higher education have positive relationship with University regions. The two variables, people with higher technical education and re-search and development at Universities also showed positive significant results, which gives support for the chosen theories in the thesis. It is hard to say that the decen-tralization of the Swedish universities have been a total success, because in the thesis results were found which shoed that the Malmö region was outstanding in terms of patent applications. In this region many different Universities and private R&D de-partments are located, together with students etc. Further research in this field has to be conducted to be able to give the policy maker better foundation for decisions.
Magister uppsats inom Nationalekonomi
Titel Linkages between Universities and patent applications. -An empirical study conducted on patent application data. Författare: Erik Elgquist
Handledare: Lars Petterson Vice handledare: Olof Ejermo Datum: Februari 2005
Nyckelord: Unversitet, Human kapital, Patent ansökningar
____________________________________________________________________
Sammanfattning
Antal personer med högre utbildning har ökat i Sverige under de senaste decennierna, då antalet Universitet har ökat. Detta har skett då staten har haft en väldigt positiv inställning till Universitetens roll för regional tillväxt. Uppsatsen undersöker genom att använda statistik tagen från European Patent Office och från Statiska Centralby-rån om det finns något samband mellan sökta patent och antal personer med högre utbildning. Patent är ett av få sätt att mäta innovationskraften i en region. Olika mo-deller valdes att estimeras för att kontrollera om samband fanns mellan dessa variab-ler. Resultaten på dessa regressioner påvisade att personer med högre utbildning fak-tiskt har ett signifikant samband med antalet patent i landet. Variablerna, antalet per-soner med högre teknisk utbildning samt forskning och utveckling vid Universiteten visade också positiva signifikanta resultat. Detta bekräftar då att valda teorier i upp-satsen var korrekta. Det är däremot svårt att säga att decentralisering av de svenska Universiteten har varit alltigenom positiv. Detta då det i uppsatsen visades sig att Malmö regionen var mycket bättre på att ansöka om patent än övriga Sverige. Där finns det en kraftig centralisering av Universitetsforskning, studenter, forskning för flera privata företag m.m. Fortsatt forskning kommer att krävas inom detta område för att kunna ge beslutsfattarna bättre underlag för policy beslut.
Table of contents
1 Introduction
11.1 Background 1
1.2 Earlier research 1
1.3 Methodology 2
1.4 Outline of the thesis 3
2
Definition
of
patent
3
3 Regional
development
and the Universities
44
Theory
54.1 The augmented human capital model 6
4.2 Market potential 7
4.3 Agglomeration economics 7
4.4 Spatial product life cycle 8
5 Empirical results and analysis
95.1 Empirical results 9
5.2 Regression models 13
5.3 Critique of the results 16
6 Conclusion
171 Introduction
The aim of this thesis is to analyze the relationship between number of people with higher education in a University region and the number of patents that has been applied for in the same region.
A University is one of the largest providers of R&D in a region. Local firms can in turn often benefit from the spillover from the University (Andersson, 1998). This in turn can provide growth to a region, as the local firms now can focus their spending to other ar-eas (advertising, staff, etc.). Advantages will be gained over other competing firms. Re-gions with many hi-tech firms and a large share of labor with higher education tend to have higher growth, as the students transfers their knowledge into firms (Sörlin, 1996, Florax, 1996). During the last decades, interaction between Universities, innovations and firms have been more reliant on each other.
The adjust in this relationship will be the starting point for the hypothesis in the thesis and is stated as follows, University regions with high shares of people with higher edu-cation will show significant differences in terms of patent appliedu-cations than other Uni-versity regions with a lower share of students. The interpretation for this standpoint is that knowledge is one of the main foundations for new innovations and patent applica-tion is one method to measure innovaapplica-tions. It is imperative, when reading this paper to have in mind that not all patent applications will be granted, and not all patents will be-come profitable. Applying for a patent is very costly and only for innovations where profits exceed costs; small firms will apply for patents. This has also a negative effect on the total number of applied patents. Also, patent is not the only method to measure innovations.
The analyzed regions in the thesis are so called functional regions (FR) and are defined by NUTEK. Sweden has 82 different functional regions and in the thesis I have chosen to use only the 61 regions that applied for a patent in 1999.
1.1 Background
During the last thirty years, an expansion and decentralization of the Swedish Universi-ties have taken place. The numbers of University students have increased by 77 percent-ages during the last two decades, and the increase in University researchers have in-creased with 150 percentages during the years 1980-2000 (Andersson, Wilhelmsson, 2004). Due to the encouraging political climate, 30 new Universities have also been es-tablished, which have made it possible for new categories of students to come forward. Swedish Universities have today a total budget around 20 billion SEK per year. In many cities, the local University is the distinct leading employer. More than 50,000 persons are working at the different Universities in Sweden serving more than 400,000 students today (www.scb.se).
1.2
Earlier research
In the field of Universities and their impact on regional growth lot of research has been conducted. Both Swedish and International researchers have been investigating how Universities affect regions in different ways. The results in these investigations are not unified, as some of them show very optimistic results and some investigations are more skeptical.
International research
In the Netherlands an investigation was conducted (Florax, 1996). One of the results in the paper was that the presence of a University is not any important reason for location decisions of firms. An additional result in the thesis was that the presence of a Univer-sity generates new jobs to the region (Florax, 1992). Similar results have been seen in other international studies. Dell and Rainnie (1996) found when studying a local Uni-versity in UK, that the UniUni-versity had a positive effect on the local employment. These two studies have been using the multiplier effect from the allocation of University. Varga (1998) came up with the result that if a region had a “critical mass” (35 000 stu-dents and 1 million inhabitants), then a positive development in number of patents and R&D could be seen.
Swedish research
While focusing on Swedish research some interesting results have been found. Holm and Wiberg (1995) came up with the result that Umeå University was a significant rea-son for both the region’s development and for the local labor market. One more positive research, saying that the decentralization of the Swedish Universities was doing well was according to Andersson and Wilhelmsson
(2004).
They found that both old and new University regions had positive effects on the development for those regions. In old University regions productivity was better than productivity in newer University re-gions. Nevertheless, in newer University regions had the productivity increased due to the raised educational and employee level. These results that the productivity had en-hanced in affected regions were completely opposed to other Swedish research. Sörlin and Törnqvist (2000) came up with results that only for the minority of regions; any positive effects could be seen. If metropolitan areas were excluded, no significant corre-lation between Universities and start-up of new firms could be seen. This result was also found by Wikhall (2001). She came up with the result that is it hard to argue that firms locate in regions, due to the occurrence of Universities. Another positive study was per-formed by Jonsson, Persson and Silbersky (2000). The result in their study was that Universities pull new firms into the region, as these firms are attracted by the prospect to employ newly graduated students. This result was also found earlier, in an empirical study performed by (Andersen et al., 1993). They found that firms locate close to the Universities in Luleå and Uleåborg, as these Universities educate numerous of engi-neers.Summarized, a very broad variety of conclusions have been drawn depending on which way the problem was approached in terms of methods, calculations, theory etc.
There-fore is the purpose of the thesis to come up with a new angle of approach and hopefully put some new light on this interesting topic.
1.3 Methodology
Regions defined in this thesis, are so-called functional regions (FR) and have high lev-els of spatial interactions between actors in the regions (Johansson, 1993). Data used in the thesis will be taken from the European patent office (EPO), as it is possible applying for a Swedish patent through EPO as well as through Statistics Sweden (SCB). It should also be mentioned here that EPO patents are more costly to apply for than national pat-ents. EPO approves a patent for those countries the person/firm has appointed the patent to be within. Therefore will not all patent applications that was applied for in Sweden during 19991, be analyzed in this thesis, as for example patent applications conducted by small firms or persons with less money or less ambitious will not apply for an EPO patent. When leaving out patent applied to SCB, only applications with high value for the applicants will be investigated. These applications more often originate from ideas with higher budget and are conducted more thoroughly.
1.4 Outline of the thesis
The outline of the thesis is the following. Chapter two is focusing on patent and why it is used. Chapter three brings up how Universities affects regions and how they contrib-ute to regional growth. In chapter four the theoretical framework in this thesis is pre-sented. Different theories explaining regional change and growth are discussed. Chapter five includes three parts, presentation of the data, analysis of the data and finally a part discussing the problems with the results. The final chapter summarizes what have been written earlier and also a conclusion will be drawn followed by some suggestions for additional research.
2 Definition of patent
A patent can be granted if three different conditions are full-filled. An invention must be something original. A patent can not be given for knowledge already well-known, even if it is the inventor self that has shared the knowledge. The other condition for a patent to be granted is that the invention itself must not be known somewhere else in the world. The third condition is that the invention must be replicable. (www.expowera.com)
The use of having a patent is to protect innovations. When having a patent, the holder of the patent is the single person/firm that is allowed to use the innovation. Would some-one else use the innovation protected by a patent a prosecution could be charged. A pat-ent is valid in those countries the patpat-ent is applied in. The commercial benefit of having a patent is the most important reason to apply for a patent. The exclusive right and the
opportunity to get back invested money (with interest) is what drive people to apply for patents. The person/firm inventing the innovation must not self commercialese the in-vention, but can instead sell the patent to someone else. Another way is to allow others to buy a license so that they can produce the innovation. The patent can also open doors to profitable cooperation with other firms (www.expowera.com ).
Patent data is one of the methods describing the innovation climate in a region. Recent investigations have proven that patents are decent measurement for innovations (Acs, Anselin and Varga, 2002).The problems with patent data as measurement of invention are often that they are biased. Only for regions where a profit could be gained a patent is asked for and due to that many inventions are not recorded. Some patens are just for de-fensive purposes hindering competitors intruding in fields of research and development. A number of firms (often large) apply for more patent than other. Some firms will not ask for patents as the initial costs for competitors will be too high and will not be able to threaten the firm anyway. In other fields of technology is the product life cycle for the commodities to hasty and a patent will already be outdated when it is granted (Ejermo, 2004).
The regional differences in registered patents are great and Stockholm followed by Gothenburg are the two leading regions in terms of registered patents. The ICT-sector has made the number of registered patents enhance even more in these two regions, due to their large number of ICT-specialized firms as in Kista. Ericsson and ABB are the two companies with the largest number of firm-registered patents in Sweden (Anders-son, Wilhelms(Anders-son, 2004).
When comparing number of registered patents, also structural differences have been found. On one side, there are regions dominated by one or few firms and on the other side there are regions with a diversified assembly of firms. Previous research shows that larger regions have more new granted patents than smaller regions. Regions with more than 100 000 inhabitants and a University have in general higher number of newly granted patents than smaller regions without Universities, but not all regions fall into this category (Andersson, Wilhelmsson, 2004).
3 Regional development and the Universities
Knowledge can be said to have public good characteristics, since its exhibits the fea-tures of non-excludability 2and non-rivalry3 (Ejermo, 2004). Universities and knowl-edge have a strong relationship, as Universities are one of the central providers of higher education in Sweden. As the Swedish government has authority over the Swed-ish Universities, they can control which types of education that the SwedSwed-ish Universities should focus on. The government has this power to force the Universities to focus on higher education that maybe will not give the University or the region surrounding the University any advantages, but is important for the society as whole. Therefore some regions analyzed in this thesis will show some poorer result than they possibly could have done, as these regions maybe not provide knowledge in fields of strong technical progress and will therefore not produce many new patent applications (social sciences). Universities can be formed from many organizational units that often have very differ-ent agendas (Pappas, 1997). These institutions provide regions with highly educated human capital, but affect the region also in other ways. Students and staff living in a gion consume both goods and services, which provide growth to the region. The re-searches at the Universities are also very important for the regions, because University research is one of the contributors to new knowledge (Pappas, 1997).
Universities have presently an important role for the growth of regions. Universities in-teracting with local firms are important for regional growth (Sörlin, 1996). The supply of high educated labor is regarded as the single most vital factor of production and also a major reason for firms to locate in a region (Cederlund 1999, Sörlin 1996). New and small firms are attracted by the opportunities that Universities can bring to them. Also, R&D departments of large companies are attracted to regions to employ graduated stu-dents (Cederlund, 1999).
The expansion and decentralization of the Universities have taken place for two reasons. Firstly, and also the most important for this thesis is the economical cause. The gov-ernment has during the last decades tried to raise the competitiveness for small and de-centralized regions, because Universities works as attractors for firms and labor (Ceder-lund, 1999). Establishments of a University also have a positive effect for the employ-ment in a region. Firms require well-educated employees, as these institutions can pro-vide to them. Firms are also attracted by the R&D that Universities can grant them. An-other reason why Universities provide growth to regions, is that cluster of specialized firms often are formed near the Universities.
Regions can take advantage of this relationship. Regions having a large share of well-educated labor and high localization of hi- tech firms will heave the population size of the region, as they attract more firms and labor to the region. These new inhabitants will provide increase to the region. The social part is the second reason for this expansion and decentralization of the Universities. It is easier these days for people to start study-ing at Universities when they don’t have to move as far from home as before. In addi-tion, children to parents with no higher education will now have an incentive to start
2 Not possible to exclude other from using the knowledge. 3 The knowledge can be used by many actors.
studying. People nowadays are more familiar with what a University can offer in form of education etc. In research it has been established that localization of a University has positive effects on the productivity in terms of GRP4. The effects on productivity are higher close to the University and dampen further away from the University (Anders-son, Quigley, Wilhelmsson 2002). Larger amount of researchers at Universities have improved effects on GRP than larger number of students (Andersson, Wilhelmsson 2004). Their result will also be shown to be vital for my conclusions in chapter 6.
All summarized, Universities can for example contribute to following activities: • New product development, industry formation and job creation.
• Assessment of market needs and opportunities.
• Development of social networks and human capital resources. • Encouragement of a culture of change, innovation and trust. (Florax, 1996)
A real world example is IBM that has a close relationship with the local University where headquarter is sited, and have advantages of all of these above mentioned ac-tivities to ensure continues change and growth. This in turn leads to continues growth for the region (Pappas, 1997).
4 Theory
The theory part will include some important models explaining the role of R&D, human capital and market potential in a theoretical way. The models used in the thesis are linked to each other. The human capital model opening the chapter discusses the role of human capital for economic growth. The three other theories in chapter four, explains different types of technical progresses driving the economy forward in form of new Universities, new firms, etc. All models presented in this part of the thesis will also be linked to the results in the conclusion.
4.1 The augmented human capital model
The human capital model is an extension of the Solow growth model5. The extension is performed through the division of the total capital stock into human capital and physical capital. The model is built up in such a way that it allows empirical estimations of the relevance of human capital for economic growth (Romer, 2001)
The model assumes a Cobb-Douglas production and this makes the model tractable and brings about quantitative analysis. It also takes the world’s technological progress as exogenous, due to the reason that the model not is trying to explain the world income. Moreover, once the economy has reached steady state, no more growth in the economy will be present when technological changes are missing. Due to that savings rate and
4 Gross Regional Product (Which is the regional correspondence to the gross domestic product)
5 The Solow model is a neoclassical growth model, which focus on capital accumulation and its links
location of resources to human capital are not treated endogenously. Further, human capital is rival and excludable and the amount of human capital each worker acquires depends solitary upon the numbers of years each worker has been engaged in education (Romer, 2001).
The human capital model builds upon an aggregate production function with constant return to scale. The model looks as follows:
Y(t) = K(t)α H(t) β A(t)L(t) 1- α- β (4.1)
The variables are income (Y), physical capital (K), effectiveness of labor (A), human capital (H) and labor (L). The parameter α signifies the share of income obtained from physical capital and the parameter β represents the share of income obtained from hu-man capital. The assumption within the model is that α + β < 1, which implies that de-creasing return to all capital within the model, prevails (Romer, 2001).
Human capital production function.
The assumptions in the human capital production function are that human capital is only created through education and that the only source for how much human capital a per-son has is through how many years the perper-son has been studying (E). The Human capi-tal production function looks as follows.
H(t) = L(t)G(E) (4.2)
L is here also total number of labor and G is a function of human capital per worker and education per worker and G(E) = e фE, where ф6 > 0 (Romer, 2001).
4.2 Market potential
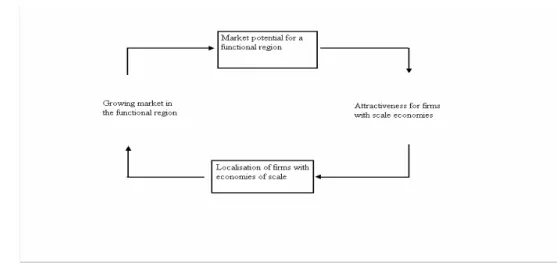
When focus is set on the potential that a University can bring to region an illustration with figure 4.1 can be used. Market potential works as an attractor for firms with scale economies, which do generate growth for the market.
Figure 4.1 The market potential model (Johansson and Karlsson, 2001)
The demand in a region can self- reinforce and constraint the circular dynamics in the region. Increased accessibility in form of production capacity, supply of labor and transportation can increase the cumulative process. High technology firms locate close to knowledge centers as Universities due to the fact that Universities produce skilled and diversified labor. Entrepreneurs are also more common in regions with Universities. Another reason for high technology firms to locate in innovative regions is because of the spillover effects. Technological spillovers7 are important for firms that perform re-search and development. Normally larger regions do offer this type of innovative cen-ters, and therefore have better potential attracting firms. Large firms with a high share of research and development are seeking regions that can offer this type of “services” to them (Johansson & Karlsson 2001).
4.3 Agglomeration economics
Agglomeration economies were first presented by Marshall (1920) and describe loca-tion-specific economies. They should be viewed as external economies and are depend-ent on other firms in the same region. In other words, this cluster phenomenon implies that firms benefit from increasing returns to scale by just being near each other. Mar-shall defines three motives why firms benefit from being in a cluster and these are; local skilled-labor pool, information spillovers, and non-traded local inputs. By the first Mar-shall means that when firms in an industry are concentrated in the same place, a pooled market for labor with specialized skills will be constructed. The firms will gain from this since both the retraining costs and the search costs will be lower within the cluster relative to the firms outside the cluster. Information spillovers allow mutual trading of information within the cluster and thereby allow each firm to receive a better picture of the comprehensive market environment and thus make them more competitive in the market. The last motive makes the cost of non-traded goods to fall within the cluster as the numbers of new firms enter the cluster (McCann, 2001). This results in a more effi-cient industry (Krugman, 1991).
The three sources of agglomeration economies given above may create economies of scale that are external to a firm but internal to the whole cluster. The most important source of agglomeration economies is spatial clustering since it shrinks the cost of in-formation transactions (McCann, 2001). It is not only firms that generate knowledge spillovers; Universities will also spill over and thereby benefit the firms (Olsson and Wiberg, 2003). Thus, Universities are often referred to as being generators since they tend to contribute to regional growth (Guldbrandsen, 1995).
Knowledge is important since it explains economic growth. The reason is given by that knowledge creates innovation which leads to the effect that the society uses its re-sources more effectively (Guldbrandsen, 1995). The production of knowledge has changed during the last decades. Technological innovations are fundamental, describing economic development. Changes in the technological process are crucial for regional development. Innovation, which is the most important element of technological change, depends on the development of knowledge (Fischer and Fröhlich, 2001). The interaction between academic, scientific and technical fields is referred to the expression
edge networks. New knowledge is produced through scientific papers and books. More-over, research is in general a footloose industry, but it does matter where the location of knowledge production is, since all locations are not suitable (Batten, Bertuglia, Martel-lato, and Occelli, 2000). One can say that practically all innovation consist of already existing knowledge, but combined in a new way (Fischer and Fröhlich, 2001).
Agglomeration economies are divided into three different types and they are; localiza-tion economies, internal returns to scale, and urbanizalocaliza-tion economies. Localizalocaliza-tion economies are referred to the expression cluster. Marshall’s three sources of agglomera-tion can all be applied to localizaagglomera-tion economies and are therefore added to a particular industrial sector. Internal economies of scale are not of the same mind as Marshall de-scribed, since they are looked upon as being internal to a firm and not external as Mar-shall argued. Since internal economies of scale are assumed to that a great share of in-vestment occur in a certain location, the scale economies here are clearly spatial. There-fore, these internal economies of scale are associated with a spatial concentration of people and investment. Urbanization economies are related to firms that are in different sectors but still practice economies of scale. Moreover, urbanization economies are also referred to as city-specific economies of agglomeration (McCann, 2001).
4.4 Spatial Product Life cycle
The product cycle can clarify regional economic growth and location behavior. The product cycle involves three stages. First stage is the introduction stage. In the introduc-tion stage the product is innovated and manufactured. In general the introducintroduc-tion stage takes place in a FUR, (Functional Urban Region) with high production costs, but access to R&D inputs and high skilled labor. From figure 4.2 the introduction stage is named as the “head start gains” stage. Head start gains can be for example in the form of a product patent, or other producers in the market do not know that technology (Karlsson and Larsson, 1989).
Second stage of the cycle is the growth stage. At the growth stage the product takes market shares both domestic and international. (The profit made here should cover the initial cost) The technology and production methods become standardized. Other pro-ducers will have the opportunity to compete. Low cost of labor, land and transportation cost becomes more important in the production. Competition on characteristics of the product is shifting towards a competition on price. As a result, larger volumes are pro-duced and other locations that offer production at a lower cost is to prefer. These loca-tions will normally be found in less expensive peripheral regions (Karlsson, Larsson, 1989).
Figure 4.2 The spatial product life cycle (Karlsson, Larsson, 1989)
Third stage is the standardization stage. This stage is when the production gets standard-ized and production is often moved to another location. This is also a stage when it is needed to work on the future for the product, and by that putting a less focus on price and more on the product itself (Karlsson, Larsson, 1989).
5 Empirical results and analysis
The figures used in this thesis are taken from Statistics Sweden (SCB) and European patent office (EPO) .The chapter will start with a table, which sum up the 17 largest8 functional regions that will be analyzed in the thesis. A diagram will then be presented analyzing the data in table 5.1 in a more furrow way. Further, regression analyses will be conducted, which hopefully will show that regions with high share of students apply for more patents than regions with lower share of students. Then comparisons between the two different empirical approaches are conducted and the end result will be dis-cussed. In this thesis the regions are divided into 81 different regions, following the classification conducted by NUTEK9.
5.1 Empirical results
Table 5.1 is ranked by number of people with a higher education in 1990. The intention of the table is to give the reader an overview of the selected functional regions10.
8 In terms of patents in 1990.
9 The Swedish Business Development Agency
10 I have only selected FR’s having a University, therefore aren’t Gnosjö (35 patent applications),
Nor-rköping (27 patent applications), Falun (24 patent applications), Sundsvall (23 patent applications), Skellefteå (23 patent applications), Eskilstuna (16 patent applications) and Karlskrona (15 patent
appli-Product competi- Price
competi-Time Market share
Head start gains
Market saturation
ber of peoples with a higher education data is from 1990 and patent data is taken from 1999.The reason for this difference in time between the two selected years is that it takes some time from research to application.
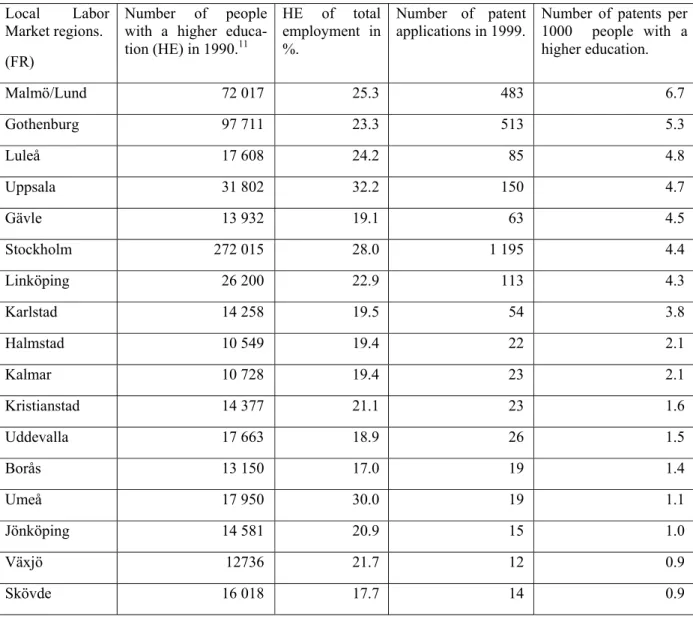
Table 5.1 The 17 largest University functional regions in Sweden. Ranked by number
of people with a higher education in 1990. Local Labor
Market regions. (FR)
Number of people with a higher educa-tion (HE) in 1990.11 HE of total employment in %. Number of patent applications in 1999.
Number of patents per 1000 people with a higher education. Malmö/Lund 72 017 25.3 483 6.7 Gothenburg 97 711 23.3 513 5.3 Luleå 17 608 24.2 85 4.8 Uppsala 31 802 32.2 150 4.7 Gävle 13 932 19.1 63 4.5 Stockholm 272 015 28.0 1 195 4.4 Linköping 26 200 22.9 113 4.3 Karlstad 14 258 19.5 54 3.8 Halmstad 10 549 19.4 22 2.1 Kalmar 10 728 19.4 23 2.1 Kristianstad 14 377 21.1 23 1.6 Uddevalla 17 663 18.9 26 1.5 Borås 13 150 17.0 19 1.4 Umeå 17 950 30.0 19 1.1 Jönköping 14 581 20.9 15 1.0 Växjö 12736 21.7 12 0.9 Skövde 16 018 17.7 14 0.9
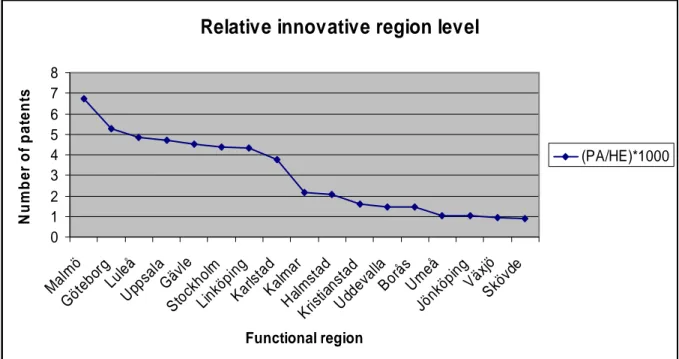
In figure 5.1 a calculation have been performed. Numbers of patents applications (PA) in a region have been divided with number of people with higher education (HE) in that region and then have the results been multiplied with 1000. The results in figure 5.1 shows with other words how many patent applications 1000 people with higher educa-tion in each region result in. Malmö/Lund has almost 7 patent applicaeduca-tions per 1000 persons with higher education. Then cities as Stockholm, Gothenburg, Luleå, Karlstad,
Uppsala and Gävle produced 4-5 patent applications per 1000 people with higher educa-tion.
It is a decrease down to 2 patent applications per 1000 people with higher education in cities as Kalmar, Uddevalla and Kristianstad. The cities with least patent application per 1000 persons were Jönköping, Skövde and Umeå. They produced only 1 patent per 1000 people with higher education.
Figure 5.1 Number of patents applications (PA) in a region divided with number of
people with higher education (HE) in that region, the result has been multiplied with 1000
Relative innovative region level
0 1 2 3 4 5 6 7 8 Malm ö Göt ebo rg Luleå Upps ala Gävl e Sto ckh olm Link öping Karls tad Kal mar Hal mst ad Kris tians tad Uddev alla BoråsUm eå Jönk öpingVäx jö Sköv de Functional region N u mb e r o f pa te nt s (PA/HE)*1000
When analyzing table 5.1 and figure 5.1 it is clearly shown that regions where large firms are located more patents are applied for than in regions where smaller firms are located. This can be explained by the fact that larger firms apply for more patents than smaller firms and these firms’ research and development are located in larger regions as Stockholm (as mentioned in chapter 2), Malmö/Lund and Gothenburg.
As it can be seen in table 5.1 there are three times higher education in Stockholm than the second largest functional region (Gothenburg). This relationship may depend on that Stockholm has the twice population compared to Gothenburg. Also most of the gov-ernmental administration, main offices of banks and larger firms are located in Stock-holm, as Stockholm is the capital of Sweden. Malmö, Uppsala and Linköping comes on the third, fourth and fifth place, which indicates that size of a region is an important fac-tor for how many number of persons having a higher education in a region. The func-tional regions that have many persons with a higher education are regions that posses large Universities. As most of the analyzed cities have much the same amount of people with higher education, then if my hypothesis would be right, they would produce a simi-lar amount of patent applications. Figure 5.1 shows that it could be something wrong with the hypothesis. If the hypothesis would be right, then Umeå would produce more
almost 3 times more than Umeå. What instead can be found by investigating diagram 5.1 and table 5.1 is that functional regions in large extend with larger and more well-known Universities (Karlstad, Luleå etc) have larger share of the patent applications then functional regions with the same amount of people with higher education, but smaller and less well-known Universities.
Summarized three levels of regional differences in patent applications and can be found by analyzing table 5.1. The first level is the region Malmö/Lund with almost 7 patent applications per 1000 persons with higher education and is the leading region in Swe-den. The reasons for the dominance are many, but major private R&D departments (As-traZeneca etc.) and the Universities are two very framstånde reasons. The second level is the regions from Göteborg to Karlstad. These regions produced around 4-5 patent ap-plications per 1000 persons with higher education. What these regions have in common is that they also are large University regions. The last level is the regions from Kalmar to Skövde. These regions have newer Universities or regions where fewer large firms are located.
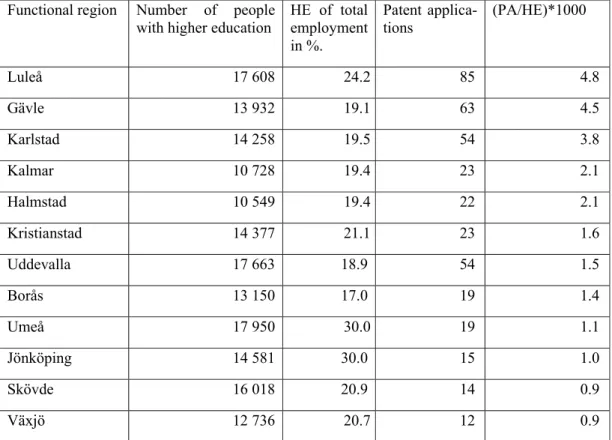
Table 5.2 The 12 of 17 selected functional regions with less then 20 000 persons with
higher education.
Functional region Number of people with higher education
HE of total employment in %. Patent applica-tions (PA/HE)*1000 Luleå 17 608 24.2 85 4.8 Gävle 13 932 19.1 63 4.5 Karlstad 14 258 19.5 54 3.8 Kalmar 10 728 19.4 23 2.1 Halmstad 10 549 19.4 22 2.1 Kristianstad 14 377 21.1 23 1.6 Uddevalla 17 663 18.9 54 1.5 Borås 13 150 17.0 19 1.4 Umeå 17 950 30.0 19 1.1 Jönköping 14 581 30.0 15 1.0 Skövde 16 018 20.9 14 0.9 Växjö 12 736 20.7 12 0.9
This trend can also be seen in figure 5.2. All regions with more than 20 000 persons with higher education have been excluded. In top are some of the largest Universities in Sweden and they are also top Universities in Europe (In terms of published papers, number of researchers etc
5.2 Regression models
To analyze the results more comprehensively, some models have been estimated. For these models, different variables will be analyzed to see if they have any relationship with patent applications. These variables are wage level (wage), employment (EMP), University research and development (R&D(u)), firm research and development (R&D(f), number of people with higher education (HE), University dummy (D1) and University establishment dummy (D2) (See Table 5.3). In the regression models all re-gions having applied for a patent application in 1999 will be analyzed, to be able to de-termine which variables those are important for patent applications.
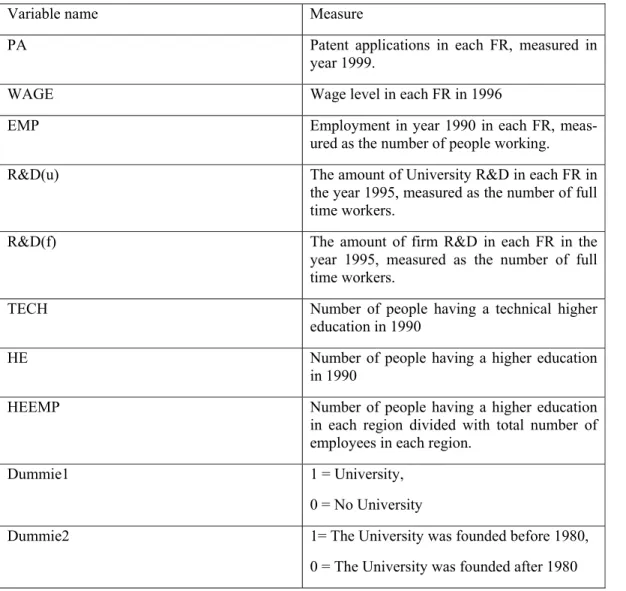
Table 5.3 Presentation of statistical variables.
Variable name Measure
PA Patent applications in each FR, measured in
year 1999.
WAGE Wage level in each FR in 1996
EMP Employment in year 1990 in each FR,
meas-ured as the number of people working.
R&D(u) The amount of University R&D in each FR in
the year 1995, measured as the number of full time workers.
R&D(f) The amount of firm R&D in each FR in the
year 1995, measured as the number of full time workers.
TECH Number of people having a technical higher
education in 1990
HE Number of people having a higher education
in 1990
HEEMP Number of people having a higher education
in each region divided with total number of employees in each region.
Dummie1 1 = University,
0 = No University
Dummie2 1= The University was founded before 1980,
0 = The University was founded after 1980
Patent applications data was taken from European Patent Office. GRP, EMP, R&D(u) and HE were taken from Statistics Sweden The year chosen for each variable is taken from the first year absolutely data was available. The variables in the thesis will try to reflect the theories in chapter four. As patent applications are dependent on several dif-ferent aspects a completely model will be hard to estimate. The models analyzed will
model be included in the regression models in form of the variables TECH, HE, HEEMP and EMP.
A correlation matrix using Spearman’s rho statistics was conducted to see if any multi-colliniarity were present between the variables (See appendix 1). The Spearman’s test showed that multicolliniarity, actually was present. The problem with multicolliniarity is that it affects12 R² and adjusted R². Therefore a number of models have to be con-ducted to be able to draw any conclusions.
The first estimated model in this thesis looks as follows.
PAi = β0 + β1HE + β2Emp + β3R&D(u) + β4R&D(f) + β5WAGE + β6TECH + β7D1
+ β8D2 +ε
(Equation 6.1)
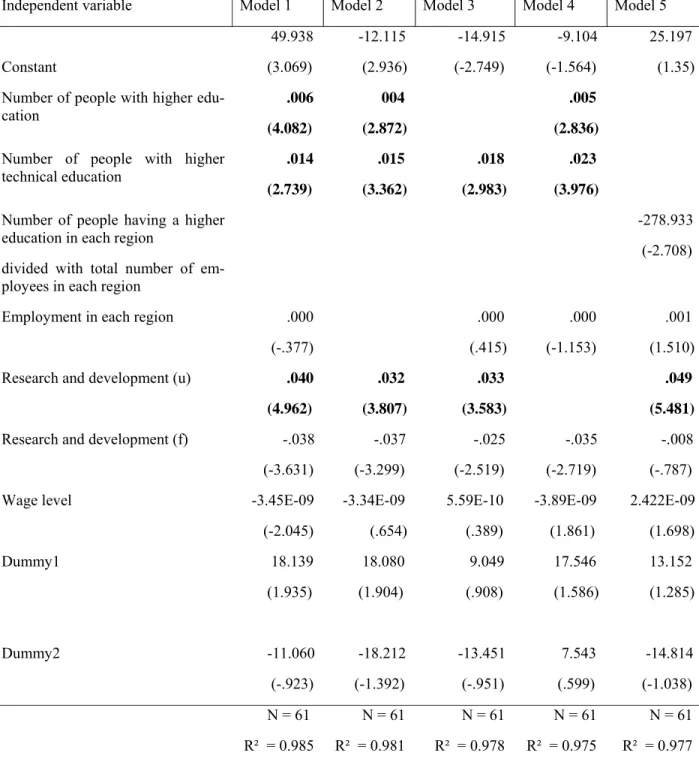
How good the independent variables are in predicting the dependent variable can be seen from the adjusted R². It also describes the amount of variation in the dependent variable explained by the regression line. Adjusted R² fluctuates between zero and one, where one fully explains the variation in the dependent variable, and zero that the vari-ables can’t explain the variation of the dependent variable. In the first model adjusted R² is close to one (0.978) which implies that the model almost fully can explain the varia-tion of the dependent variable.
According to the regression analysis numbers of people with higher education have an impact on number of patent applications in table 5.4. The hypothesis can’t be rejected as the values should be over 2 to able to show any significant results and here is the t-value 4.082. It can also be seen that in table 5.4 that the variables R&D(u) and TECH shows significant results. This indicates that they have positive relationships with patent applications.
In the second estimated model the variable EMP will be excluded as high multicolliniar-ity were found between this variable and the variables HE, R&D(u), TECH and WAGE (See appendix 1).The second estimated model looks as follows:
PA = β0+ β1HE + β2R&D(u) + β3R&D(f) + β4WAGE + β5TECH + β6D1 + β7D2 + ε
(Equation 6.2) In the second estimated model adjusted R² was 0.978, which once again implies that the model almost fully can explain the variation of the dependent variable. No other major differences from model 6.1 could be seen. The three significant models are still HE, R&D(u) and TECH. A trend can now be seen, but further models have to be estimated to be sure about the results.
In the third model the variable HE will be excluded, as this variable also have high mul-ticolliniarity towards the other variables.
PA = β0+ β1Emp + β2R&D(u) + β3R&D(f) + β4WAGE + β5TECH + β6D1 + ε
(Equation 6.3) The results from this regression don’t show any other significant variables than the pre-vious mentioned and a pattern starts to reveal. The adjusted R² for the model was 0.974 which implies that the model almost fully can explain the variation of the dependent variable.
The fourth model will exclude the variable R&D(u), as this variable have high multicol-liniarity towards some of the other variables.
PA = β0 + β1Emp + β2HE + β3R&D(f) + β4TECH + β5D1 + β6D2 + ε
(Equation 6.4) The fourth model showed no differences in terms if significant variables. The model’s adjusted R² is 0.978 which implies that the model almost fully can explain the variation of the dependent variable.
The fifth and last 13model in the thesis will combine the two variables number of people
with higher education and the total number of employee in each region into one variable called HEMP. This will be done as these two variables are highly correlated with each other and when combining these two, the problem with heteroskedasticity14 might be avoided. The model looks as follows:
PA = β0 + β1HEEMP + β3R&D(f) + β4 R&D(u) + β5TECH + β6D1 + β7D2 ε
(Equation 6.5)
13Further models will not be presented as no other significant could be found.
14 Heteroskedasticity refers to unequal variance in the regression errors. Heteroskedasticity describes data
sample or data-generating process in which the errors are drawn from different distributions for different values of the independent variables. Most commonly heteroskedasticity takes the form of changes in vari-ance. When errors are drawn from different distributions, or if higher moments of the error distributions
Table 5.4 Model summary
Independent variable Model 1 Model 2 Model 3 Model 4 Model 5
Constant 49.938 (3.069) -12.115 (2.936) -14.915 (-2.749) -9.104 (-1.564) 25.197 (1.35) Number of people with higher
edu-cation .006 (4.082) 004 (2.872) .005 (2.836)
Number of people with higher technical education .014 (2.739) .015 (3.362) .018 (2.983) .023 (3.976)
Number of people having a higher education in each region
divided with total number of em-ployees in each region
-278.933 (-2.708)
Employment in each region .000 (-.377) .000 (.415) .000 (-1.153) .001 (1.510) Research and development (u) .040
(4.962) .032 (3.807) .033 (3.583) .049 (5.481)
Research and development (f) -.038 (-3.631) -.037 (-3.299) -.025 (-2.519) -.035 (-2.719) -.008 (-.787)
Wage level -3.45E-09
(-2.045) -3.34E-09 (.654) 5.59E-10 (.389) -3.89E-09 (1.861) 2.422E-09 (1.698) Dummy1 18.139 (1.935) 18.080 (1.904) 9.049 (.908) 17.546 (1.586) 13.152 (1.285) Dummy2 -11.060 (-.923) -18.212 (-1.392) -13.451 (-.951) 7.543 (.599) -14.814 (-1.038) N = 61 R² = 0.985 N = 61 R² = 0.981 N = 61 R² = 0.978 N = 61 R² = 0.975 N = 61 R² = 0.977
5.4 Critique of the results
The data used in the thesis is taken from EPO. As mentioned before, it is more costly applying for EPO patent than data taken from PRV15, leading to not all patent
applica-tions will be in the thesis. Also, time between investigated number of people with higher education and number of patent applications is nine years. This may not be opti-mal to see any relationship between number of people with higher education and num-ber of patent applications.
Data for patent applications is only for the year 1999. Earlier investigations suggest that patent applications differ depending on the economical climate. During years with eco-nomical upswing more patent applications is asked for and during ecoeco-nomical decline less patent applications is asked for, as R&D various cyclically. This thesis takes no no-tice of the economical climate in Sweden 1999. The results in the thesis would maybe be different if another year would have been selected.
The figures presume that only University educated persons apply for patents. This is of course not true. Many patents have been applied for during time of both women and men without any higher education, even if most of them were applied by people with higher education, as the results in this thesis suggests.
6. Conclusion
Number of persons with a higher education has inclined swiftly during the last decades, as the University sector in Sweden has increased. This due to that the Swedish govern-ment has had a very encouraging attitude towards the Universities position for eco-nomic regional growth.
As described prior in the thesis, some former investigations have been positive and some have been negative towards the importance for regional growth. The purpose with this thesis was to come up with some new results in this field of research. The hypothe-sis in this thehypothe-sis was that University regions with high shares of students will show sig-nificant differences in terms of patent applications than other University regions with a lower share of students. As discussed earlier, patent is one way to measure innovations, and knowledge is one of the core foundations for new innovations. The theories in the thesis are focusing on regional growth through knowledge spillovers, human capital, clusters, and agglomeration that the location of a University can contribute with.
In the thesis investigations were performed with the variables number of people with higher education, wage level, R&D at Universities and firms, research and development at Universities, number of people working in each functional region and number of people with higher technical education included.
All regions that applied for a patent in 1999 were also investigated to be able to see which variables that was important for patent applications. These variables were inte-grated, as they are connected to the theoretical issues brought up in chapter five. The empirical findings came up with the results that number of people with higher education
actually had a positive impact on the number of patent applications in a region which complicates matters. Numbers of people with higher technical education showed not unexpectedly significant results for all regions, as most patent applications are of tech-nical art and therefore this variable should be positive in this thesis if my models would be somewhat correct, as the variable now was. This result also gives support for my theories presented in chapter 4.
When analyzing the 17 largest regions in Sweden, in terms of patent applications three different levels were found. In top was the region Malmö/Lund, due to the large ag-glomeration of Universities and private R&D departments. The next level contained re-gions with well known Universities, large population and in some of these rere-gions also large firms are located. In the third level regions with newer Universities, smaller firms and populations less patents were applied for.
What all five regressions performed had in common was that R&D at Universities is something central for patent applications. Put differently; if regions want to be in the front line of innovation progress they have to contribute to stimulating the climate for researchers at their local University. Having this in mind also remember what was men-tioned in chapter four. Andersson, Quigley, and Wilhelmsson (2002) came up with the result that larger amount of researchers at Universities have better effects on GRP than larger number of students. From these two conclusions is it possible to see that regional growth and patent applications are strongly connected to each other.
The expansion of the Swedish Universities could have been successful in terms of an improved innovative climate. This vague statement can only be used as my theses showed that number of people with higher education have a positive influence on patent applications in the country, as enrolled students at Universities have grown during the last decades. At the same time, empirical findings were found in the Malmö/Lund re-gion which gave support for Vargas conclusions about the positive development for patents with a formation of a critical mass when firms, Universities and people where centralised (see chapter 1.3). Further studies must therefore be conducted to be able to draw any final conclusions.
Finally, it should be brought up that the hypothesis in this thesis maybe would have been more accurate if it was performed in the future as the effect from the expansion of the Universities perhaps not yet can be shown
6.1 Suggestions for further research
Further investigations could for example analyze if the result would change if number of years between data for the selected variables would be dissimilar. It could also be in-teresting to see if variables not brought up in this thesis would change the result for the regression or another way to measure the result way used ( for example a Poisson analy-sis).
Investigations could also embrace University regions in the rest of the Nordic coun-tries. As these countries have a comparable University structure, where all citizens have the opportunity to study at Universities. Then a comparison could be per-formed, to see the similarities and differences between these countries in form of pat-ent applications structure.
References
Acs, Z, Anselin, L Varga, A, (2002) Patents and innovation counts as measures of re-gional production of new knowledge, Research policy, Vol. 31, 2002, no. 7, p. 1069-1085
Aghion, P, Howitt, P. (1998). Endogenous growth theory, Cambridge, Mass; Lon-don: MIT Press
Andersen, O.J, Arbo, P, Jussila, H, Nilsson J-E, Sandersen, H, (1993) Högskolene i Nord-Skandinavia: Drivkrafter for regional naeringsutvikling, Stockholm; NordREFO
Andersson, B (1998) Scandinavian evidence on growth and age structure, Uppsala Andersson, R, Quigley, J.and Wilhelmsson, M. (2002). University Decentralization as
Regional Policy: The Swedish Experiment, University of California, Berkeley. Batten, D (ed.). (2000). Learning, innovation and urban evolution, Boston, Mass.
Klu-wer Academic
Bendis, R, Bulumac, E. (2001) Utilizing technology transfer to develop small and me-dium enterprises, Amsterdam: IOS Press
Cederlund, K (1999). Universitet: Platser där världar möts, Stockholm: SNS (Studie-förb. Näringsliv och samhälle)
Dell, M, Rainnie, A (1996) The impact of the university of Hertfordshire on the local economy. University of Hertfordshire Business School
Ejermo, O (2004) Perspectives on regional and industrial dynamics of innovation, Jönköping International Business School Ltd
Fischer, J, Fröhlich, Manfred, M. (2001) Knowledge, complexity and innovation sys-tems, New York: Springer
Florax, R (1996).The University: a regional booster: economic impacts of academic knowledge infrastructure, Avebury
Johansson, B Samhälle och transporter: Diskussion av några transportpolitiska frågor 1992, Stockholm: Kungl Tekniska högskolan
Johansson, B, Karlsson, C, Stough, R. (2001) Theories of endogenous regional growth: lessons for regional policies, Berlin: Springer
Jonsson, O, Persson, H, Silbersky U. (2000) Innovativitet och regionen: företag,
pro-cesser och politik. Östersund : Institutet för regionalforskning
(SIR); Stockholm: Fritze
Karlsson, C, Larsson, J. (1989) Product and price competition: a characterization, Umeå: Cerum
Marshall, A. (1920) Principles of economics: an introductory volum 8.ed, London, Macmillan
McCann, P. (2001) Urban and regional economics, Oxford: Oxford University Press Olsson, B, Wiberg, U. (2003) Universitetet och den regionala utmaningen, Swedish
In-stitute for Studies in Education and Research, Nora: Nya Doxa
Pappas, J, (ed). (1997) The University's role in economic development: from research to outreach, San Francisco: Jossey-Bass
Romer, D. (2001) Advanced macroeconomics, Boston: McGraw-Hill
Sörlin, S. (1996) Universiteten som drivkrafter: globalisering, kunskapspolitik och den nya intellektuella geografin, Stockholm: SNS
Sörlin, S, Törnqvist, G (2000) Kunskap för välstånd: universiteten och omvandlingen av Sverige, Stockholm: SNS
Varga, A. (1998) University research and regional innovation: a spatial econometric analysis of academic technology transfers, Boston: Kluwer
Wikhall, M (2001) Universiteten och kompetenslandskapet: effekter av den högre ut-bildningens tillväxt och regionala spridning i Sverige, Lund
Internet Sources
(Andersson, R, Quiley, J, Willhelmsson, M. (2004)
www.infra.kth.se/BYFA/Publikationer/ Arbetsrapporter_pdf/rapport33.pdf(2004-11-14) www expovera.com (2005-01-18)
www.prv.se (2004-11-14) www.scb.se (2004-11-14)
Appendix 1
R&D(u) Emp HE PA R&D(f) Tech Wage HEEMP
DUMMIE 1 R&D(u) 1 ,843(**) ,848(**) ,880(**) ,851(**) ,859(**) ,838(**) ,590(**) ,443(**) . ,000 ,000 ,000 ,000 ,000 ,000 ,000 ,000 62 62 62 62 62 62 62 62 62 Emp ,843(**) 1 ,994(**) ,981(**) ,949(**) ,995(**) ,994(**) ,447(**) ,448(**) ,000 . ,000 ,000 ,000 ,000 ,000 ,000 ,000 62 62 62 62 62 62 62 62 62 HE ,848(**) ,994(**) 1 ,982(**) ,957(**) ,994(**) ,997(**) ,468(**) ,409(**) ,000 ,000 . ,000 ,000 ,000 ,000 ,000 ,001 62 62 62 62 62 62 62 62 62 PA ,880(**) ,981(**) ,982(**) 1 ,937(**) ,985(**) ,978(**) ,434(**) ,448(**) ,000 ,000 ,000 . ,000 ,000 ,000 ,000 ,000 62 62 62 62 62 62 62 62 62 R&D(f) ,851(**) ,949(**) ,957(**) ,937(**) 1 ,960(**) ,948(**) ,490(**) ,470(**) ,000 ,000 ,000 ,000 . ,000 ,000 ,000 ,000 62 62 62 62 62 62 62 62 62 Tech ,859(**) ,995(**) ,994(**) ,985(**) ,960(**) 1 ,992(**) ,456(**) ,441(**) ,000 ,000 ,000 ,000 ,000 . ,000 ,000 ,000 62 62 62 62 62 62 62 62 62 Wage ,838(**) ,994(**) ,997(**) ,978(**) ,948(**) ,992(**) 1 ,453(**) ,412(**) ,000 ,000 ,000 ,000 ,000 ,000 . ,000 ,001 62 62 62 62 62 62 62 62 62 HEEMP ,590(**) ,447(**) ,468(**) ,434(**) ,490(**) ,456(**) ,453(**) 1 ,387(**) ,000 ,000 ,000 ,000 ,000 ,000 ,000 . ,002 62 62 62 62 62 62 62 62 62 DUMMIE1 ,443(**) ,448(**) ,409(**) ,448(**) ,470(**) ,441(**) ,412(**) ,387(**) 1 ,000 ,000 ,001 ,000 ,000 ,000 ,001 ,002 . 62 62 62 62 62 62 62 62 62