LIGHTHOUSE REPORTS
Size, specialization and
flexibility – the role of ports
in a sustainable transport
system
En förstudie utförd inom Trafikverkets branschprogram Hållbar
sjöfart som drivs av Lighthouse
Size, specialization and flexibility – the role
of ports in a sustainable transport system
Authors
Axel Merkel, VTI
Inge Vierth, VTI
Magnus Johansson, VTI
Marta Gonzales-Aregall, University of Gothenburg
Anastasia Christodoulou, University of Gothenburg
Kevin Cullinane, University of Gothenburg
Coordinated by
VTI in co-operation with
Skogsindustrierna (Karolina Boholm) SCA (Magnus Svensson)
Metsä (Peter Stromberg)
Näringslivets Transportråd (Jenni Ranhagen) Sveriges Hamnar (Christine Hanefalk) Svensk Sjöfart (Rikard Engström) Sjöfartsverket (Emelie Angberg) Region Skåne (Petra Stelling) Trafikverket (Björn Garberg)
Transportstyrelsen (Christina Berlin och Malin Lokrantz)
The report was reviewed by Petra Stelling prior to publication. We are also grateful for comments and suggestions made by Åsa Burman.
Denna förstudie har genomförts inom Trafikverkets branschprogramHållbar sjöfart, som drivs av Lighthouse.
Summary
In moving towards a sustainable transport system, the Swedish government has stated that policy actions related to electrification and increasing the share of renewable fuels must be complemented with a modal shift of freight transport from road to rail and sea. The question addressed in this report is whether policies aimed specifically at improving the attractiveness of small ports in Sweden can contribute to an increased use of maritime transport by enabling more competitive services. Small ports are typically considered to be at a disadvantage due to not being able to achieve economies of scale and their lack of connectivity to large trade routes. There are significant economies of scale in port operations but increasing the competitiveness of small and peripheral ports may be key to achieving a modal shift. This study sets out to investigate broadly what would be required for maritime transport services utilizing small ports to be competitive vis-à-vis competing land-based services.
Swedish small ports are at a structural disadvantage in several respects. For several small ports, users face higher costs of pilotage due to long and time-consuming navigational approaches. The current structure of fairway dues is not set up to incentivize maritime services consolidating/de-consolidating cargo at several small ports. The sum of port-related costs is high in general, which incentivizes a
reduction in the number of port calls and favours a rationalization of avoidable visits at small ports.
In order to investigate the potential for small ports to contribute to a modal shift, we simulate the effect of four policy scenarios aimed to improve the
competitiveness of maritime freight transport as a modal alternative or to improve the competitiveness of small ports specifically. These scenarios are 1) reducing maritime transport costs, 2) increasing road transport costs, 3) reducing the costs of cargo handling at small Swedish ports and 4) reducing cargo handling times at small Swedish ports.
The results show that all simulated scenarios would lead to an increase in the modal share of maritime freight transport. However, the effect of the policies that either reduce maritime transport costs overall or increase road transport costs have a greater effect on the modal split than the policies aimed specifically at small ports. The interesting finding is made that most of the increased maritime tonnage that would follow as a result of more competitive maritime freight services would be absorbed by small ports in the system. The study shows that in order to enact a successful modal shift strategy, small and peripheral ports need be considered as part of the solution. If extending the sea legs of intermodal freight trips is an objective, it is crucial to maintain a geographically diverse and highly functioning port system in order to serve the needs of shippers and cargo owners. We
underutilized potential in the entire port system can be used to promote competitive short-sea services as a modal alternative to road.
Sammanfattning
I regeringens nationella godsstrategi framgår att omställningen till ett hållbart transportsystem måste ske delvis genom ökad elektrifiering och ökad användning av förnybart bränsle samt delvis genom en överflyttning av godstransporter från väg till järnväg och sjöfart. I den här förstudien undersöks hamnarnas roll i en sådan överflyttning. Ungefär hälften av allt gods som transporteras sjövägen transiterar någon av Sveriges fem största hamnar. Handelsflöden till sjöss är med andra ord starkt koncentrerade till ett fåtal punkter samtidigt som Sveriges hamnutbud är brett och geografiskt diversifierat. Små hamnar förutsätts ofta ha strukturella konkurrensnackdelar som följer av en begränsad skala på
verksamheten. Samtidigt kan det vara viktigt att förbättra konkurrenskraften hos små och perifera hamnar för att skapa förutsättningar för en överflyttning till sjö. Syftet med förstudien är att brett undersöka vilken potential som finns i att göra sjöfartsupplägg som anlöper mindre hamnar mer konkurrenskraftiga gentemot vägtransporter.
Små hamnar i Sverige missgynnas av flera omständigheter. I flera fall är lotsning i dessa hamnar förknippad med hög kostnad och tidsåtgång per transporterat ton eller enhet. Det kan också anmärkas att det nuvarande farledsavgiftssystemet, där avgift tas ut både rörligt baserat på godsmängd och fast per anlöp, minskar incitamenten att driva ett sjöfartsupplägg som innebär upphämtningar och
delleveranser av gods i flera mindre hamnar längs kusten. Att anlöpskostnaderna i svenska hamnar generellt sett är höga bidrar till att anlöp i mindre hamnar
undviks, vilket kan ha följden att sjöbenet i intermodala transporter förkortas. För att besvara frågan om små hamnars potential att attrahera överflyttade godsvolymer simuleras fyra policyscenarier som syftar till att antingen generellt öka sjöfartens konkurrenskraft eller specifikt öka små hamnars konkurrenskraft. Det första policyscenariet är en allmän (global) minskning av sjöfartens
transportkostnader (avstånds- och tidsbaserade). Detta inkluderar
bränslekostnader, personalkostnader, underhållskostnader, kostnader för administration och kapitalkostnader. Det andra policyscenariet är en allmän (global) ökning av vägtrafikens transportkostnader. De tredje och fjärde policyscenarierna går ut på att minska kostnaden respektive tidsåtgången för godshantering för fartyg som anlöper små hamnar. De sistnämnda scenarierna handlar alltså om att undersöka effekterna av riktade åtgärder för att stärka konkurrenskraften hos små svenska hamnar. För analyserna används den
nationella godsmodellen Samgods. Klassificeringen av hamnar som små är en svår fråga som i den här förstudien har lösts genom att utgå från godsomsättning. Alla hamnar som i Samgodsmodellens basår (2017) omsatte mindre än 2 miljoner ton (drygt 1 procent av den totala godsomsättningen i svenska hamnar) klassificeras som små. Analyserna omfattar både allmänna hamnar och industrihamnar. En
avgränsning är att färjetrafik (RoPax) inte ingår i analyserna. Tabellen nedan sammanfattar de undersökta policyscenarierna.
Förväntad effekt på sjöfartens andel av transportarbetet Förväntad effekt på användningen av små hamnar Exempel på motsvarande policyverktyg Specifikt riktade mot små hamnar? PS1: Minskade sjötransportkost
nader globalt + +/- Nej
PS2: Ökade vägtransportkost nader globalt + +/- Ökad bränsleskatt / kilometerskatt Nej PS3: Minskade omlastningskost nader i små svenska hamnar +/- + Omlastningspeng / reducerad lotsavgift / stöd för automatisering Ja PS4: Minskade omlastningstider i små svenska hamnar +/- + Förenkling av administrativa processer / stöd för automatisering Ja
Tabell 2: Policyscenarier som simuleras i förstudien Resultaten visar att alla simulerade policyscenarier leder till en ökning i sjöfartens andel av det totala godstransportarbetet i Sverige. Denna överflyttningseffekt är dock störst för de två första policyscenarierna, som alltså handlar om generella åtgärder för att öka sjöfartens konkurrenskraft. Ett intressant resultat är också att i samtliga policyscenarier ökar små hamnars andel av den totala godsomsättningen i det svenska hamnsystemet. Det betyder att i de fallen sjöfarten tar godsvolymer från övriga trafikslag fångas den största delen av denna volymökning upp av mindre hamnar. Detta antas vara en konsekvens av att många mindre hamnar ligger nära godsflödens målpunkter och att det därmed går att förlänga sträckorna till sjöss och minska på mängden landbaserad transport.
Vid en ökning av små hamnars konkurrenskraft, vilket simuleras i policyscenario 3 och 4, sker i första hand en överflyttning från större till mindre hamnar. Detta illustrerar att konkurrensen mellan hamnar i vanliga fall är större än konkurrensen mellan trafikslagen. Under vissa förutsättningar kan en överflyttning av volymer från större till mindre hamnar leda till negativa konsekvenser för
transportsystemet som helhet. Beräkningarna med Samgodsmodellen indikerar att en överflyttning av godsvolymer från hamnar med stordriftsfördelar till hamnar med mindre skala på verksamheten kan leda till vissa oönskade effekter i form av att möjligheterna till samlastning och användning av större fartyg/hög turtäthet i större hamnar minskar. Det bör dock betonas att modelleringen av sådana
stordriftsfördelar i Samgodsmodellen är osäker och dessa resultat bör tolkas med försiktighet.
När modellresultaten bryts ner på varugruppsnivå är det tydligt att vissa varugrupper framstår som lättare att flytta över till sjöfart än andra. De två varugrupper som sticker ut i alla policyscenarier är livsmedelsprodukter och tillverkade varor. Till exempel visar resultaten att en tioprocentig minskning i lastnings- och lossningskostnaderna i små svenska hamnar beräknas generera en femprocentig respektive treprocentig ökning i de totala fraktvolymerna av livsmedel och tillverkade varor till sjöss. I stort sett hela denna ökning sker i mindre hamnar. Även vid en generell (hamnneutral) förbättring av sjöfartens konkurrenskraft beräknas dessa varugrupper öka i omfattning både totalt sett och synnerligen i små hamnar.
Huvudresultatet är att i alla de simulerade policyscenarierna förverkligas en överflyttning av transportarbetet genom en större användning av små hamnar. Detta tolkas som en viktig indikation på att de små hamnarnas roll i att
framgångsrikt bygga ett konkurrenskraftigt sjöfartsystem, där hållbara
transportupplägg med kustsjöfart kan vara ett alternativ till vägtransporter, inte kan negligeras. Om det är önskvärt att förlänga sjöbenen i svenska
godstransporter så är det av vikt att upprätthålla ett geografiskt utspritt utbud av goda och kostnadseffektiva hamntjänster. Baserat på förstudiens resultat finns en tydlig potential att vidare undersöka hur hela hamnsystemets kapacitet kan
tillvaratas för att skapa förutsättningar för konkurrenskraftiga sjöfartsupplägg som ett alternativ till vägtransporter.
Contents
1. Introduction ... 8
2. Background: The structure and evolution of Sweden’s port system ... 11
3. Economies and diseconomies of scale – Can the use of small ports be cost-effective? ... 16
3.1 Theoretical advantages and disadvantages of small ports ... 16
3.2 Specific advantages and disadvantages of small ports in Sweden ... 22
3.3 Characteristics of maritime transport services using small ports ... 25
3.4 Policies for competitive small and peripheral ports in other countries ... 27
4. Methodology ... 29
4.1 Classifying ports by size: What is a “small” port in Sweden? ... 29
4.2 Policy scenarios to support the use of small ports ... 30
Reducing maritime transport costs ... 30
Increasing road transport costs ... 32
Lowering the cost of cargo transfer in small ports ... 32
Reducing cargo handling time ... 34
Summary of policy scenarios ... 34
4.3 About the Samgods national freight model ... 35
5. Results: effects of simulated policy alternatives ... 36
5.1 Effects of a general reduction in maritime transport costs ... 36
5.2 Effects of increasing road transport costs ... 38
5.3 Effects of reducing cargo handling costs in small ports ... 40
5.4 Effects of reducing cargo handling time in small ports ... 42
5.5 Summary of results ... 44
5.6 Effects for different cargo types ... 45
6. Conclusions and suggestions for future research ... 49
1. Introduction
In moving towards a sustainable transport system, the Swedish government (Regeringen, 2018) has stated that policy actions related to electrification and increasing the share of renewable fuels must be complemented with a modal shift of freight transport from road to rail and sea. This is in line with the target set out in the European Commission’s white paper on transport (COM, 2011), which is to shift 30 percent of all road freight carried over 300 kilometers or more to rail or sea. Stimulating a modal shift from road has however proven difficult, both at the European level and in Sweden. Comparing the modal split of freight tonne-kilometers within and between countries in the EU-28 in 2012 and 2017 shows that the shares of road, maritime and rail transport remained roughly constant (Eurostat, 2019). The same tendency can be observed in Sweden: the modal shares of freight transport have been more or less fixed over time (Transport Analysis, 2019a). Several studies (Ng, 2009; Aleman et al., 2015; Suarez-Aleman, 2016) have argued that the role of seaports in facilitating a modal shift has been overlooked. The Swedish Maritime Administration (2016) has found that high port-related costs are a significant barrier to realizing a shift towards an increased use of maritime transport. For Ro/Ro and container shipments, these costs are found to account for 36-62 percent of total transport costs (Swedish Maritime Administration, 2016). By enhancing the efficiency of port operations, which could mean reducing waiting times, improving cargo handling efficiency, increasing the speed of administrative procedures or otherwise lowering the cost of a port call, the competitiveness of short-sea shipping (SSS) vis-à-vis road transport would be improved. Such efficiency improvements in ports could not only lead to a direct increase in the viability of SSS (Transport Analysis, 2019b, Swedish Transport Administration, 2019) but could also serve to make other policies incentivizing a modal shift more impactful (Suarez-Aleman et al., 2015). An increased use of maritime transport could contribute to the Swedish goal of cutting greenhouse gas (GHG) emissions from domestic transport by 70 percent by 2030 compared to 2010 (Regeringen, 2018), since shipping in general causes less GHG emissions per tonne-kilometer than road transport (Sims et al., 2014). Short-sea shipping is often considered to be an inferior option to road transport from a shipper’s point of view, due to it being comparatively inflexible, infrequent and slow (Stelling et al., 2019; Paixao and Marlow, 2002). On the other hand, maritime transport does not suffer from the same capacity limitations as road transport and there is a significant amount of infrastructure capacity that could potentially be better utilized. Sweden has a large port network, as visualized in Figure 1, though cargo flows tend to be concentrated in a few large ports. This is particularly true for Ro/Ro and containerized cargoes, where around 85 and 70 percent respectively of all weight is handled in the five largest ports. The question addressed in this report is whether policies aimed specifically at improving the attractiveness of small ports in Sweden can contribute to an increased use of
maritime transport by enabling more competitive services. Small ports are typically considered to be at a disadvantage due to not being able to achieve economies of scale and their lack of connectivity to large trade routes (de Langen, 1998). The question of whether small ports can be cost-efficient is related to the issue of minimum efficient scale (MES), meaning the smallest scale at which average port costs can be minimized. Conventional wisdom in port studies holds that there are significant economies of scale in ports (Hayuth, 1981; de Neufville and
Tsunokawa, 1981), but Hayuth (1981) also suggested that at a certain scale, diseconomies of size will begin to set in – implying that average port costs with respect to throughput follows a U-shaped curve (illustrated in Figure 4). Though the idea of MES in the port industry is a useful concept, particularly in designing terminal concession policies (de Langen and Pallis, 2006), there has been relatively little empirical research aimed at uncovering the actual limits at which ports can be expected to operate with scale efficiency. de Langen and Pallis (2007) identified entry barriers in the port service provider market, several of which are directly related to the scale of operations, and while their analysis is at the terminal
operator level, it holds some relevance for the study of scale economies in the port as a whole. One of their remarks is that accumulated public investment in
infrastructure, including hinterland connections, gives incumbents (or in this context: large ports which have benefited from past infrastructure investments) a cost advantage. A limitation of the literature to date is that most researchers have focused exclusively on container ports, so that there is a significant knowledge gap in understanding the dynamics of scale in ports handling other types of cargo. This pre-study will set out to describe and analyze the current and possible role of small ports in the Swedish transport system, aiming to answer the following questions:
- Can an increased use of small ports be cost-effective?
- What would be required for smaller ports to more effectively compete with road transport?
- Are there market segments where cost and time improvements in small ports can lead to a modal shift from road, thereby reducing the GHG emissions of freight transport?
The first question will be answered by conducting a literature review and gathering facts regarding the economies and diseconomies of scale in Swedish ports. We will also run simulations of a national freight model, Samgods, to test the predicted consequences of introducing policies that favor the use of small ports and that improve the competitiveness of SSS. The model simulations will allow us to study the potential for a modal shift to sea.
As this is a pre-study, the objective is to investigate whether an increased usage of small ports has the potential to shift goods from land to sea. The results show that there does appear to be such a potential. In the final section of the study, we
describe the possible direction for a more extensive research effort in order to help realize this potential.
2. Background: The structure and evolution of Sweden’s
port system
Sweden is a small and trade-dependent economy, which due to its extensive coastline and water access has long relied on maritime transport. Around 70 percent of all imported and exported goods (in terms of weight) is carried by ship (Transport Analysis, 2017a). This figure is even greater, around 80 percent, if one accounts for the iron ore products shipped by rail to the Norwegian port of Narvik and departing from there by ship. Swedish maritime trade has a history of being concentrated to a few port cities. In the middle of the 18th century, roughly three quarters of the country’s imports came through Stockholm or Gothenburg, and the two cities’ corresponding share of exports was around 80 percent
(Statistics Sweden, 1972). Relaxed regulations concerning which cities could be used as ports for international trade (so-called “staple ports”), as well as other factors, led to a de-concentration of trade flows. By the beginning of the 20th century, Stockholm and Gothenburg only accounted for around half of the country’s imports and a third of its exports (Statistics Sweden, 1972). As of 2018, the five largest ports in terms of throughput together account for 58 percent of foreign trade (measured by weight) carried by sea (Ports of Sweden, 2019). Gothenburg alone accounts for around 30 percent.
Most ports in Sweden are owned by municipalities and operated for multiple users, though there are a number of single-user ports owned by the private sector (SOU 2007:58; Bergqvist and Cullinane, 2017). There are 54 Swedish ports that are designated as ‘public’ by the Swedish Maritime Administration (SJÖFS 2013:4), meaning that these ports are publicly open to traffic and in principle obligated to serve any calling ship, given that capacity is available. In addition, there are several single-user ports. These are mostly relatively small, though the private single-user port of Brofjorden (located around 75 km north of
Gothenburg) is the second largest in Sweden in terms of tonnage. The amount and distribution of cargo in Swedish ports is visualized in Figure 1. The
visualization in Figure 1 is based on data in the Samgods freight model and
provides a comprehensive view of the Swedish port network. As can be seen from Figure 1, most ports classifiable as large are located close to the three largest urban centers Stockholm, Gothenburg and Malmö. In addition, there are large ports serving natural resources industries in the north, such as Luleå, which generate significant amounts of throughput. Most ports classifiable as small are located away from urban centers of population and can be described as peripheral parts of the port system.
In 2007, a large government-commissioned report on prioritizations in the Swedish port sector recommended appointing 10 ports of special ‘strategic
importance’ (SOU 2007:58). The suggested ports were Gothenburg, Helsingborg, Malmö, Trelleborg, Karlshamn, Norrköping, Stockholm (Kapellskär), Gävle,
Sundsvall and Luleå. The proposition was that these ports, which were classified as strategically important based on throughput, infrastructure, specialization and co-operation, would be given special priority in national infrastructure planning. The suggestion included that these ports would be preferentially treated by the government when it came to fairway maintenance, the quality of pilot services and landside connecting infrastructure. In return, ports designated as strategically important were to be public, able to provide services 24 hours a day and pursue ‘ambitious and active’ environmental policies. The proposal was not implemented by the government and the question of whether and how to strategically plan for a competitive and sustainable port system remains.
Figure 1: Location and size of Swedish ports scaled by annual throughput in tonnes, as modelled in the national freight model Samgods. Ports are classified as ‘small’ in this study if their annual throughput in the model’s base year does not exceed 2 million tonnes. See section 4.1. for an elaboration on this classification.
Port Throughput Dry bulk share Liquid bulk
share Container share Ro/Ro share Max draft TEN-T status Note Göteborg 40,635 1% 58% 17% 21% 13.50 Core Trelleborg 11,224 0% 0% 0% 99% 7.80 Core Stockholm 9,441 15% 5% 4% 74% 16.5 (after construction of Norvik is completed) Core Ports of Stockholm, Kapellskär, Nynäshamn and Norvik Malmö 8,342 12% 31% 2% 50% 12.50 Core Joint venture with the port of Copenhagen. Helsingborg 7,932 4% 4% 26% 65% 12.30 Compr.
Luleå 7,674 96% 4% 0% 0% 10.90 Core Gävle 5,457 40% 31% 29% 0% construction) 12.2 (under Compr. Karlshamn 5,268 24% 28% 0% 33% 10.50 Compr. Oxelösund 4,332 87% 6% 2% 5% 15.50 Compr. Ports of
Halland 4,228 62% 10% 10% 15% 9.50 Compr. Ports of Halmstad and Varberg. Norrköping 3,891 40% 39% 20% 0% 14.90 Compr. Ystad 3,685 2% 0% 0% 98% 6.70 Compr. Mälarhamnar 2,583 53% 33% 5% 0% 7 (after ongoing canal expansion) Compr.
Ports of Köping and Västerås Husum 2,243 78% 6% 0% 17% 10.50 N/A Piteå 2,124 61% 23% 12% 0% 12.50 N/A Karlskrona 1,965 2% 0% 0% 94% 9.00 Compr. Umeå 1,907 44% 18% 10% 21% 11.00 Compr. Sundsvall 1,852 36% 29% 14% 20% 12.00 Compr. Skellefteå 1,539 64% 36% 0% 0% 12.00 N/A Mönsterås 1,351 96% 4% 0% 0% 8.20 N/A Vänerhamn 1,251 96% 4% 0% 0% 5.40 N/A Ports of Karlstad, Kristinehamn, Otterbäcken, Lidköping and Vänersborg Södertälje 1,221 37% 42% 9% 0% 9.00 N/A Uddevalla 1,100 71% 10% 0% 0% 11.00 N/A Ports of Gotland 1,037 27% 7% 0% 66% 8 Compr.
Ports of Visby, Slite, Ronehamn, Klintehamn and Kappelshamn. Sölvesborg 1,004 93% 8% 0% 0% 7.70 N/A Örnsköldsvik 933 80% 20% 0% 0% 10.00 N/A Iggesund 900 97% 3% 0% 0% 7.70 N/A Kalmar 881 59% 41% 0% 0% 8.00 N/A Oskarshamn 813 46% 9% 0% 45% 11.00 Compr.
Söderhamn 705 95% 5% 0% 0% 11.00 N/A Långrör and Stugsund Ports of Orrskär, Åhus 677 80% 1% 19% 0% 8.90 N/A Landskrona 548 89% 5% 0% 0% 10.10 N/A Wallhamn 545 4% 0% 42% 0% 10.00 N/A Falkenberg 538 54% 0% 0% 0% 7.00 N/A Hargshamn 418 57% 0% 0% 0% 11 (after ongoing fairway expansion) N/A Västervik 174 51% 49% 0% 0% 9.50 N/A Lysekil 119 31% 0% 0% 0% 10.00 N/A Söråker 114 99% 0% 0% 0% 6.10 N/A
Table 1: Ports of Sweden members, listed in order of 2018 throughput in thousand tonnes. Source: Throughput statistics from Ports of Sweden (2019), information regarding rail connections and maximum draft from SOU 2007:58, ports’ websites and the Swedish Maritime Administration’s published navigational
restrictions.
It is not necessarily clear that prioritizing only large ports in infrastructure planning is the most effective way of improving the conditions for maritime
freight transport. As is highlighted in this report, small ports could be important in achieving a successful modal shift strategy. Overall, Sweden lacks a strategy at the national level for the development of the port system (Transport Analysis, 2019c). This lack of direction may create additional challenges in creating a sustainable and competitive transport system for the future.
At the European level, most policy efforts to support the development and efficient operations of ports are focused on the ‘core’ ports in the TEN-T. In total, the 329 ports included in the TEN-T make up only a quarter of all
European seaports (INTERREG IV, 2014). Small and medium sized ports have received less funding from EU transport policies and have instead had to engage in co-operative schemes through e.g. EU structural funds (INTERREG IV, 2014). In fact, most public policies aimed at supporting seaports is focused on large ports, as their importance to the transport system is obvious. Whether this puts small ports at a further disadvantage, and if so, whether policies should be put in place to support the role of small and peripheral ports, are important questions. Monios (2017) concludes that as small ports face increasing structural challenges in the future, policy makers need to consider how to support shippers utilizing these ports. It is argued that if shipping routes transiting through small ports are to remain competitive, policy makers may need to assist in upgrading ports or subsidizing transport costs.
Though the government agency Transport Analysis publishes official maritime traffic statistics, these are not broken down at the port level. For this reason, we also use statistics directly from the Ports of Sweden (2019) in this section, in order to describe the structure and historical development of the port system.
Throughput statistics from Ports of Sweden (2019) are described in Table 1. Note that the ports included in Table 1 are only those included in the throughput statistics provided by Ports of Sweden. In reality, and in our subsequent
modelling, the number of ports is significantly greater – as in Figure 1. The total throughput of all the ports included in Table 1 represent 77 percent of all port throughput in Sweden.
It is interesting to note that out of the 20 smallest ports in the Ports of Sweden (2019) statistics in Table 1, all of which handle around or below 1.5 million tonnes annually, 15 deal mostly with dry bulk products. Around half of these ports are located north of Stockholm. By contrast, most ports handling a majority (in tonnage terms) of Ro/Ro cargo are in the south of Sweden. The fact that most of a port’s throughput in tonnage terms is in a particular cargo type does not
necessarily reflect the cargo handling specialization of a port. For example, the ports of Gothenburg and Gävle are heavily invested in and generate significant revenues from container handling. These ports could reasonably be classified as specialized container ports, though it does not represent the majority cargo type in terms of throughput.
Figure 2: Throughput development in Swedish ports (thousand tonnes) by NUTS II region. Source: Ports of Sweden (2019)
Figure 2 shows the development of total throughput in Ports of Sweden members since 1999 and how this development is spread across NUTS II regions. An increasing share of cargo is handled in West Sweden (34 percent in 2018) and ports in South and West Sweden together account for more than half (63 percent) of total throughput volumes. The total rate of throughput growth over this period has been around 20 percent, which is close to the growth recorded in the regions of Stockholm, West Sweden and South Sweden.
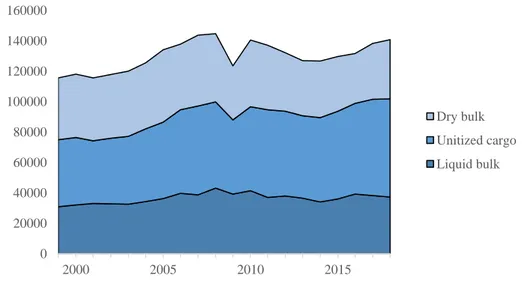
Figure 3 shows the distribution of throughput across different cargo types. It is notable that unitized cargo, which includes containerized/palletized goods,
trailers, vehicles and other Ro/Ro-cargo, has grown by 47 percent over the period.
Figure 3: Throughput development in Swedish ports (thousand tonnes) by cargo type. Source: Ports of Sweden (2019)
0 20,000 40,000 60,000 80,000 100,000 120,000 140,000 160,000 2000 2005 2010 2015 Upper Norrland Middle Norrland North Middle Sweden West Sweden South Sweden
Småland and the islands East Middle Sweden Stockholm 0 20000 40000 60000 80000 100000 120000 140000 160000 2000 2005 2010 2015 Dry bulk Unitized cargo Liquid bulk
3. Economies and diseconomies of scale – Can the use of
small ports be cost-effective?
3.1 Theoretical advantages and disadvantages of small ports
The scientific literature on ports often, explicitly or implicitly, restricts its attention to large container ports. There has however been an increasing tendency in the literature to also focus on small and medium sized ports, as exemplified by several studies (Ding et al., 2015; Svindland et al., 2019; Feng and Notteboom, 2013; Monios, 2017). Some of this attention on smaller ports is related to the ongoing trend of increasing container ship sizes. Although the push for growth in
container ship sizes is occurring at the level of the largest vessels – the largest ship brought to the market in 2019 could carry more than 23,000 twenty-foot
equivalent unit (TEU) containers (Ge et al., 2019) – small ports are not unaffected by this development. As discussed by Monios (2017), the use of these very large vessels on major trade lanes leads to a ‘cascading’ downward of vessels onto trade lanes that would previously have been served by smaller ships. Monios (2017) shows that a likely result of this trend is a phasing out of small container ships (< 1,000 TEU), which poses challenges for the many small ports lacking
infrastructure capacity to handle deeper-draft ships. These ports run the risk of being rationalized if current trends in fleet development cause further
concentration of flows in larger hubs.
Small ports cannot, in many cases, generate large enough traffic volumes to support infrastructure expansion in response to fleet changes. This potentially makes them vulnerable, in the sense that they might be bypassed in favour of ports better suited to handle larger ships. This will also result in an increased use of land-based transport in order to move cargo to the larger port. However, the drivers of port rationalization discussed by Monios (2017) might not actually lead small ports being bypassed or rationalized. Svindland et al. (2019) studied whether such an effect had materialized in Norwegian container port system and found that the overall trend during the period 2003-2015 was de-concentration, rather than concentration. Even though the Norwegian port system comprises many small ports, they found no indication that the number of ports in use had been reduced in recent years. From a policy perspective, the rationale to keep small Norwegian ports in operation rather than to encourage consolidation in pursuit of greater scale economies has been a belief that door-to-door distribution costs would increase following a consolidation of port capacity (Marskar et al. 2015). The reasoning is that the cost savings due to greater economies of scale would be more than outweighed by the increased costs associated with a sparser regional supply of ports along the coastline. Marskar et al. (2015) also made the claim that there is a “very weak connection between ports’ size and the costs of using them” (p. 213). This is an interesting assertion that motivates a further inquiry into the effects of scale on port costs.
There are certain indivisibilities that set a lower limit to the feasible size of ports. For example, a port, no matter what size, must have adequate land-side transport access and maritime infrastructure that permits a navigable approach. Beyond these indivisibilities, there is little reason to believe that the costs of constructing port infrastructure should be anything but proportional to scale. However, the long-run costs of port operations may still be scale-dependent. Jansson and
Shneerson (1982) showed, using a modelling framework based on queuing theory, that expanding both the demand and capacity (proxied as the number of berthing locations) at the same rate will lead to reduced time spent by ships waiting for capacity to become available. The result is intuitively reasonable. If the demand for port services (ship arrivals) is unpredictable to some degree, it is not possible to plan for capacity to perfectly match that level which would be enough to satisfy demand on a given day. In addition, the demand for maritime transport can be volatile, while port capacity expansions take time to realize. In a small port with only one or a few berthing spaces, the unpredictability of demand will sometimes result in a situation where an arriving vessel finds no available capacity and must wait. In queuing systems, the expected waiting time of an arriving ship increases very sharply as the average capacity utilization approaches 100 percent. In a larger port, even if the proportions between capacity and demand are the same as in the small port, the probability of an arriving vessel finding no empty capacity is smaller. Additionally, if an arriving vessel does have to wait, the expected waiting time is shorter. There are a few limitations to this argument: it is difficult to predict the actual arrival and queuing patterns of ships and one often
underestimates the opportunities for port and/or transport mode substitution in the face of port congestion. Still, the queuing theory approach shows that there are at least theoretical reasons to expect large ports to serve users more efficiently than small ports.
There are other reasons why large ports may be more attractive to users. De Langen (1998) distinguishes between three kinds of scale economies: (i) those related to the handling of cargo, (ii) those related to hinterland transport and (iii) those related to agglomeration effects. Scale economies in cargo handling mean that the average cost of loading/unloading cargo is lower in larger ports. This could be expected to be the case if, for example, a larger scale of operation permits having several specialized terminals with differentiated equipment and expertise that enable a higher level of efficiency in handling different types of cargo. Scale economies in hinterland transport are to be expected since higher volumes transported to and from the port means that transport providers can offer higher frequency services. Agglomeration effects refers to the benefits of concentrating many port-related activities and service providers in one location, which leads to an increased variety of logistics and other value-adding services. The points enumerated above show that there are general advantages of using large ports. But comparable advantages associated with the use of small ports are
also imaginable. Small ports typically have greater availability of land and lower land prices, whereas many large ports are in a situation where further landside expansion would be very costly and come at the expense of high-value residential property. This is related to Hayuth’s (1981) ‘peripheral port challenge’, which is the argument that as large load centres begin to lack space for future development and suffer congestion as a consequence, smaller ports are encouraged to attract cargo. Such a development can be expected to take place to the extent that it is beneficial for port users. Small ports can be attractive for resource industries – especially bulk cargoes that are less dependent on the clustered logistics services found in large ports. Small ports might also be able to offer better opportunities for tailor-made services, if suppliers and public authorities are willing to co-operate with shippers and cargo owners. If large ports have congestion issues, smaller ports with available capacity might also be able to provide more reliable services. Figure 4 illustrates the conventional way of thinking about the optimal size of ports. The long run average cost (LRAC) of port operations is the total cost of operations considered over a sufficiently long time period where all costs are variable, divided by the tonnage (t) handled in the port. The long run average cost of operations ought to be taken into account when deciding on scale and capacity, if the objective is to minimize costs. As can be seen from the figure, average costs are falling as capacity rises to the point where t=MES, which constitutes the minimum efficient scale. As capacity increased beyond the MES, there may be diseconomies of scale (curve labelled A) or constant returns to scale (curve labelled B). The ‘peripheral port challenge’ as discussed above, implies that there is indeed some point where diseconomies of size begin to set in, due to lack of space and high costs of expansion. The point where the long run average cost curves A and B begin to diverge is then the maximum efficient scale.
The minimum efficient scale of ports has important implications for whether a shift from larger to smaller ports is desirable from an economic perspective. If a large port has exhausted its scale economies and is located well above the point of MES, a diversion of cargo to a smaller port with unexploited scale economies will result in lower port costs in total. However, if the large port operates narrowly above or even below the point of MES, a diversion of cargo to a smaller port could result in significantly increased costs for all users in the larger port. Whether or not this increase in costs is offset by the cost reduction for users at the smaller port depends on the relative sizes of the two ports and the curvature of the average cost function.
Figure 4: The effect of scale on long run average costs of port operations It is important to note that the comparison of cargo handling cost per unit/tonne in small/large ports is only relevant if the same type of service is being compared. The port-related costs per tonne of cargo shipped through a large port on a deep-sea service are likely much greater than the per-tonne port-related costs of
shipping through a small port on a coastal/inland waterways service. In order to avoid pointless comparisons, it should be clarified that Figure 4 and the preceding discussion refers to the comparison of ports operating the same type of services. Since small and large ports typically offer different kinds of services, they are unlikely to be in direct competition. The role of small ports is to a large extent complementary to large ports: while large ports in the system can handle large deep-sea import and export volumes, small ports can be used for consolidating and de-consolidating/distributing volumes by sea instead of using land-based modes of transport. In this sense, small ports as a group are perhaps primarily in competition with land-based transport setups for the
consolidation/deconsolidation of cargo volumes.
In order to further explain the competition between maritime transport services transiting small ports versus land-based modes of transport, we can consider a hypothetical example. An international shipment of goods to be delivered at several destinations along the Swedish east coast can either be transported by sea to a large port in the south of Sweden and distributed to end locations by
road/rail or be transhipped at the port for further sea transport along the coast. Whether the second option can be competitive depends greatly on the volume of goods to be delivered to each location and the costs involved in calling at the local ports. If the pilotage fees, port charges, fairway dues or other port-related costs are high and the volume to be delivered is not sufficiently large, the per-tonne cost of the maritime option cannot compete with a land-based transport service.
Reducing the costs incurred on users calling at small ports could therefore potentially be an efficacious way of stimulating a modal shift from land. There could also be benefits for the rest of society associated with the use of smaller ports. One factor is that small ports (see Fig. 1) are mostly located outside of densely populated major urban centres, which means that impacts of air
pollution and noise on human health are smaller. Emissions to air in ports can be reduced by lessening the extent of laytime ships spend in ports, meaning that improving the rate of turnaround by ships in port could also lessen these negative impacts. Recent evidence (Rødseth et al., 2019) from Norway actually suggests that among the country’s 25 largest ports, smaller ports outperformed larger ports both in terms of technical efficiency of cargo handling and in environmental productivity, measured as tonnes of NOx emitted per tonne of cargo handled. Part of the explanation for the superior environmental productivity of several small Norwegian ports has to do with the fact that these ports operate mostly in the dry bulk segment, in which the carriers’ auxiliary engines were observed to cause relatively little emissions per hour and the cargo handling was not
particularly time intensive (Rødseth et al., 2019). However, part of the explanation was also that these smaller ports were found to operate with a higher level of technical efficiency. If some redistribution of flows from large to small ports was to lead to shortened time spent by ships in port and/or a reduction of air
pollutants emitted in high-density areas, this would be beneficial for society as a whole. Emissions to air in ports can also be reduced by the installation and use of shore power in ports, which could bring about significant societal benefits (e.g. Vaishnav et al., 2016)
Another possible benefit of increasing the use of small ports is that less
concentration in the port sector means improving the competitive intensity of the market. A possible effect of intensified inter-port competition could be increased pressures on ports and terminals operators to innovate and improve cargo
handling efficiency (Yuen et al., 2013; Merkel, 2018). Quantifying this effect is difficult and outside of the scope of the present study, but previous research suggests that there could be non-negligible efficiency improvements associated with intensified port competition.
The hypothesized potential for attracting traffic in small ports is primarily related to shifting freight movements from land-based modes of transport to sea. In such a scenario, the use of small ports does not necessarily involve diverting traffic from larger ports but rather that regional short-sea shipping replaces road or rail transport. In terms of CO2 emissions per unit of transport work, maritime transport has a general advantage over road transport (Sims et al., 2014). This environmental advantage of maritime transport depends on characteristics such as the size, speed and load factor of vessels. For bulk cargoes, the environmental advantage of maritime over road freight is greater than for e.g. Ro/Ro (Hjelle, 2010). For example, Vierth et al. (2019) studied the external costs of shipping an
annual volume of 120,000 twenty-foot equivalent unit (TEU) containers from the Swedish east coast to Hamburg either by a combination of rail to Gothenburg and by ship from Gothenburg to Hamburg or directly via local east coast ports by sea to Hamburg. It was found that after accounting for internalizing fees of either mode, the external costs of the direct shipping solution were higher. Shifting freight movements from rail to sea is unlikely to result in any emissions reduction but freeing up rail capacity could potentially lead to second-order reductions if this induces a shift of other cargo movements from road to rail.
Can the use of small ports be cost-effective? The literature overwhelmingly
suggests that there are economies of scale inherent in port operations. Most of the literature focused on finding the minimum efficient scale of port or terminal operations (e.g. Kaselimi et al., 2011; Seo and Park, 2016) has studied container terminal operations specifically. Seo and Park (2016) found that the minimum efficient scale in container terminal operations in South Korea is at least 700,000 twenty-foot equivalent unit (TEU) containers per year. This result, if transferred directly to the Swedish context, would imply that the size of the Swedish market for container shipments (1.6 million TEUs in 2018) is only large enough to
accommodate two container terminals operating with scale efficiency, and that the majority of ports handling containerized goods (all except Gothenburg) are
operating with unexploited economies of scale. The result is however not directly transferable to a Swedish context, since aspects of the cost structure differ and since the market is significantly smaller. As noted by Kasemili et al. (2011), the state of technology in cargo handling and the size of the market are factors which theoretically affect the minimum efficient scale. The presence of large (in relation to the size of the Swedish market) competitive container operations in ports such as Norrköping, Gävle and Helsingborg could in itself be an indication that the minimum efficient size might be significantly smaller than 700,000 TEUs. In addition to existing container ports, the port of Stockholm Norvik has
constructed a container terminal with a stated annual capacity of 500,000 TEUs, which is set to open its services in mid-2020. Even if the port of Norvik were to operate only at a 50 percent rate of capacity utilization, it would rival Helsingborg for the position of second largest container port in Sweden.
The minimum efficient scale of a port depends on the production technology employed in cargo handling, as well as the relative cost of capital, land and labour inputs. A production technology that is characterized by high fixed costs and low variable costs will tend to yield pronounced economies of scale and greater MES. This is typical of container handling, while the handling of other cargoes – e.g. Ro/Ro – is characterized by a less capital-intensive cost structure. Accordingly, a large share – roughly 85 percent – of containerized cargo is handled in the five largest container ports in Sweden (Gothenburg, Helsingborg, Gävle, Norrköping and Stockholm). This is in contrast with Ro/Ro cargo, where 70 percent of tonnage is handled in the five largest ports and bulk cargoes where the
corresponding figure is around 45 percent. Estimating the MES of Swedish ports in various cargo segments is a data intensive task that is outside the scope of this study, but it can be said in general that the question of whether small ports can provide cost-efficient services depends greatly on the type of cargo considered and the specialization of the port. Small ports are more likely to be viable for bulk and Ro/Ro shipments than for container operations.
The most important question related to a modal shift strategy is whether short-sea services calling at small ports can be competitive against land-based alternatives. As discussed above, small and large ports are complementary in the sense that cargo flows in large ports can be consolidated/de-consolidated along maritime feeder services calling at smaller ports. Whether such transport setups can be competitive against land-based feeder systems depends heavily on the costs involved in calling at small ports.
In summary, there is strong theoretical evidence to suggest that small ports may struggle to provide cost-effective cargo handling services, though the degree to which this is true depends on the type of cargo shipped. In the bulk and Ro/Ro segments, the difference in costs between using smaller or larger ports might be of lesser importance. In analysing the freight transport system in Norway, Marskar et al. (2015) found that port costs were mostly invariant with respect to scale. Costs associated with port operations must be analysed as part of total transport costs. At the same time, it must be considered that the use of smaller ports places restrictions on the size of vessel used for maritime transport. This is especially pertinent to the container segment, in which there has been a strong tendency towards the deployment of larger and larger vessels. The use of smaller ports might then lead to higher costs of transport overall.
3.2 Specific advantages and disadvantages of small ports in
Sweden
Port-related costs, which include fairway dues, pilot fees, stevedoring costs, port charges and time-related costs of turnaround, account for a significant share of the total transport costs of maritime services. In addition, accessibility (opening hours, hinterland connections) and flexibility (frequency of services, possibility of
meeting special handling requirements) are likely to affect port choice. In order to understand what might encourage or discourage the use of small ports in Sweden, we take a closer look in this section at the different costs involved in a port call. We can think about the determinants of port choice as being divided into a set of relevant factors:
The cost of pilot services is an important component. Pilotage is mandatory in designated areas for vessel sizes exceeding 70 meters in length, 14 meters in width or exceeding a draft of 4.5 meters. If the navigator onboard holds an exemption certificate issued by the Swedish Transport Agency, the ship can navigate without
pilotage in the specific area covered by the certificate. The cost of pilot services is structured as a two-part tariff: there is a fixed fee and a time-based fee, both of which are differentiated according to the ship’s net tonnage. Several smaller ports such as Karlstad, Kristinehamn, Köping, Västerås and Lidköping are located along the coasts of inland lakes and require time-consuming pilot-assisted navigation, which increases the total cost of calling at these ports. There are potential ways through which the costs of pilotage could be reduced. One such option is remote (or shore based) pilotage. This has been discussed in Sweden (SOU 2007:106) and could possibly serve as an alternative to onboard pilotage in ports and fairways that are relatively easy to maneuverer. Remote pilotage has been attempted in Finland and there have been proposals to further experiments with remote and automated pilotage (Vierth, 2018). On-site pilotage is however not likely to be replaced at all in the short term, and technological developments and trials related to remote pilotage should be viewed as an opportunity only in the longer term.
Fairway dues are charged by the Swedish Maritime Administration and are
differentiated according to a ship’s net tonnage, its environmental performance score on the Clean Shipping Index (CSI) as well as the volume and value of its payload. Sweden, along with Estonia and Finland, is one of the few countries in the European Union that charges fairway dues in addition to the charges levied by ports. Sweden is the only country that charges environmentally differentiated fairway dues. The structure of fairway dues affects the incentive to use small ports rather than consolidate goods volumes via road transport in large ports. Fairway dues are composed of two parts: a ship-related fee and a cargo-related fee. The ship-related fee is charged according to the size and environmental performance of a vessel, while the cargo-related fee is charged per tonne of cargo, with a higher charge levied on high-value goods. Since there is a fixed fee per port call, which is unrelated to the volume of cargo loaded/unloaded, there is a monetary incentive to reduce the number of port calls. It should however be noted that the cost of fairway dues is relatively small in relation to the total port-related monetary costs incurred on shipper in Sweden. According to a report by ISEA (2017), this share is 7-8 percent for Ro/Ro and Lo/Lo cargoes.
A significant cost item for port users is the port charge, which is levied by the port authority. The level and structure of port charges are decided by port authorities. A typical structure for port charges in Swedish ports (based on published tariffs and e-mail exchanges with a selection of ports) is to charge a vessel-related port fee based on the size of the ship in gross tonnage terms and occasionally differentiated according to the type of cargo carried and a separate fee for cargo handling related to the total volume and type of goods to be handled. There are other minor fees (such as mooring fees), but these constitute the two main charges. According to the information gathered from a selection of small, mid-sized and large ports in Sweden, there is no clear difference in terms of the structure and level of port charges found between smaller and larger ports.
However, it is important to add that the charges listed or stated by the ports might differ from those that are negotiated with shippers/carriers. According to ISEA (2017), Swedish port charges (vessel-related fees and cargo handling fees) account for as much as 80-83 percent of port-related monetary costs for Ro/Ro and Lo/Lo cargoes. The finding (based on a limited sample of ports) that port charges do not appear to differ between small and large ports is interesting and deserving of further analysis.
Another significant factor is the cost related to turnaround time. The total amount of waiting and service time (including pilotage) spent in a port comes at a cost to the shipper/cargo owner and plays a role in the choice of mode. Longer turnaround time in port will reduce the competitiveness of maritime transport in time-sensitive cargo segments. Improving time efficiency in ports has been shown to improve the competitiveness of short sea shipping (Suarez-Aleman et al., 2014) but gathering consistent data regarding vessel turnaround time often proves difficult. It can be done using positional ship data (AIS). This approach is time consuming and does not necessarily give sufficient information to determine the causes of long times spent in port, which makes comparisons between different ports difficult. For the purposes of this study, we have not been able to gather information about how turnaround times differ between ports, and therefore nothing explicit can be said about any existing differences between large and small Swedish ports.
The flexibility of services offered by a port is another important factor. Flexibility could be understood in a few different ways, one of which is frequency of ship departures. Maintaining a high service frequency hinges on attracting large enough volumes to fill ships on a regular basis. Because of this, larger ports are expected to be able to offer a higher frequency of departures than smaller ports, which could limit the attractiveness of small ports. This aspect relates only to liner shipping, where vessels operate on a fixed schedule. Another aspect of flexibility, more relevant to tramp shipping, is opening hours. According to contacts we have had with 9 sampled ports (3 of which are large, 3 which are in the mid-range of annual throughput and 3 of which are small), there are no obvious differences in terms of accessibility during different times of the day or week. Many ports
typically distinguish between regular opening hours (often 7-16) and hours outside these, during which higher rates are charged. There may be significant potential to improve the flexibility of port services through automation. The International Association of Ports and Harbors (IAPH, 2015) found that automation of
container terminals could lead to labour cost reductions of up to 30 percent, while also improving safety. While the process of automating cargo handling in Sweden could potentially both reduce labour costs and increase productivity, it is typically seen as requiring a large scale of operations in order to be profitable (Transport Analysis, 2019b). Automation of cargo handling services could perhaps be promising in Swedish ports which handle large amounts of homogenous cargo.
Fully automated terminals, where unmanned cranes are able to operate 24 hours a day, would bring significant benefits to shippers in terms of flexibility. However, due to the scale of operations required to justify an investment in such technology, it is unlikely that this development will benefit small ports directly.
3.3 Characteristics of maritime transport services using small
ports
The type of maritime services that are operated using small ports can typically be characterized as short-sea shipping (SSS), meaning maritime transport taking place over shorter distances. The orientation of a short-sea service is either set up as a) a regional loop, b) a feeder service or c) a point-to-point service (Rodrigue et al., 2017). A regional loop is characterized by a fixed schedule of service calling at several ports with a relatively low frequency of departure. Regional loops are often utilized for intra-corporation cargo shipments or other maritime trade within a region. The types of cargo typically shipped in regional loop services are
containerized goods, break bulk or Ro/Ro cargo. This type of service is generally in direct competition with road and rail transport, which makes the issue of port performance, both in terms of cost and turnaround time, especially crucial for maritime transport to be a viable alternative. These services require ports along the loop to be equipped with shore-side cranes (in the case of Lo/Lo cargo operations), warehouses and areas for cargo storage.
A feeder service is utilized to move cargo to/from transhipment ports that operate deep sea services. In Sweden, container feeder services to Gothenburg or other large transhipment hubs in continental Europe (e.g. Hamburg) are utilized. The main market for feeder services is containerized cargo. A feeder service competes either with land-based modes of transport such as in the case where cargo is moved from inland locations to the port of Gothenburg, or with direct deep sea services, when a smaller port has the option of either transporting cargo directly or feedering through an intermediary hub. The frequency of service matches that of the deep-sea shipping line schedule. Feeder services are typical in the container shipping market and ports functioning as feeder ports need to be equipped with shore-side cranes and areas for container storage.
The operation of maritime feeder services illustrates how small and large ports can serve complementary roles in the transport system. A currently relevant example of this is the co-operation agreement entered into by the Ports of Stockholm and Mälarhamnar (Ports of Lake Mälaren). The new port site just south of Stockholm, Norvik, is set to open during 2020 and serve as a shipping hub for container and Ro/Ro traffic. The agreement between the port organizations is to work towards facilitating inland barge transport between the port of Norvik and inland ports around Mälaren (Ports of Stockholm, 2020).
Point-to-point services operate on a fixed schedule with high frequency. A typical example is a ferry service, where trucks and trailers are shipped. The combined
carriage of passengers and goods makes these services especially useful in links with a frequent and high demand for passenger transport, such as Helsingborg – Helsingör. Ferry services are typically in competition with road transport, which is also the case for the most heavily utilized ferry links in southern Sweden. This type of service requires very little in terms of port infrastructure: if vessels have self-sustaining ramps the port only needs to provide appropriate quays.
Figure 5: Short-sea shipping service setups suitable for the utilization of small ports in Sweden. Partly adapted from Robinson (1998).
The types of services that are considered of primary importance in this study are regional loops and feeder services. The reason is that these services compete with land-based modes of transport to a significant degree and that there may be potential to shift cargo volumes currently transported via land towards these services through the implementation of policies that favour the use of smaller ports. Using regional loop services, companies that ship internal cargo volumes between locations with coastal access can replace land-based transport solutions with frequent ship departures calling at a set of local ports. An example of a company in such a position is SCA, whose production sites in Sweden are mostly located along the northeast coast. SCAs internal goods volumes of forestry
products amount to millions of tonnes each year, and there could be a potential to shift a significant amount of these volumes from rail to sea. In terms of feeder services, the port of Gothenburg maintains a land-based transport network that allows the consolidation/deconsolidation of cargo volumes from/to at least 20 inland locations all around the country, several of which have coastal access and could potentially be served by maritime feeder services given improvements in the cost and time performance of local ports. Figure 5 illustrates visually the
3.4 Policies for competitive small and peripheral ports in other
countries
Targeting policy towards the competitiveness of small and peripheral ports appears to be quite rare in an international context. However, there are examples of port policy frameworks that indirectly support the use of small ports. In Norway, the Ports and Fairways Act from 2009 stipulated that all port capital (which includes revenues from port services, land rents and any port assets) could only be used for the purpose of port development. Most ports in Norway are municipality-owned and this regulation meant that any financial returns on port operations are cut off from other areas of municipalities’ business (Merkel and Munim, forthcoming). This regulation had two likely consequences. Firstly, it reduced the incentive for ports to charge at a premium in order to finance other municipality undertakings. Secondly, it made disinvestment in port capacity difficult and reduced the possibilities for consolidating capacity in fewer locations in order to benefit from economies of scale. The regulation was argued to be economically inefficient (NOU 2018:4) but it was also argued that the regulation contributed to maintaining a geographically dispersed and diversified supply of port services (Marskar et al., 2015). The Port and Fairways Act has since been revised and as of 2020, municipalities are free to use port capital for other purposes, provided that they have allocated sufficient funds for the cost of port operations, maintenance and necessary investments.
The port system of Finland also comprises many small and peripheral ports. According to Rönty et al. (2011), ports are increasingly co-operating in terms of sales and marketing in order to secure common regional interests. Rönty et al. (2011) also propose that increased co-operation and even mergers of ports would be beneficial to the efficiency of the port sector. However, they do not foresee the number of physical ports actually being reduced in the future.
Merging ports may be one way to solve problems related to the inefficiency of small-scale operations. The ports of Malmö and Copenhagen, which merged in 2001 following the establishment of the Öresund fixed link, are an example often mentioned in the literature. Heaver et al. (2001) note that mergers or other more flexible forms of co-operation between small ports may create efficiencies through improved economies of scale and scope, though it is important to also take into account the fact that competition for port services suffers as a consequence. For small ports, mergers or other forms of co-operation are less likely to be viewed as anti-competitive practice compared to if this was done by large ports.
Another form of co-operation can be seen in the Italian port reform approved in 2016, which established a governance mechanism of so-called port system
authorities (PSAs). The previous 24 port authorities were replaced by 15 PSAs, whose role is to co-ordinate the operations of several proximate ports. A
according to Parola et al. (2017), a rationalization of small ports. The outcomes of the reform in terms of port concentration have, to the best of the authors’
4. Methodology
The question of what types of improvement in small ports could induce a modal shift from land to sea is investigated in the remainder of this study. In order to answer this question, we simulate the effect of various policies aimed to improve the competitiveness of maritime freight transport as a modal alternative or to improve the competitiveness of small ports specifically. An important question is how to classify ports by size. This is addressed in the following subsection. In the remainder of the methodology section, we outline the policy scenarios to be simulated and provide a description of the Samgods model used for simulation.
4.1 Classifying ports by size: What is a “small” port in Sweden?
Classifying ports by size is complicated. While annual throughput (i.e. the amount of cargo that passes through a port during a year) is a standard measure, there are also other dimensions that could be considered. In terms of throughput, Table 1 shows that out of 38 port authorities, 23 had less than 2 million tonnes of
throughput in 2018. 13 port authorities had less than 1 million tonnes. Exactly where to draw the line regarding size is difficult. Some (e.g. de Langen, 1998) argue that focusing only on throughput as a measure of size is too narrow.
However, when a classification of ports according to size is absolutely necessary it is difficult to motivate any other method. This issue is discussed in the European Seaports Organisation’s (ESPO) fact finding report (Verhoeven, 2011), where the chosen method is to classify ports by annual throughput.
Another important aspect of size is infrastructure capacity. Out of the 38 port authorities listed in Table 1, 10 have a maximum allowed draft below 8.7 meters, which means that an average 1,000 TEU container ship cannot enter (Monios, 2017). This shows that the current state of infrastructure in some ports is likely insufficient to serve container traffic on feeder lines. However, except for ferry ports such as Ystad and Trelleborg, most ports that suffer from draft restrictions are also those that would be categorized as small in terms of throughput. A notable case is Vänerhamnar, whose access is restricted by the dimensions of Trollhätte Canal. The maximum dimensions of so-called Vänermax vessels is 88 meters in length, 13.20 meters in width and 5.40 meters in depth.
The European Union strives in its transport policy for economic, social and territorial cohesion. A specific policy aimed at achieving these objectives is the development of the Trans-European Transport Network (TEN-T) (European Union, 2017a). Routes and nodes in the TEN-T are classified as belonging to the
comprehensive network, which covers all European regions, or the core network,
which constitutes the backbone of the multimodal transport network and connects the most important points of the TEN-T. As part of this policy, 329 ports are included as nodes in either the comprehensive or the core network. This designation is relevant since ports belonging to the core or comprehensive
provision of port services and common rules on the financial transparency of ports (European Union, 2017b) and since TEN-T ports are eligible for targeted EU funding. As can be seen from Table 1, 5 ports included in the list are classified as ‘core’ nodes and 13 are classified as ‘comprehensive’. The ports which are classified as ‘core’ are easily definable as large ports by other metrics, such as throughput. However, there are some ports (e.g. Oskarshamn) that belong to the comprehensive network despite being small in terms of throughput.
While there are different metrics by which to classify the size of ports, throughput is a simple and transparent measure that is also highly correlated with other
measures. Ports with larger throughput tend to be those with greater infrastructure dimensions and, notwithstanding a few exceptions, those that are classified as ‘core’ or ‘comprehensive’ in the TEN-T. The specific distinction chosen in this study is to classify ports with an annual throughput of less than 2 million tonnes as small. The annual throughput values used for this classification are those in the base year of the Samgods model, which are the result of calibration using port traffic data from 2017. This means that there is not an exact correspondence between the port throughput listed in Table 1 and the values used for
classification. Out of the 73 ports with throughput volumes larger than 0 in the Samgods modelling system, 53 are classified as small. A small port, using this definition handles an amount equal to or less than roughly 1 percent of total throughput in the Swedish port system. To put this in perspective, the ESPO (Verhoeven, 2011) classified any port with an annual volume of less than 10 million tonnes as small. Using the same definition in this report would lead to almost every port being classified as small. It is therefore clear that a smaller cut-off value is required to account for the fact that the size of the Swedish transport market is significantly smaller.
4.2 Policy scenarios to support the use of small ports
Reducing maritime transport costs
Our first policy scenario considers the effect of reducing the underway transport costs of shipping by sea. Transport costs in the Samgods model are composed of underway costs, which include time- and distance related cost components, transfer costs at nodes/terminals, fairway dues and positioning costs (relevant for bulk vessels only). The policy scenario described in this section is designed to only reduce the distance and time-related costs of transport underway, i.e. costs related to port charges, fairway dues or positioning are left unchanged.
Reducing maritime transport costs approximates typical subsidization policies that have been in place at the EU level in order to shift cargo from road to sea. The previous funding programs Pilot Action for Combined Transport (PACT), Marco Polo I and Marco Polo II are examples of such policies. The Marco Polo
programs, which superseded PACT in 2001, were designed to encourage rail, inland waterway and sea transport through co-funding (in the form of an outright