A CASE STUDY ABOUT THE
POTENTIAL OF BATTERY STORAGE
IN CULTURE HOUSE
Investigation on the economic viability of battery energy storage system with peak
shaving & time-of-use application for culture house in Skellefteå.
BALJOT SINGH
School of Business, Society and Engineering Course: Degree Project in Energy
Engineering
Course code: ERA403 Credits: 30 hp
Program: Master of Science in Engineering - Energy Systems
Supervisor at Mälardalens University: Amir Vadiee and Erik Dahlquist
Supervisor at ABB: Mikael Miglis Examiner: Pietro Campana Date: 2021-01-14
E-mail:
i
ABSTRACT
The energy demand is steadily increasing, and the electricity sector is undergoing a severe change in this decade. The primary drivers, such as the need to decarbonize the power industry and megatrends for more distributed and renewable systems, are resulting in revolutionary changes in our lifestyle and industry. The power grid cannot be easily or quickly be upgraded, as investment decisions, construction approvals, and payback time are the main factors to consider. Therefore, new technology, energy storage, tariff reform, and new business models are rapidly changing and challenging the conventional industry. In recent times, industrial peak shaving application has sparked an increased interest in battery energy storage system (BESS).
This work investigated BESS’s potential from peak shaving and Time-of-use (TOU) applications for a Culture-house in Skellefteå. Available literature provides the knowledge of various BESS applications, tariff systems, and how battery degradation functions. The predicted electrical load demand of the culture-house for 2019 is obtained from a consultant company Incoord. The linear optimization was implemented in MATLAB using optimproblem function to perform peak shaving and time-of-use application for the Culture-hose BESS. A cost-optimal charging/discharging strategy was derived through an optimization algorithm by analyzing the culture-house electrical demand and Skellefteå Kraft billing system. The decisional variable decides when to charge/discharge the battery for minimum battery degradation and electricity purchase charges from the grid.
Techno-economic viability is analyzed from BESS investment cost, peak-power tariff, battery lifespan, and batter aging perspective. Results indicate that the current BESS price and peak-power tariff of Skellefteå Kraft are not suitable for peak shaving. Electricity bill saving is too low to consider TOU application due to high battery degradation. However, combining peak shaving & TOU does generate more profit annually due to additional savings from the electricity bill. However, including TOU also leads to higher battery degradation, making it not currently a viable application. A future scenario suggests a decrease in investment cost, resulting in a shorter payback period.
The case study also analyses the potential in the second-life battery, where they are purchased at 80 % State of Health (SoH) for peak shaving application. Second-life batteries are assumed to last until 70 % or 60 % before End of Life (EOL). The benefit-cost ratio indicates that second-life batteries are an attractive investment if batteries can perform until 60% end of second-life, it would be an excellent investment from an economic and sustainability perspective. Future work suggests integrating more BESS applications into the model to make BESS an economically viable project.
Keywords: Battery energy storage system, power grid, peak shaving, time-of-use, tariff system, battery aging, state of health, and second-life batteries.
ii
PREFACE
This study is a thesis project for Master of Science in Engineering Energy System at Mälardalens University in Västerås Sweden, by Baljot Singh. The work’s idealistic objective is to contribute to the advancement of Battery application for a sustainable society.
I am thankful to ABB for allowing me to perform a master thesis on a very relevant and important topic for sustainable developing building and cities. I want to express my gratitude to my supervisors Mikael Miglis from ABB for his guidance, Amir Vadiee, and Erik Dahlquist, my supervisors from Mälardalens University. Special thanks to Patrik Sundberg from Skellefteå Kraft, Elias Afeiche from Northvolt, and Rodrigo Castro Martin battery management system specialist from Canada. Finally, I would like to thank my examiner at Mälardalens University, Pietro Campana, for his feedback and support.
Special thanks to my family, friends, and especially Anukool and Ziad, who have supported me throughout this project and kept pushing me during the testing times.
Västerås, Sweden, 2021 Baljot Singh
iii
SUMMARY
The increase in energy demand and climate change pushes industries to produce energy in an environmentally friendly way. The grid operators face problems of not being able to supply effect at certain peak hours when required. The grid system cannot be easily or quickly upgraded, as many factors come into play. Therefore, the customers have to pay additional charges to purchase electricity at certain hours of the day. Therefore, renewable energy, energy storage, tariff reforms, and new business models are rapidly changing and challenging the conventional industry. Energy storage is an essential requirement of the conventional electricity generation industry, distributed energy domain, and intermittent renewable energy supply systems. The battery storage system has high efficiency, and by peak shaving and load leveling, it avoids investing in expanding power plants and overall economic decline when the generator is idle. The battery storage forecast shows a significant increase by 2030 due to millions of electric vehicles that will hit the road, and the price will decrease by 300 % by 2030. The work investigated to see BESS’s economic viability from peak shaving and TOU application for Culture-house in Skellefteå. Available literature provides the knowledge of various BESS applications, tariff systems, and how battery degradation functions.
Tariff charges of Skellefteå Kraft are categorized into monthly effect charges and electricity purchase charges. There are two kinds of monthly effect charges base charge and an additional high load charge. The base charges occur for all 12 months in a year, and high load charges occur for 5 months during winter. Peak shaving reduces both base and additional high charges on a monthly basis, and TOU reduces electricity purchase charges. Battery deterioration has a considerable impact on economic viability. Battery degradation, in general, is very complex. However, through linear equations, it is easier to include battery degradation into the model. Battery degradation is divided into two-part, calendric aging and cycling aging. The battery is expected to last in 70 % SoH before it needs to be replaced.
After the literature study on the different methods to optimize BESS, linear optimization seemed to be the most suitable and simplified approach for this culture-house case. The linear optimization was implemented in MATLAB using the optimproblem function to perform peak shaving and time-of-use application for the Culture-hose BESS. The linear optimization goal is to minimize the overall cost, where two types of expenses are considered: the energy cost and the degradation cost. A cost-optimal charging/discharging strategy was derived by analyzing the culture-house electrical demand and Skellefteå Kraft billing system through an optimization algorithm.
To showcase the result in the best way possible, two different cases are compared. In case 1, only peak shaving is implemented. In case 2, both peak shaving and TOU are implemented for a 264-kWh battery and 75 kW inverter. Techno-economic viability is analyzed from BESS investment cost, peak-power tariff, battery lifespan, and batter aging perspective for both cases. Results show that combining peak shaving & TOU does generate more profit annually due to additional savings from the electricity bill. But the inclusion of TOU leads to a higher degradation of the battery. Therefore, peak shaving alone is a better option. A study on different peak thresholds and their recommended BESS size is also performed, and the results indicate that 5 % peaks shave threshold is ideal with the shortest payback period of 29 years. In general, the results indicate that the current BESS price and peak-power tariff of Skellefteå Kraft are not suitable for peak shaving. A future scenario suggests a decrease in investment cost, resulting in a shorter payback period. If Skellefteå Kraft were to include additional peak charges for all 12 months and not only five months in winter, that would shorten the payback period.
iv
The case study also analyses the potential in the second-life battery, where they are purchased at 80 % State of Health (SoH) for peak shaving application. It is assumed that the second life battery will also have linear degradation for the study’s simplicity. There are 2 cases studied, where the battery last until 70 % in case 1, and 60 % in case 2 before EOL. The results indicate that second-life battery is not an attractive investment through cost benefit-ratio method if the second-life battery’s EOL is only 70 % SoH. The benefit-cost ratio indicates that second-life batteries are an attractive investment if batteries can perform until 60% end of life, it would be an excellent investment from an economic and sustainability perspective.
Future work suggests integrating more BESS applications into the model to make BESS an economically viable project. Applications such as frequency regulation and increased PV self-consumption can be included. Future research comparing different tariff systems from various regions of Sweden could be performed to get a better overview.
CONTENT
1 INTRODUCTION ...5
1.1 Background ... 5
1.1.1 Lithium-ion battery demand and price forecast ... 6
1.1.2 Basic terminology ... 7 1.1.3 Tariff charges ... 7 1.1.4 2nd life battery ... 8 1.2 Problem statement ... 8 1.3 Purpose ... 9 1.4 Delimitation ... 9 2 METHOD ... 10 3 LITERATURE STUDY ... 11
3.1 Battery storage technologies ...11
3.2 Battery energy storage services ...12
3.2.1 Battery storage for ISO/RTO services ...13
3.2.2 Battery storage for Utility services ...14
3.2.3 Battery storage for customer services ...14
3.3 Peak Shaving ...15
3.3.1 Peak shaving benefits for the grid operator. ...16
3.3.2 Benefits for end-user ...16
3.4 Previous studies on battery storage systems ...16
3.4.1 Approaches implemented to optimize BESS ...17
3.5 Battery aging ...19
4 CURRENT STUDY ... 23
4.1 Analyzing the predicted electrical demand ...23
4.1.1 Predicted electrical consumption data for 2019 ...23
4.2 Tariff calculations ...25
4.2.1 Determine monthly effect charges ...25
4.2.2 Determine the electricity purchase price...27
4.3 BESS technical information and cost ...28
4.4 Linear optimization of BESS ...29
5 RESULTS ... 33
5.1.1 Peak shaving simulation overview...33
5.2 Economic and degradation analysis ...35 5.2.1 Scenario 1 ...35 5.2.1.1. Scenario 1, case 1 ... 35 5.2.1.2. Scenario 1, case 2 ... 36 5.2.2 Scenario 2 ...37 5.2.2.1. Scenario 2, case 1 ... 37 5.2.2.2. Scenario 2, case 2 ... 38
5.3 Recommended BESS sizing according to Peak threshold ...39
5.4 Sensitivity Analysis ...40
6 DISCUSSION... 42
6.1.1 Model ...42
6.1.2 Discussion on simulation results and economics ...43
6.1.3 Discussion about the degradation of the battery ...44
6.1.4 Discussion on second-life battery ...44
7 CONCLUSIONS ... 45
8 SUGGESTIONS FOR FURTHER WORK ... 46
BIBLIOGRAPHY ... 47
LIST OF FIGURES
Figure 1 Battery blastoff until 2030 (Stubbe, 2018) ... 6Figure 2 Lithium-ion battery price forecast (Logan Goldie Scot, 2019) ... 7
Figure 3 Culture house (Skellefteå Cultural Centre, 2020) ... 8
Figure 4 Schematic of BESS (Akhil et al., 2013) ...12
Figure 5 BESS connected to the grid (Martins et al., 2018) ...12
Figure 6 Battery services (Garrett Fitzgerald et al., 2015) ... 13
Figure 7 Peak shaving strategy (Mehr et al., 2013) ... 15
Figure 8 Methodology proposed for sizing of BESS (Rahmann et al., 2017)... 17
Figure 9 Stress factors influence on the lifetime of Li-ion battery (Stroe et al., 2014) ...19
Figure 10 Calendric linearization (Martins, Musilek, et al., 2018) ...21
Figure 11 factors affecting cyclic aging model (Martins, Musilek, et al., 2018) ...21
Figure 12 Yearly electrical consumption data ... 23
Figure 13 Electrical demand of January ... 24
Figure 14 Electrical demand for June ... 24
Figure 15 Electrical demand for one day ... 25
Figure 16 Electricity price on an hourly basis (Nordpool Price, 2019) ... 27
Figure 17 Load before and after peak-shave ... 33
Figure 18 Load after peak shave & TOU ... 34
Figure 19 Scenario 1, case 1, cost-saving results from peak-shaving ... 35
Figure 20 Scenario 1, case 2, cost-saving results from peak shave & TOU ... 36
Figure 21 Scenario 2, case 1, cost-saving results from peak shave... 37
LIST OF TABLES
Table 1 Advantage and disadvantages of Li-ion battery (Fan et al., 2019) ... 11
Table 2 Electrical consumption department ... 23
Table 3 Monthly effect charges (Elnätspriser, 2019) ... 25
Table 4 Effect charges for Culture-house ... 26
Table 5 Electricity purchase charges (Elnätspriser, 2019) ... 27
Table 6 BESS performance parameters and price information (Mongird et al., 2019; Tsiropoulos I et al., 2018) ... 29
Table 7 Variables and parameter used for battery modeling and optimization routines ... 29
Table 8 Scenario 2, BESS size and cost (Mongird et al., 2019) ... 37
Table 9 Scenario 2, case 1, economic analysis ... 38
Table 10 Scenario 2, case 2, economic analysis ... 39
Table 11 Recommended BESS size ... 39
Table 12 Future economic analysis (Logan Goldie Scot, 2019; Mongird et al., 2019) ... 40
Table 13 Second life battery economic analysis ... 40
NOMENCLATURE
Symbol Description Unit
Cbatt Energy related cost of storage SEK/Wh
CPCS Power conversion system cost SEK/Wh
Cstorage Total cost of battery storage SEK
Ebattnom Nominal size of the battery Wh
Ebatt Battery energy content Wh
ηinv Inverter efficiency %
ηbatt Battery efficiency %
Pinvnom Nominal size of the inverter W
𝑃𝑙𝑜𝑎𝑑 Predicted Electrical demand Wh
𝑃𝑔𝑟𝑖𝑑−𝑏𝑎𝑡𝑡 Power flow from grid to battery W
𝑃𝑏𝑎𝑡𝑡−𝑙𝑜𝑎𝑑 Power flow from battery to load W
𝑃grid−𝑙𝑜𝑎𝑑 Power flow from the grid to load W
ABBREVIATIONS AND TERMS
Abbreviation Description
BESS Battery Energy Storage System
BOP Balance of Plant
C&C Construction and commissioning
DOD Depth of discharge
EV Electric vehicle
FEC Full Equivalent Cycle
GHG Greenhouse gas
HVAC Heating, Ventilation, and Air Conditioning LMP Locational Marginal Price
IRR Internal Rate of Return
NPV Net present value
PSB Polysulfide bromine
PV Photovoltaic
SOC State of Charge
SOH State of Health
SD Self-discharge
TOU Time of Use
1
INTRODUCTION
The world is undergoing two major interrelated problems, which are energy demand and climate change. The majority of the current energy demand (>85%) relies on fossil fuels, which in turn, is the primary source of greenhouse gas (GHG) emissions (Khalilpour & Vassallo, 2016). But the energy demand is also steadily increasing, mainly from societies that did not have access to electricity before but now have it for the first time. The electricity sector is going through a severe change in this decade (Zhang et al., 2018). The primary drivers, such as the need to decarbonize the power industry and megatrends for more distributed and renewable systems, are resulting in revolutionary changes in our lifestyle and industry (Kumar et al., 2017). Furthermore, the authors state that a lack of power in significant parts of the population of India, Africa, and certain parts of Asia has led to new distributed power generation technologies and newer ways of providing power to the local communities and industry. Society requires additional energy for development, but the GHGs and other pollution generated from energy sources can significantly damage our society. After a few decades of investigation, Khalilpour and Vassallo (2016), mention three main pillars for sustainable energy policy: efficiency improvement, replacement of fossil fuels with renewable sources, and capturing and storing CO2. The way to address these three pillars by the electrical industry is through smart networks or a grid. The electrical market structure ensures a level of competition, where the goal is to have low-cost generators. Generation and distribution assets have a very long-life span and require long payback time, often 40 years or more. The system cannot easily or quickly be upgraded, as investment decisions, construction approvals, and payback times are the main factors for long operational life. However, it is all changing now with the pace the industry is evolving. Local generations, new technology, energy storage, tariff reform, and new business models are rapidly changing and challenging the conventional industry. But from a technology perspective, the two main strong drivers for change in the electricity industry are low-cost renewable power generation and increased battery energy storage systems (Khalilpour & Vassallo, 2016). The fluctuation in the production of renewable energy technologies is inevitable, and therefore storage is a crucial factor for power and voltage smoothing (Ellabban et al., 2014). To address environmental issues, sustainable development is essential, and green energy resources will play a crucial role (Kumar et al., 2017).
The majority of traditional energy storage technologies typically have low energy efficiency. They also require huge capital investment and have location-dependent problems (Argyrou et al., 2018). Batteries have a long lifetime, high power, energy efficiency, and low investment cost compared to other electrical energy storage (ESS) technology. Batteries can be distributed throughout the grid, and these capabilities make batteries desirable for utilization in the grid-scale energy storage system (Pasta et al., 2012).
The power networks face great challenges to meet demand with unpredictable daily and seasonal variations. EES technology is recognized to have great potential in meeting those challenges. However, there are many options and complex characteristics in EES. It is difficult to use a specific ESS technology for a particular application (Luo et al., 2015).
1.1
Background
This section provides background information about the project and information about battery energy storage technology from a customer service perspective. The overview and schematic of BESS connected to the electrical power grid are described. A summary of the lithium-ion battery is given, where the advantages and disadvantages of li-ion batteries are discussed.
The energy storage system is necessary for energy management, frequency regulation, load leveling, peak shaving, seasonal storage, and standby generation. Therefore, storage technology has gained attention and is becoming a necessity (Ellabban et al., 2014). ESS is a crucial requirement of the conventional electricity generation industry, distributed energy domain, and intermittent renewable energy supply systems (Chen et al., 2009).
Most of the electricity transmission and distribution system operate for one-way transportation, which means that electricity is produced by the supplier and is directly transported from remote and large power plants to consumers. The drawback with this method is that amount of electricity produced needs to be used almost immediately. However, electricity demand varies greatly depending on emergent, daily, and seasonal needs. The maximum demand usually only lasts for some hours each year, leading to ineffective, over-sized, and expensive plants. However, by having large-scale electricity storage capacity available, the plant does not have to be built according to peak demand but instead built to meet the average electrical need (Van der Linden, 2006). Installation of BESS for peak shaving and load leveling also avoids investing in expanding power plants and the overall economic decline when the generator is idle (Lazarewicz & Rojas, 2004). The battery technology improvements have occurred in recent years, and by following this trend, a continual cost reduction can be expected periodically. Simultaneously the rapid increase in electric vehicles is happening, especially in Chines and US markets. Millions of lithium-ion batteries for EV will be deemed unsuitable for the transport sector after reaction a certain amount of degradation. An overview of current and future battery demand is shown in the next section (Mathews et al., 2020).
1.1.1
Lithium-ion battery demand and price forecast
The global battery price has fallen by 85 % since 2010. The battery storage forecast is likely to be at 14 times its current level by 2030. This staggering increase can be attributed to the millions of electric vehicles that will hit the road, as shown in Figure 1 (Stubbe, 2018).
Figure 1 Battery blastoff until 2030 (Stubbe, 2018)
Figure 1 shows that most of the battery storage increase will be from electric vehicles, but there is also an increase in consumer electronic and stationary storage. The rise of electric cars is also forcing the makers of the batteries to bring down the prices.
It is also important to analyze the battery price survey results yearly and see how the trend is going. Since 2010 Logan Goldie Scot. (2019), has been publishing the battery price survey
results yearly. It has become an essential benchmark in the industry, and the fall in price is extraordinary.
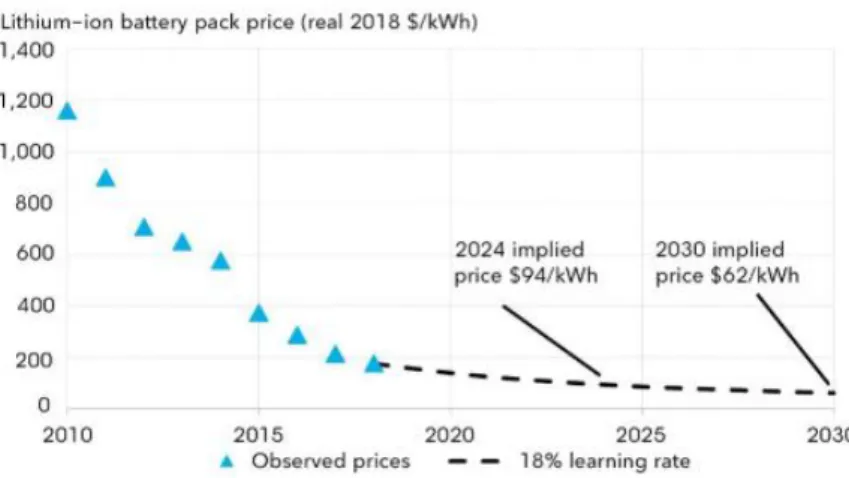
Figure 2 Lithium-ion battery price forecast (Logan Goldie Scot, 2019)
Figure 2 shows the current and future trends of lithium-ion battery price packs every year. The volume-weighted average battery pack has fallen by 85 % from 2010-2018, reaching an average price of $176/kWh in 2018. By looking at the future forecast, the lithium-ion battery pack price will be $94/kWh by 2024 and low as $62/kWh by 2030 (Logan Goldie Scot, 2019). Keep in mind that this is the average price, and the price could vary from company to company.
1.1.2
Basic terminology
There is some basic terminology for the battery: state of charge, depth of discharge, charge/discharge, state of health, and cycle. State of Charge (SOC) defines the ratio between the amount of energy stored in the battery to the amount of fully charged battery. The depth of discharge tells how much the battery can be discharged. The charge and discharge rates describe how quickly the battery can be charged and discharged within one hour and has the unit kW. State of health (SoH) represents the allowable present fraction of performance deterioration remaining. Where SoH = 100 %, is at the beginning of life and 70% at the end of life. Every battery has a limited number of cycles in its lifetime, which means a sequence of charges followed by discharge or discharge followed by a charge under specified conditions.
1.1.3
Tariff charges
The customer pays for electricity connection via the utility company, of which utility company keeps a small profit to cover for the generation and retail costs. Three main electrical grid charges which a customer pays for (Martins, Hesse, et al., 2018; Tariff/Charges, 2020):
• Fixed charge
- The fixed charge is usually SEK/year or SEK/month, depending on the utility. Charges depend on the specific cost per customer and the ground cost for the network. The fixed cost also depends on if the connection is low or high voltage.
• Monthly max effects charges:
- Utilities charge the customer for the highest hourly power consumed every month in SEK/kW, and the price of kW varies on each utility tariff system. Usually, the cost varies depending on the corresponding billing period, connected voltage level, distribution system operator.
• Electricity cost
- The electricity cost is in SEK/kWh and includes spot price from Nordpool, the profit margin for utility, energy tax, and transportation cost (varies in on/off-peak hours).
1.1.4
2
ndlife battery
It is expected that GWHs of second-life batteries are expected to be available in the coming years (Martinez-Laserna et al., 2018). A study by Mathews et al. (2020), performs a techno-economic model of second-life batteries for utility-scale solar while also considering calendar and cyclic aging. An increase in EV will also lead to millions of batteries that will no longer be suitable for the transport sector after reaching 80% of degradation. The batteries can be utilized for new applications, increasing a battery’s lifetime value, and postponing the cost of recycling, and provide environmental benefits by reducing resource use. Battery life is assumed to reach 70% or 60% before the end of life (EOL). The study compares a new battery vs second life battery for the PV plant application. The results show that a second-life battery can be economically viable when the price is 50% less than a new battery, and the battery can last to 60% SoH (Mathews et al., 2020).
1.2
Problem statement
Skellefteå municipality is building a culture house, which will be finished by 2021. Skellefteå Kraft is an electricity distribution utility that will provide the culture house with electricity.
Figure 3 Culture house (Skellefteå Cultural Centre, 2020)
Figure 3 presents the culture house image, which will consist of 25000 m2 area where 15000
m2 is for cultural activities, and 10000 m2 is for the hotel. Overall, the culture house has20
floors and 205 hotel rooms, several scenes, and it will be a new meeting place in the country. The culture house will have a theatre, art gallery, city library, and a museum. The main goal is to have an energy-efficient building, sustainable, and environmentally friendly.
There will be many different activities/events occurring all around the year. The hotel guest occupancy might increase for some specific days, and concert events will occur in the culture house. During those events, the power demand can increase significantly and affect the power
peak charges. Skellefteå Kraft, in collaboration with Northvolt and ABB, has decided to install a lithium-ion battery pack of size 564 kWh and inverter size of 500 kW. However, 300 kWh is backup for the water pump in case of emergency fire, and the remaining 264 kWh is applicable for other applications as load shifting with heat pump, peak shaving, time-of-use, and frequency regulation. Therefore, the project’s main aim for both involved industrial partners, ABB and Skellefteå Kraft is to perform economic viability on installing BESS in culture house from a peak shaving and time-of-use perspective.
1.3
Purpose
This master’s thesis work’s primary purpose is to identify a methodology to optimize the battery’s power flow from peak shaving and time of use perspective. The goal is to cut down the energy consumption peaks every month with BESS and perform economic viability analysis.
Research questions
1. Which applications and benefits can BESS have for the culture house? 2. What is the optimal peak shaving threshold for BESS’s economic benefit?
3. How do peak shaving and time-of-use applications affect the degradation of the battery?
4. Which parameters are the most important when it comes to making BESS economically viable?
5. What is the potential of investing in second life battery from peak shaving perspective?
1.4
Delimitation
The input data is limited to the electrical demand data given by Incoord for 2019. The data is used as an input value into the MATLAB model and is not modified.
There are many applications that a battery can offer, but this study is limited to peak shaving and time-of-use. Northvolt has provided battery-related information. Northvolt has already chosen the Li-ion battery. Therefore, no research will be performed on other battery technologies. In this case study, the operation and maintenance costs are neglected.
2
METHOD
The literature review aimed to gain a better understanding of BESS applications and how the tariff system works. Information about peak shaving, time-of-use, battery degradation, and previous studies within the BESS to determine optimization methodology is provided in section 3.
Based on the literature review, the current study was performed for the culture house case in section 4. The optimization methodology is applied in MATLAB. Technical details about the model, assumptions, and used formulas are explained in section 4,4.
The structure of the study is broken down into the following steps:
1. A literature review is provided on the theoretical background of battery energy storage, tariff system, peak shaving, battery degradation. Literature also includes previous studies on vari0us approaches to optimize the BESS from peak shaving and TOU perspective.
2. Then optimization methodology is chosen to implement to perform peak shaving and time-of-use applications.
3. The current study is performed about the Culture-house case, where Excel is used to analyze energy consumption input data, and the tariff calculation of Skellefteå kraft is calculated. The optimization methodology is implemented in MATLAB.
4. Results of optimization for peak shaving, time-of-use, battery degradation, and BESS economic validity are presented in section 5.
5. Results are discussed, and the outcomes of the study are drawn. 6. Suggestions for future work are proposed.
3
LITERATURE STUDY
3.1
Battery storage technologies
Different battery energy technologies have been developed over time to meet various fields demand, depending on specific application requirements. Those requirements can be specific capacity, energy density, charge/discharge performance, power output, response time, life cycle, security, and cost. As battery technology continues to develop, the efficiency, energy density, and lifetime of newly developed batteries have significantly improved. Various technologies have been developed to implement energy storage applications, such as Ni-cd batteries, Ni-MH batteries, lead-acid batteries, flow batteries, and Li-ion batteries (Fan et al., 2019).
The first commercial Li-ion batteries were produced in 1990 by Sony. Since then, the Li-ion batteries have developed significantly. Today, it is one of the leading battery technologies in the market of energy storage. Li-ion batteries have long cycle life, low self-charge rate, high efficiency (close to 98%), and can handle a wide range of operating temperature ranges. The batteries can be made in different sizes and shapes: wound prismatic, staked prismatic, spiral-wound cylindrical, and pouch cell design (Fan et al., 2019). There are various advantages and few disadvantages of Li-ion batteries, as shown in Table 1.
Table 1 Advantage and disadvantages of Li-ion battery (Fan et al., 2019)
Advantages Disadvantages
Long cycle life Relatively high cost
Long shelf life Poor high-temperature performance Relatively high energy density The requirement of protective
circuitry
Low maintenance fee
Broad operation temperature range Rapid charge capability Different possible chemistries offer design flexibility
A schematic representation of a battery energy storage system is shown in Figure 4, where a generic storage device represents a DC storage source, such as a battery.
Figure 4 Schematic of BESS (Akhil et al., 2013)
Figure 4 shows the power conversion system, a bidirectional device that converts Alternating current (AC) to direct current (DC) to store in the storage device. When the load needs electricity, then the DC electricity is discharged from the storage device and converted to AC through a power conversion system before being delivered to the load (Akhil et al., 2013). The BESS is connected to the grid and is shown in Figure 5.
Figure 5 BESS connected to the grid (Martins et al., 2018)
Figure 5 shows the grid-connection to BESS and the load. The arrows in the figure illustrate the power flow direction for all three components. The grid can directly deliver the energy to load and to BESS for storing the energy. Energy can later be drawn from BESS to manage the peaks. The goal is not to let grid power consumption exceed over a specific limit. The charge and discharge limit depends on the inverter’s size (Martins et al., 2018).
3.2
Battery energy storage services
A report by Rocky Mountain Institute was published in 2015. The report gives an excellent overview of which different applications that BESS can offer. Previous studies are presented on the economics of various applications (Garrett Fitzgerald et al., 2015).
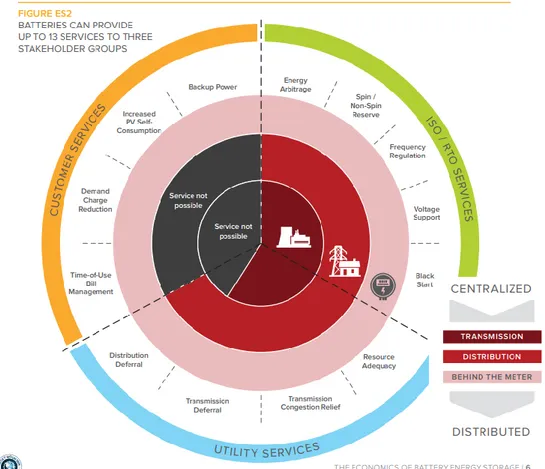
Energy storage can be categorized in three different applications: behind the meter, at the transmission level, or the distribution level, as shown in Figure 6. Energy storage in all three categories provides value to the grid. However, behind-the-meter, customer-sited storage can provide the largest number of services to the electricity grid at a larger scale. The storage
installed behind the meter is not necessarily the least-cost option. However, it can provide the most essential service of all, which is backup. When examining BESS’s economics and analyzing economics change depending on where BESS is deployed in the grid, the regulators and utilities should aim to install BESS as downstream in the electricity system as possible (Garrett Fitzgerald et al., 2015).
Thirteen services that BESS provide can benefit various stakeholder are shown in Figure 6. The stakeholder groups are regional transmission organizations (RTOs) and independent system operators (IOSs), utilities, and customers. The benefits from some services can vary depending on which stakeholder group it is. Furthermore, hundreds of variables can affect the range in value that BESS can provide to all stakeholders. These variables are dependent on the location where resources are deployed (Garrett Fitzgerald et al., 2015).
Figure 6 Battery services (Garrett Fitzgerald et al., 2015)
3.2.1
Battery storage for ISO/RTO services
1) Energy Arbitrage – Purchasing electricity when the locational marginal price (LMP) of energy is low (off-peak hours) and selling the electricity to the market when LMPs are highest (peak hours) (Garrett Fitzgerald et al., 2015).
2) Spin/non-spin reserves – Spinning reserve can handle the unexpected contingency event, such as sudden generation outrage, by using the online generation capacity and can serve load immediately. The non-spinning reserve can respond to expected emergency events within a short period, usually within 10 mins (Garrett Fitzgerald et al., 2015).
3) Frequency regulation – Maintaining the frequency around 50 Hertz during all operation hours is crucial. All the generators in the power grid must be spinning at the same speed, or the system itself will become unstable. The cause for deviation in the grid frequency can be intermittent power generation from renewables and variable loads. BESS is an attractive way to keep the
balance between supply and demand. The battery is discharged if the frequency is under 50 Hertz and is charged if it is over 50 Hertz in rapid time (Frequency Regulation, 2020). 4) Voltage support – Voltage support is similar to frequency regulation. It ensures smooth
electricity flow across the power grid. The transmission and distribution system must maintain an acceptable range of voltage to ensure that both real and reactive power production is in sync with the demand (Garrett Fitzgerald et al., 2015).
5) Black start – In case of emergency grid outrage, black start-generation assets are conditioned to restore power stations operation, which brings the regional grid back online (Garrett Fitzgerald et al., 2015).
3.2.2
Battery storage for Utility services
Utility services can be categorized into transmission and distribution-system upgrade deferral. The focus is on utilizing investment in energy efficiency and distributed energy resources to avoid large amounts of investments in transmission and distribution infrastructure (Garrett Fitzgerald et al., 2015).
1) Resource adequacy – Power generation plants must meet the demand for peak electricity hours. When peak hours exceed the current power generation capacity, grid operators and utilities can invest in energy storage instead of investing in new power plants. This will lead to avoid or reduce the need for new generation capacity and also decrease the risk of overinvestment in that area (Garrett Fitzgerald et al., 2015).
2) Distribution deferral – A distribution system upgrade is required to meet the grid load growth in specific regions. Therefore, battery storage can be an excellent alternative for delaying or entirely avoiding utility investments in the distribution system upgrade (Garrett Fitzgerald et al., 2015).
3) Transmission congestion relief – Utilities must pay extra during certain times of the day to IOSs to use congested transmission. Battery storage can be deployed and be discharged during congested periods on the utility side to minimize congestion in the transmission system (Garrett Fitzgerald et al., 2015).
4) Transmission deferral – Transmission deferral upgrade is required to meet the grid’s load growth in specific regions. Therefore, battery storage can be an excellent alternative for delaying or entirely avoiding utility investments in the transmission system upgrade (Garrett Fitzgerald et al., 2015).
3.2.3
Battery storage for customer services
Figure 6 shows four different battery services a customer can use.
1) Demand charge reduction – Demand charges can be charged yearly or monthly depending on which tariff system is under operation. A more in-depth explanation about peak shaving is given in sections 3,3 (Mehr et al., 2013).
2) Time-of-use (TOU) bill management – TOU is about minimizing electricity purchases during peak hours when the electricity price is highest and shifting these purchases to periods of lower rates and storing the electricity in the battery. When the electricity price is high, the battery is discharged (Garrett Fitzgerald et al., 2015).
3) Backup power – Comes into use during grid failure, energy storage connected with a local generator can provide backup power at multiple scales (Garrett Fitzgerald et al., 2015). 4) Increased PV self-consumption – It is done by storing the extra energy generated by PV. during
the day and using the stored energy at night or peak hours. Therefore, PV self-consumption leads to the minimization export of electricity generated by PV, therefore maximizing the financial benefits of solar PV (Garrett Fitzgerald et al., 2015).
3.3
Peak Shaving
One of the methods to decrease fluctuations in the load profile is peak shaving. Through the peak shaving method, higher power demands are reduced. There is a possibility of optimizing the electrical power grid size by a less fluctuating power demand because then the entire grid installation can be diminished for lower power peaks (Peak Shaving, 2020). One of the methods for peak shaving is installing a BESS, where for example, the BESS is charged during hours of lower power demand and discharged when the power demand is high.
There are different advantages of peak shaving, which can be categorized into three parts: benefits for the grid operators, end-users, and Carbon emission reduction. To handle the peak demands, the power plants consume additional fuel. In some cases, additional non-environment-friendly energy plants are used with multiple start-stops. Peak load shaving results in the more efficient operation of power plants and reduces the load variability, leading to reduced carbon emissions and stability in the grid (Uddin et al., 2018).
The peak load periods in a calendar year can occur at different times during the day, depending on the season and the energy composition (commercial, residential, or industrial). Traditionally, the electrical system infrastructure is created to meet up with the highest demand level, which leads to the underutilized system during off-peak periods. In the larger industrial sites, the demand peak-valley gap can be up to 40 % - 50 %. The peak valley gap is necessary to fill to reduce the infrastructure system’s cost and improve its utilization (Wang & Wang, 2013). Therefore, commercial, and industrial customers are charged for both total energy consumption and their highest power demand. Both commercial and industrial customers are attracted to decreasing energy and power costs, which are an essential part of the total charges (Martins, Hesse, et al., 2018).
Figure 7 Peak shaving strategy (Mehr et al., 2013)
Figure 7 is an example of the charging and discharging mode of BESS in peak shaving applications. The red line represents that both grid and BESS are connected to the load demand, and depending on the load demand, the battery is charged/discharged. The dotted blue line represents the power consumed by the building from the grid without any BESS. The BESS is in charging-mode when the load demand is on the lower side (before 06.00h). Battery discharging-mode is activated when the load is at the peak (around 18.00h), which leads to flatter demand profiles, as shown with a red line (Mehr et al., 2013).
3.3.1
Peak shaving benefits for the grid operator.
There are various benefits for grid operators from peak shaving. The first one is power quality is improved by maintaining a balance between electricity generation and demand. Therefore, it leads to a stable system, avoidance of voltage fluctuation, and less stress on generation machinery through constant frequency in the synchronous power grid. Secondly, it helps with efficient energy utilization by reducing the load factor. The load factor determines how efficiently electricity is being used. The other factors are the power reliability of the electrical power grid, renewable energy integration, and cost reduction. The power grid system is experiencing significant peak loads, increasing day by day, and will affect the grid’s reliability. Therefore, BESS’s installation can lead to improved power reliability (Wang & Wang, 2013). The fifth factor is integrating renewable energy, where BESS can balance intermittent production from renewable compared to the load demand. Lastly, the economic benefits occur by matching the supply and demand perfectly with peak shaving, which results in a reduction of energy production cost. Time of use (TOU) also reduces the cost of energy consumption, where peak shaving is done during daytime when the electricity is more expensive than during night-time (Lee, 2007).
3.3.2
Benefits for end-user
To meet the unpredictable and time-varying peak demands, less efficient, and none environmentally friendly generators (peak generators) are required. Therefore, it leads to an increase in kWh electricity generation cost for the peak period. It is the consumer who has to pay for this higher cost of electricity generation during peak hours. Though BESS, the residential and industrial customers can save money on electricity bills by minimizing electricity from the grid under the peak period (energy price is high). Customers can instead shift their load to off-period when the energy price is low. Peak shaving also offers some other benefits to end-users, such as improved reliability and power quality (Uddin et al., 2018). Other services also occur, such as sizing the infrastructure for a flatter profile with BESS rather than designing it for the highest power demand by network reinforcement (Nykamp et al., 2013).
3.4
Previous studies on battery storage systems
Even though improvements in BESS areas such as efficiency and life cycle are increasing significantly (Geurin et al., 2012). However, BESS’s high investment costs are still a considerable concern for the power system applications area’s economic viability (Martins, Musilek, et al., 2018). Therefore, proper power and energy sizing are crucial in deploying any BESS projects. BESS sizing has a direct impact on economic viability. If BESS is undersized, it can result in high aging-related depreciation costs. Still, an over-sized BESS system might not achieve the optimal cost-benefit ratio because of the high investment cost (Hesse et al., 2017). Optimization method applied to figure out the best-fit battery storage system for a residential suburban area has been performed (Tant et al., 2013). A multi-objective optimization was performed to find a trade-off between peak power reduction, voltage regulation, and annual cost. The proposed optimization method can also determine the battery size and inverter size by having them as a control variable. Study by Tant et al. (2013), can help grid operators who can implement this method to support the idea of temporarily installing BESS in the problematic feeder by postponing grid up-gradation for the short term because of work
planning issues. Furthermore, Tant et al. (2013), states that when the grid operator compares the cost of grid upgrades, BESS can also be a valuable alternative in the long term.
Another study proposed an approach to determine the break-even point for BESS by proposing a methodology based on the iterative process divided into three phases. The first one is selecting feasible power and energy pairs, 2nd BESS scheduling, and 3rd about economic
evaluation based on (NPV) analysis. BESS’s economics is evaluated through the difference between the costs and the benefits that BESS can provide by peak shaving (Rahmann et al., 2017).
Figure 8 Methodology proposed for sizing of BESS (Rahmann et al., 2017)
Figure 8 demonstrates a flowchart of the methodology for BESS’s sizing. BESS’s technical characteristics such as efficiency, lifecycle, DoD, and related capital and (O&M) costs are taken as input data. Through BESS, scheduling the optimal charging/discharging schedule is decided for each day. For the economic evaluation, NPV on (O&M), energy cost duo to BESS losses and peak power charges is performed. Rahmann et al. (2017), results represent that parameters such as life cycle, round trip efficiency, and peak power cost are crucial factors for sizing BESS for peak shaving applications. Furthermore, it is mentioned by the authors that with round trip efficiency of 75 % and a life cycle of 3000, the break-even cost of BESS is 400 $/kW and 200 USD/kWh. The increase in round trip efficiency, life cycle allows for higher breakpoints cost of BESS.
3.4.1
Approaches implemented to optimize BESS
There are different methods to operate storage systems, and traditionally it is performed by linear, nonlinear, quadratic, and dynamic programming (Ahlert & van Dinther, 2009; Bradbury et al., 2014; Youn & Cho, 2009). A study by Youn and Cho. (2019), was done on the optimal operation of an ESS installed to buy and sell energies under spot prices to the power grid through the linear programming technique. The algorithm can be solved using a simplified technique. Another linear optimization model of a storage system that calculates arbitrage accommodation’s economic benefits for the end consumer is performed by (Ahlert & van Dinther, 2009). The algorithm calculates the economic benefits for end consumers by
determining the cost-optimal charge/discharge schedule. Ahlert and van Dinther (2009) also conclude that the most crucial factors that affect the simulation results are the ESS’s cost and efficiency. A linear optimization model is implemented by Bradbury et al. (2014), to determine the storage power and energy capacities to maximize the internal rate of return (IRR) in arbitrage applications by considering 14 different EES technologies. Bradbury (2014) furthermore states that optimal sizing of storage is determined by ESS technological characteristics such as round-trip charges/discharge efficiency and self-discharge, but the volatility of electricity price influences the IRR.
Optimal scheduling operation of the BESS is crucial to reduce the cost of grid charges for any building or utility. There are various scheduling techniques. The most common one is Rolling horizon-base scheduling for microgrid operation, which aims to update the optimal decision based on the latest information (Gao et al., 2018). In this paper by Gao et al. (2018), they created optimal scheduling of a microgrid while considering different parameters such as demand charges, energy cost, and battery wear-cost through mixed-integer linear programming problem. Furthermore, the authors state that their proposed method could effectively minimize the cost and net flow at peak hours to avoid demand charges.
A study on TOU is performed in Denmark by finding the optimal operation strategy to maximize the storage profit (Weihao Hu et al., 2010). The optimization algorithm is based on the quadratic programming method. The result concludes that the proposed optimal operation strategy effectively achieves BESS’s maximum profits. The hourly spot market price is available one day ahead in Denmark. Consumers may have some motivation to install an energy storage system to save energy costs. This paper by Weihao Hu et al. (2010), presents an optimal operation strategy of battery energy storage systems to the real-time electricity price to achieve maximum profits of the BESS
In a study where “multipass iteration particle swarm optimization” (MIPSO) is implemented, and it is about nonlinear optimal scheduling problems (Lee, 2007). MIPSO algorithm is implemented to solve BESS’s optimal operating schedule for an industrial TOU rate user with wind turbine generators. The algorithm can be applied for real-time evaluations, considering that wind speed and load are two uncertain factors.
A former study presents a sizing methodology and optimal operating strategy with dynamic programming for a BESS to provide a peak load shaving application (Oudalov et al., 2007). The sizing method aims to maximize customer’s economic benefits by applying peak demand reduction with a BESS of a minimum capacity and lowest cost while satisfying the BESS physical constraints. Dynamic programming can consider the stochastic nature of loads and electricity price variability, unlike linear programming techniques. Therefore, dynamic programming methods can overcome this limit (Telaretti & Dusonchet, 2016). Research is performed on residential storage systems’ economics through optimal storage operational strategy using dynamic programming. Different system sizes and price scenarios are evaluated and compared. The study has used a generalized parameter for inverter, cost, and degradation of lithium-ion batteries, and they predict the positive return on investment in the near future (Muenzel et al., 2015).
According to Hesse et al. (2017), such sensitivity analyses are not ideal if many parameters are screened and optimized simultaneously. Hesse et al. (2017) also state that these issues can effectively be resolved using linear optimization approaches, which have already been successfully applied to energy storage optimization. For example, in a study which provides a scheme for electrical and thermal storage integration in households (Lauinger et al., 2016). The energy distribution is performed by linear programming, which shows how energy conversion units such as fuel cells, a boiler, a heat pump, and PV can be combined with energy storage devices (battery and hot water tank) for a residential building. This work shows power
flow analysis, considers specific battery degradation. Furthermore, it presents a quickly reproducible and adaptable linear optimization approach to attain both the cost and maximum profit for residential BESS.
Hesse et al. (2017), published their outcomes in a scientific article where the paper focuses on techno-economic analysis and PV-BESS optimization to determine the optimal parameters. The report has performed a linear optimization method to find the cost-optimal sizing of the battery. The result shows the power flow optimization for best storage operation patterns by considering different factors such as the trade-off between energy purchase, feed-in tariff, and battery aging. Hasse et al. (2017), states that since the objective function and constraints have a linear relationship. Therefore, linear programming (L.P.) is well suited to solve the optimization problem due to the linearity of feed-in-tariff, electricity price, and other parameters. However, the author also mentions that the battery aging process is not linear, but it can be linearized by obtaining a linearized degradation function for the BESS aging process. The study also concluded that linear optimization provides obvious, repeatable results with modes and controllable calculation effort compared to other optimization methods.
After the literature study on the different methods to optimize BESS, linear optimization seems to be the most suitable and simplified approach for this culture-house case. Battery degradation, in general, is very complex. However, through linear equations, it is easier to include battery degradation into the model.
3.5
Battery aging
It can be questioned why battery aging is considered when it comes to peak shaving, as the battery is not used as frequently. But some studies have shown that storage deterioration has a considerable impact on the economic aspect when it comes to energy storage operations (Hesse et al., 2017)
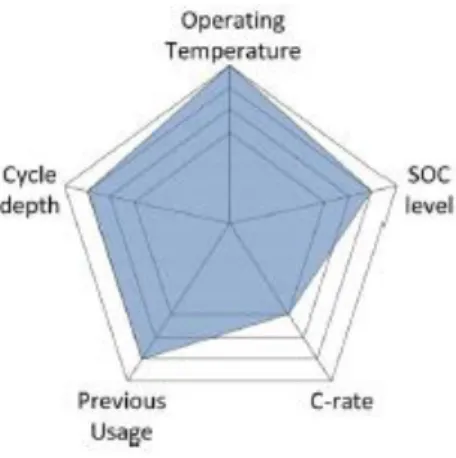
Unfortunately, all the li-ion batteries in the market have performance degradation as a function of time calendric aging and usage cycle life (Broussely et al., 2005; Swierczynski et al., 2015). Calendar aging is an irreversible loss of battery capacity and power capability during storage over time, and cycle aging is caused by charging and discharging states. The two main stress factors affecting calendar aging are temperature and SOC level. Therefore, cycling aging is affected not only by temperature (high or low) and SOC-level (low or high) but also cycle depth and C-rate (high C-rates) (Stroe et al., 2014).
Figure 9 illustrates the stress factors influencing the lifetime of the li-ion battery and operating temperature, cycle depth, and SOC level, which affect the most while C-rate is not very influential.
A study is performed on Li-ion batteries with complex aging characteristics with high charge and discharge currents (Groot et al., 2015). According to Groot (2015), the operation conditions have a significant and non-linear effect on calendar life and cycle life. The study also mentions that reason for degradation is the multitude of reaction processes at the electrode/electrolyte interface and in the bulk material. The aging has been categorized into three groups: 1) loss of cyclable Li and c, 2) loss of active electrode material, 3) loss of conductivity in electrolyte/electrodes.
Usually, the aging process degradation rate is highly related to operating conditions such as charge/discharge rate, temperature, DOD, and SOC region. Furthermore, it is mentioned that large cells have a wide distribution of electrical, thermal, and mechanical stresses in different parts of the cell, which leads to uneven degradation in the battery. As a result, the overall degradation is very complex and very difficult to predict. However, Groot (2015), also states that a higher current rate temperature does lead to shorter cycle life. The study concluded that SOC range has a significant impact on cycle life even at raised temperature; more than four times longer cycle life can be achieved if SOC is 60% instead of 100% SOC.
A study investigated calendar aging of lithium-ion batteries at different temperatures for 16 different (SOCs) from 0 to 100% (Keil et al., 2016). The author concluded that calendric aging does not increase steadily with the SOC, but differential voltages analyses confirm that it is mainly dependent on electrode balancing.
A study performed about the linear battery aging model for industrial peak shaving applications provides an excellent understanding of how battery degradation can be looked at from a linearization perspective (Martins, Musilek, et al., 2018). Battery calendric and cyclic aging defines the state of health (SoH) until a certain amount of capacity fade for a battery occurs. Martin et al. (2018) assumed that BESS must be replaced when SoH drops to 80% of nominal capacity. Where overall aging is calculated through the equation presented below:
Equation 1 total aging of the battery (Martins, Musilek, et al., 2018)
agingtot =agingcyc+agingcal
Where 𝑎𝑔𝑖𝑛𝑔𝑡𝑜𝑡=0 represents unused battery and meanwhile 𝑎𝑔𝑖𝑛𝑔𝑡𝑜𝑡=1 means that the
battery has reached 80% of its original capacity. The crucial factors that help produce a reasonable model are the analytic equations, which estimate cell degradation and superposition of cyclic and calendric aging. Both are crucial for implementing a linear model (Martins, Hesse, et al., 2018).
The calendric aging is represented in Cfade, cal (SOC, T, ∆t), where calendric capacity fade is a
function of temperature, SOC, and time. However, it is assumed that temperature is maintained constant, and it is possible to achieve linear capacity fade over time, as shown in Figure 10. The figure shows calendric aging per time step dependent on SOC, and the orange line shows the linearization with the time step, which is 15mins (Martins, Musilek, et al., 2018).
Figure 10 Calendric linearization (Martins, Musilek, et al., 2018)
The linearization function of calendric aging, which is time-dependent (i), can be expressed as:
Equation 2 linearization of the calendric aging (Martins, Musilek, et al., 2018)
𝐶𝑓𝑎𝑑𝑒,𝑐𝑎𝑙,𝑙𝑖𝑛(𝑆𝑂𝐶)𝑖 = (3.676 ∗ 10−7∗ 𝑆𝑜𝐶(𝑖) + 6.246 ∗ 10−6)
However, cycling aging has different stress factors, as already mentioned earlier. The authors presented the results using a figure to show how the cycling aging model operates with stress factors such as C-rate and DoD, shown in Figure 11.
Figure 11 factors affecting cyclic aging model (Martins, Musilek, et al., 2018)
It can be seen from Figure 11 that C-rate between -0.5C and 0.5C does not affect cyclic capacity fade. Therefore, an ideal C rate should be between these values. It is mentioned in the study that C-rate can be ignored for charging/discharging by averaging the C-rate factor for the linearization of cyclic aging. Authors also proposes another method to look at cyclic aging by considering the number of full equivalent cycles (FEC). FEC gives overall energy throughput by either looking at a charge or discharge direction, with DoD per cycle divided by available capacity (Martins, Musilek, et al., 2018). The following equation calculates FEC’s number.
Equation 3 full equivalent cycles (Martins, Musilek, et al., 2018)
FEC = 0.5 *1
t∫ SOC(t)dt ≈0.5*
∫|Pbatt|dt
Ebattnom
FEC is when the battery fully charges and then discharges; therefore, a 0.5 factor is there to count one full charge/discharge cycle as a half cycle. SOC stands for state of charge, Pbatt for the
power flow through the battery, and 𝐸𝑏𝑎𝑡𝑡𝑛𝑜𝑚 is the battery’s nominal energy capacity (Martins,
4
CURRENT STUDY
4.1
Analyzing the predicted electrical demand
The energy consumption calculations are performed in IDA-ICE software by a consultant company Incoord. The energy consumption data was given in an excel sheet, and it included both district heating and electrical heating energy data. Data was sorted, and only electrical energy data was included for this project. What is included in the electrical energy consumption data can also be categorized in different departments, as shown in Table 2.
Table 2 Electrical consumption department
Department Culture house Unit
Fixed electrical load x W
HVAC ventilation x W
Cooling x W
Operational electricity x W
4.1.1
Predicted electrical consumption data for 2019
The electrical energy data is used as the building’s load demand, which is used as input data in the MATLAB model. Building load demand is predicted through IDA-ICE by Incoord for one year, as shown below.
Figure 12 Yearly electrical consumption data
Figure 12 illustrates the yearly electrical consumption data and does not include heat consumption. The y-axis shows the effect in kW, and the x-axis shows the number of hours for the entire year. The graph represents an hourly load demand for culture-house from Jan to Dec. The load demand does not include the building’s heat consumption. Therefore, there is not much seasonality for one-year load demand. It can be observed that the electrical demand during the winter, spring and autumn has similar load patterns. There is higher electrical demand during summer times. Because the culture-house is a glazed building, and overheating can occur. Therefore, the ventilation system must operate extra hours to compensate for overheating. 0 50 100 150 200 250 300 350 400 450 1 252 503 754 1005 1256 1507 1758 2009 2260 2511 2762 3013 3264 3515 3766 4017 4268 4519 4770 5021 5272 5523 5774 6025 6276 6527 6778 7029 7280 7531 7782 8033 8284 8535 Lo ad d em an d [kW]
Hours for 1 Year
When the data is broken down on a monthly basis, it can be observed that some clear patterns occur on weekdays and weekends for each month of the year. Each month has different power peaks, and the power peaks are higher during the summer period. The power subscription is monthly based, and therefore peak shaves are determined for each month. The battery size must fulfil the required discharge demand that occurs on a daily basis without reaching minimum discharge capacity. Two months of the electrical load is analyzed since there is a variation in the load in those two seasons (winter and summer).
Figure 13 Electrical demand of January
Figure 13 shows the electrical demand of January, and the peak load price is charged for the highest power peak. It can be observed that there is a very repetitive pattern in the load. On weekdays, clear power spikes are happening every day, and on the weekend, they are even higher than on weekdays.
Figure 14 Electrical demand for June
June electrical demand also shows spikes in electrical demand daily, as shown in Figure 14; however, the peak demands are higher than in winter months in June. There is no clear pattern in peaks daily or weekend wise as it was in January. The highest peak demand is 388 kW for this month. There is only baseload price in June and no additional peak load price, which all the winter months has, which will be explained in the tariff calculation section below.
0 50 100 150 200 250 300 350 1 32 63 94 125 156 187 218 249 280 311 342 373 404 435 466 497 528 559 590 621 652 683 714 kW Hours
January
0 100 200 300 400 500 1 31 61 91 121 151 181 211 241 271 301 331 361 391 421 451 481 511 541 571 601 631 661 691 kW HoursJune
Figure 15 Electrical demand for one day
Figure 15 demonstrates the electrical demand for 24 hours for a weekday at the beginning of the year. It can be observed that electrical demand is low until 08 in the morning and starts to increase during the day. There is a small peak during 14-16 and another during evening time from 19-21. If, for example, the peak shave limit is 260 kW, then the battery would discharge during 19-21 hours. Peaks occurring during the nighttime could be due to scheduled events that would occur at night.
4.2
Tariff calculations
In this section, the Skellefteå Kraft tariff system is presented. Tariff charges are calculated from the given data on the Skellefteå website (Elnätspriser, 2019). Culture house electrical charges are categorized into two bills, presented in sections 4,2,1, and 4,2,2.
4.2.1
Determine monthly effect charges
1st is maximal demand charges, where Culture house pays for the highest demand in kW for
every month. Maximal demand charges are dependent on which month it is and what time it is during the day. January, February, March, November, and December are high load months. The high load period is for those five months and between 06:00 to 22:00 from Monday-Friday. All the weekends and night hours (23:00 to 06:00) and April to October falls under the baseload period. The values for additional high load price and baseload are presented as SEK/kW in Table 3.
Table 3 Monthly effect charges (Elnätspriser, 2019)
Additional high load price 57 SEK/kW
Baseload price 24 SEK/kW
Additional high load price is two times the baseload price. Therefore Culture-house is encouraged to cut down the peaks, especially during the high load period, to save money. That is where the peak shaving application comes in and helps to reduce the effect charges. Culture-house must pay for baseload charges and additional high load charges, which are calculated by equations 4 and 5. 0 50 100 150 200 250 300 350 1 2 3 4 5 6 7 8 9 10 11 12 13 14 15 16 17 18 19 20 21 22 kW Hours
1 day load-demand
Equation 4 Baseload charges
𝐵𝑎𝑠𝑒𝑙𝑜𝑎𝑑 𝑐ℎ𝑎𝑟𝑔𝑒𝑠 = ∑ 𝐵𝑎𝑠𝑒𝑙𝑜𝑎𝑑 𝑝𝑟𝑖𝑐𝑒 ∗ 𝑀𝑎𝑥𝑖𝑚𝑢𝑚 𝑒𝑓𝑓𝑒𝑐𝑡 𝑖𝑛 𝑏𝑎𝑠𝑒𝑙𝑜𝑎𝑑 𝑝𝑒𝑟𝑖𝑜𝑑(𝑛)
12
𝑛=1
Equation 5 High load charges
𝐻𝑖𝑔ℎ 𝑙𝑜𝑎𝑑 𝑐ℎ𝑎𝑟𝑔𝑒 = ∑ 𝐴𝑑𝑑𝑖𝑡𝑖𝑜𝑛𝑎𝑙 ℎ𝑖𝑔ℎ 𝑙𝑜𝑎𝑑 𝑝𝑟𝑖𝑐𝑒 ∗ 𝑀𝑎𝑥𝑖𝑚𝑢𝑚 𝑒𝑓𝑓𝑒𝑐𝑡 𝑖𝑛 ℎ𝑖𝑔ℎ 𝑙𝑜𝑎𝑑 𝑝𝑒𝑟𝑖𝑜𝑑(𝑛)
12
𝑛=1
Where n represents the number of months in a year. To determine monthly peaks, an array of days per month = [31 28 31 30 31 30 31 31 30 31 30 31] is created. Then hours per month are calculated by multiplying day per month by 24hours. A Loop is created, where the loop’s length is (hours per month), and the loop determines the highest power demand for each month. By analyzing the load demand monthly, it was observed that the max effect in the baseload period always occurred on weekends. The ratio between the maximum effect on high load period and baseload period is assumed to around 94,5% after analyzing the data for the whole year for Jan, Feb, Mar, and Dec in Excel. That means if January has a maximum effect of 302 kW during the baseload period, then the maximum effect for the high load period is 302 kW * 94,5 % ≈ 286 kW.
Table 4 provides the effect charge calculations performed for the 12 months if no peak shaving is performed. It can be observed that Jan, Feb, Mar, Nov, and Dec have the highest fee for effect charges. Those months belong to the high load period months, and Culture-house must pay effect charges for both the baseload and high load period. Load demand in the base period is higher than the high load period due to anticipated events that will occur on weekends. The total expected effect charges for a 12month period are 176 615 SEK. Peak shaving aims to reduce the effect charges as much as possible while considering the limitation of battery and inverter size.
Table 4 Effect charges for Culture-house
Month Base charges [SEK/kW] The Highest Demand in baseload period [kW] Additional high load charges [SEK/kW] The highest demand in high load period [kW] Effect charges [SEK] January 24 302 57 286 23 532 February 24 303 57 286 23 567 March 24 306 57 289 23 790 April 24 315 0 0 7 552 May 24 373 0 0 8 947 June 24 389 0 0 9 329 July 24 376 0 0 9 025 August 24 353 0 0 8 473 September 24 321 0 0 7 710 October 24 309 0 0 7 412 November 24 304 57 287 23 676 December 24 303 57 286 23 601