Postprint
This is the accepted version of a paper published in The journals of gerontology. Series A, Biological sciences and medical sciences. This paper has been peer-reviewed but does not include the final publisher proof-corrections or journal pagination.
Citation for the original published paper (version of record):
Finkel, D., Sternäng, O., Jylhävä, J., Bai, G., Pedersen, N L. (2019)
Functional Aging Index Complements Frailty in Prediction of Entry into Care and Mortality.
The journals of gerontology. Series A, Biological sciences and medical sciences, 74(12): 1980-1986
https://doi.org/10.1093/gerona/glz155
Access to the published version may require subscription. N.B. When citing this work, cite the original published paper.
Permanent link to this version:
Entry into Care and Mortality
Deborah Finkel, Ph.D.1,2, Ola Sternäng, Ph.D.2,3, Juulia Jylhävä, Ph.D.4, Ge Bai, M.S.4, and
Nancy L. Pedersen, Ph.D.4,5
1. Department of Psychology, Indiana University Southeast, New Albany, Indiana 2. Institute for Gerontology, Jönköping University, Jönköping, Sweden
3. Södertörn University, Huddinge, Sweden
4. Department of Medical Epidemiological and Biostatistics, Karolinska Institutet, Stockholm, Sweden
5. Department of Psychology, University of Southern California, Los Angeles, CA
Corresponding Author: Deborah Finkel
Email: dfinkel@ius.edu phone: 812-941-2668
ABSTRACT
BACKGROUND: The aim was to develop a functional aging index (FAI) that taps four body systems: sensory (vision and hearing), pulmonary, strength (grip strength), and
movement/balance (gait speed) and to test the predictive value of FAI for entry into care and mortality.
METHOD: Growth curve models and cox regression models were applied to data from 1695 individuals from three Swedish longitudinal studies of aging. Participants were aged 45 to 93 at intake and data from up to 8 follow-up waves were available.
RESULTS: The rate of change in FAI was twice as fast after age 75 as before, women
demonstrated higher mean FAI, but no sex differences in rates of change with chronological age were identified. FAI predicted entry into care and mortality, even when chronological age and a frailty index were included in the models. Hazard ratios indicated FAI was a more important predictor of entry into care for men than women; whereas it was a stronger predictor of mortality for men than women.
CONCLUSIONS: Measures of biological aging and functional aging differ in their predictive value for entry into care and mortality for men and women, suggesting that both are necessary for a complete picture of the aging process across genders.
Functional Aging Index Complements Frailty in Prediction of Entry into Care and Mortality
Gerontologists are in agreement that using chronological age as the only metric for investigating the aging process can be problematic, but there is less agreement about what metric should be used to complement chronological age. Leading contenders can generally be divided into two categories: frailty and biological age. A frailty index is typically derived as the
proportion of potential deficits exhibited by an individual in multiple domains [1-3]. In contrast, measures of biological age take a more computational approach, focusing on molecular and phenotypic biomarkers of aging and combining them into single index [4-7]. Generally, the only consensus among proponents of these many possible aging metrics is that no single measure, or single composite measure, will capture all facets of the aging process [4, 8, 9]. The World Health Organization has championed an approach that focuses on healthy aging as a process of developing and maintaining functional abilities as opposed to simply the absence of disease [10]. Indeed, Rockwood and colleagues [1] suggested that other indexes might advantageously focus on function and mobility, and in a separate analysis reported that a functional scale, composed of 12 measures of activities of daily living, was significantly better at predicting risk for entry into an institution than the frailty index [2]. Moreover, evidence suggests that functional capacity can play a critical role in offsetting the effects of disease burden to increase years of healthy aging [11]. Our goal is to expand on these results by combining existing “functional biomarkers of aging” [12, 13] to develop an index of functional aging that can complement existing measures of biological aging and frailty by focusing on functional capacity.
Functional biomarkers of aging tap relative functional capacity using methods that are minimally invasive and accessible to practitioners and researchers without access to genotyping
or extensive blood chemistries [12]. In reviews of research on functional biomarkers of aging, four domains of functioning are most common: lung function, muscle strength, gait speed, and sensory acuity [9, 13]. Of these, only lung function is included in typical definitions of biological aging [5, 6]. Lung function, muscle strength, and gait speed may be included among the thirty to forty items in a frailty measure, but only as categorical variables that indicate a vulnerability threshold, not quantified functioning (e.g., [3]). The aims of the current analyses were to use data from three Swedish longitudinal twin studies of aging to create a functional aging index (FAI) and to validate the index using criteria adapted from those proposed by Searle and colleagues [3] for frailty indexes: (a) candidate component measures must be associated with (functional) health status, (b) functioning on the measures should generally decline with age, (c) declines in
functioning should not saturate too early in the aging process, (d) measures should tap a range of domains, and (e) in longitudinal studies, component measures must be consistent over
measurement waves. In addition, utility of FAI was investigated in three ways. First, given the well-documented sex differences in the experience of aging [14] and in measures of frailty [1], we examined sex differences in change trajectories for FAI. Second, we examined the extent to which FAI complemented chronological age in the prediction of entry into care and mortality. Third, we compared the effectiveness of FAI and an established measure of frailty in predicting entry into care and mortality.
METHOD Participants
Data from three Swedish twin studies were combined to create a sample that covered adulthood beginning at age 50 while oversampling late adulthood (ages 70-93), as recommended for investigations of functional biomarkers [12]. The three studies were each drawn
independently from the Swedish Twin Registry and similar, often identical, means of identifying, recruiting, and assessing the participants were used: Swedish Adoption/Twin Study of Aging (SATSA; [15]), Origins of Variance in the Oldest Old (OCTO-Twin; [16]), and Aging in Women and Men: A Longitudinal Study of Gender Differences in Health Behavior and Health among Elderly (GENDER; [17]). The purpose of both OCTO-Twin and GENDER was to sample specifically twins in later adulthood. Supplemental Figure 1 demonstrates that inclusion of data from OCTO-Twin and GENDER boosted sample size at ages 65 and above, providing some counterbalance to the effects of reduced sample size in late ages typical of longitudinal studies. In-person testing (IPT) took place in a location convenient to participants, including homes and long-term care clinics. In total, functional biomarkers were available from at least one testing occasion for 1695 individuals: 740 from SATSA, 478 from OCTO-Twin, and 477 from
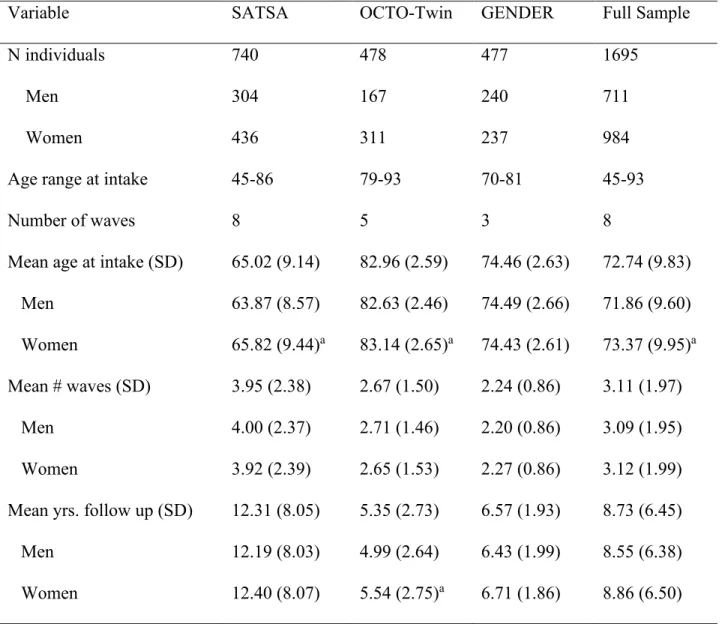
GENDER. As shown in Table 1, the study sample was majority female (58%), with a mean age at intake of 72.74 years (range: 45 - 93 years). Due to the difference purposes of the three studies, there were sample differences in mean age at intake and thus proportion of women. In the combined sample, there were no sex differences in mean number of waves of participation (t(1693) = 0.30, n.s.) or number of years of follow-up (t(1693) = 0.97, n.s.).
Measures
Gait Speed. Time to walk 3 meters and return was recorded by trained research nurses using a handheld stopwatch.
Subjective sensory ability. Although visual acuity was measured using a reading test in all 3 studies, over 90% achieved the highest possible score in all waves, resulting in too little
variation to be useful as a measure of aging. Correlations between self-report measures of sensory abilities and measured acuity tend to be in the range of .50 - .90 [18-20]. Therefore,
vision and hearing were measured via self-report, which is likely to reflect sensory ability in a broad array of situations. Participants were asked to rate their vision on a scale from 1 (excellent) to 5 (nearly blind or blind) and to rate their hearing on a scale from 1 (excellent) to 5 (nearly deaf or deaf). The scale ranged from 1 to 6 in OCTO-Twin and GENDER; responses were prorated to transform to 5-point scale. Research suggests that dual sensory impairment (both hearing and vision) is more debilitating than single sensory impairment and can be predictive of poorer health and increased risk of mortality [21]. Therefore, similar to previous studies (e.g., [18]), the two measures were summed to create the subjective sensory ability measure with fairly normal distribution at all waves (see Supplemental Figure 1).
Muscle strength. Grip strength was measured by a handgrip dynamometer or vigorimeter administered by a trained research nurse at the IPTs. In SATSA, the dynamometer was used through wave 8; in the remaining SATSA waves and all OCTO-Twin and GENDER waves, a vigorimeter was used. Differences between the two tools are scale and ease of use for older adults. Overlapping data on the two measures in a sample of 45 adults provided data for creating a transformation equation; thus all data were transformed to dynamometer units. Participants made six attempts (three with each hand) and the maximum score (in kg) was considered as the participant’s grip strength score.
Lung function. Lung function was tested on portable spirometers with subjects in seated position and their nasal passages blocked with nose clips. Two trials of peak expiratory flow (PEF) were completed and data from the best trial were used in the present analyses. In SATSA, forced expiratory volume in the first second (FEV1) was assessed instead of PEF at IPT2. As both measures were available from all other waves, the data were used to create a linear transformation equation and FEV1 at IPT2 was translated to PEF units.
FAI. Methods for combining biomarkers into a composite measure of biological age vary [6]. Frailty indexes typically rely on unit weighting, particularly because other weighting
methods such as factor analysis can limit generalizability by producing weights specific to the sample [1, 2, 5]. Correlations among the four measures and the results of factor analysis at each wave can be found in Supplemental Table 1. Correlations among items ranged from .11 to .44 across waves. Factor analysis identified a single factor at each wave that explained 40-43% of the variance, with factor loadings ranging from .36 to .78 across waves. For these reasons, we chose to use unit weighting and sum the four domain variables to create the functional biological age composite. Before calculation of FAI, grip strength was regression-corrected for sex and PEF was corrected for body volume through dividing it by the individual’s squared height in meters [22]. The four variables were standardized separately based on means and standard deviations at intake to avoid issues of measurement variance (c.f., [5]), and grip strength and PEF were reverse scored to ensure that higher scores indicated poorer performance. Finally, the composite score was translated to the T-score metric (mean = 50, SD = 10); higher scores on FAI indicate poorer functioning.
Frailty. A 42-item Rockwood-based frailty index (FI) has previously been calculated for the SATSA sample and shown to predict mortality [23]. The index includes indications of illnesses, self-reported health, and activities of daily living, as well as self-reported vision and hearing. For the purpose of these analyses, a 40-item scale was created that did not include the vision and hearing items, to ensure no definitional overlap between FI and FAI. A similar frailty index was created for the OCTO-Twin and GENDER samples using a largely overlapping set of 39 and 42 items, respectively (see Supplemental Table 2 for a list of items used to created the
frailty indexes). Relying on the proportion of deficits observed reduces the impact of slight differences in the number of items used to create the frailty indexes [1, 2].
Mortality. Mortality data retrieved from the Swedish National Death Registry on 16 February 2018 were used to determine survival and age at death, as appropriate. Of the 1695 participants, 700 (41%) had died.
Entry into care. At each wave, participants were asked where they currently lived and responses were dichotomized into those living in their own home or apartment and those living in a care situation such as elder home or long-term care. Two variables were created for use in regression analyses: last known residential status (at home vs. in care) and age at which they last reported living at home. These measures provided a rough estimate of age of entry into care. Of the 1695 participants, 242 (14.3%) had entered into care at the time of their last contact with study personnel: 83 men and 159 women (chi-square = 6.87, df = 1, p < .01).
Statistical Method
Latent Growth Curve Model. An age-based latent growth curve model (LGCM) was used to estimate trajectories of change with age in the individual functional biomarkers and the
resulting composite FAI [24, 25]. To examine the age trajectories in the component biomarkers of FAI, a two-slope LGCM was applied to the data [24, 26]: one linear slope before the centering age and a separate linear slope after the centering age. Comparison of LGC models centered at different ages (65, 70, 75, 80, 85) indicated that centering the model at age 75 provided the best fit to the data, comparable to results reported for a similar measure in SATSA alone [27]. The parameter estimates were obtained using PROC Mixed in SAS 9.4 and models were corrected for twinness by estimating both within pair and between pair variance in the random effects.
Survival Model. Survival models were used to investigate the extent to which FAI could predict years to entry into care and years to death. Cox proportional hazards models were run in PROC PHREG in SAS 9.4. Comparing models predicting entry into care and mortality with and without FAI and with and without FI provided a test of the ability of FAI to add significantly to the prediction of entry into care and mortality above chronological age, sex, and frailty. Models were corrected for twinness. Thirty-five participants (11 men and 24 women) were already living in a long-term care facility at the intake wave and thus were not included in the survival analysis of entry into care.
RESULTS Components of FAI
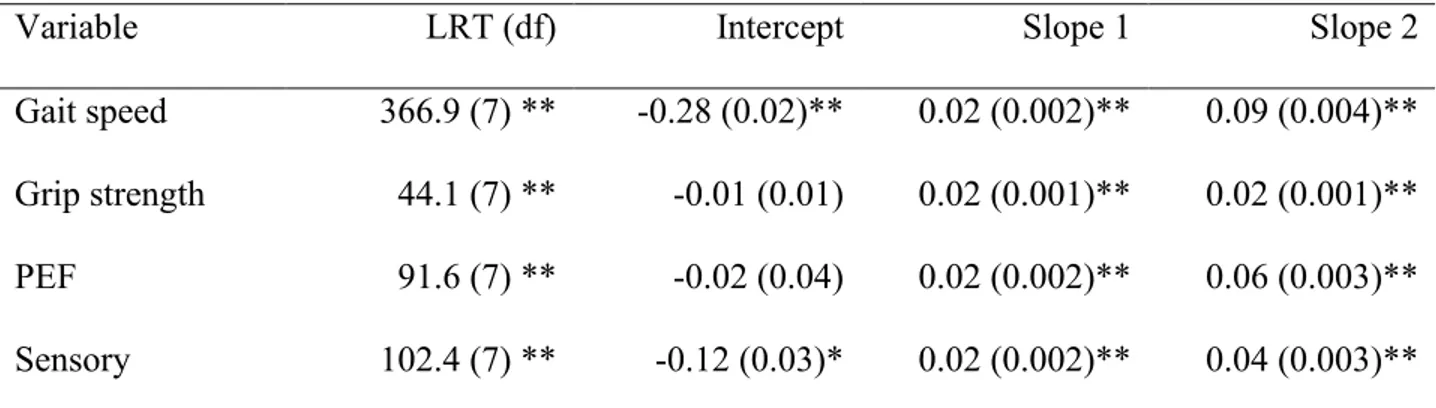
LGC models were used to demonstrate two criteria: functioning on the measures should generally get worse with age and changes in functioning should not saturate too early in the aging process [3]. Table 2 presents the results of comparing the one-slope LGCM to the two-slope LGCM for all four component measures of FAI. Nested LGCM can be compared using a likelihood ratio test (LRT), which is the difference in the model fit statistic (log likelihood) for the two models. The results in Table 2 demonstrate that all four component measures showed significant within-person change with age. Second, for all four measures, the two-slope model provided an improved fit to the data over the one-slope model. Aging trajectories for each biomarker are presented in Supplemental Figure 2. Finally, slope 2 was equal to or greater than slope 1 for all four measures, indicating that none of the measures had saturated too early in the aging process. The two-slope model also provided the best fit to the data for FAI (LRT = 192.1, df = 7, p < .01), with a significant increase in slope after age 75.
Sex differences in the LGCM for FAI were tested at two levels: fixed effects (sample means) and random effects (variance around the sample means). Three nested LGC models were compared: (1) the two-slope model with no sex effects, (2) the two-slope model with sex effects added in the fixed effects, and (3) the two-slope model with sex effects added in both fixed and random effects. Comparison of model 2 likelihood = 37,624.3) versus model 1 (log-likelihood = 37,674.1) indicated significant sex differences in fixed effects (LRT = 49.8, df = 3, p < .01) and comparison of model 3 (log-likelihood = 37,551.0) versus model 2 indicated
significant sex differences in random effects (LRT = 73.3, df = 13, p < .01). The estimated aging trajectories for fixed and random effects for men and women are presented in Figure 1. Mean level of FAI was significantly higher for women than men at the centering age (p < .001); however, there were no significant sex differences in rates of change in FAI with age before or after the centering age (see Figure 1a). Incorporating twinness in the LGCM means that both within pair and between pair variances are estimated. As shown in Figure 1b, variances increased with age for both sexes, but the increase is significantly greater for men than for women. Greater increases in within-pair variance suggest increasing unique environmental influences on FAI with age.
Predicting Entry into Care and Mortality
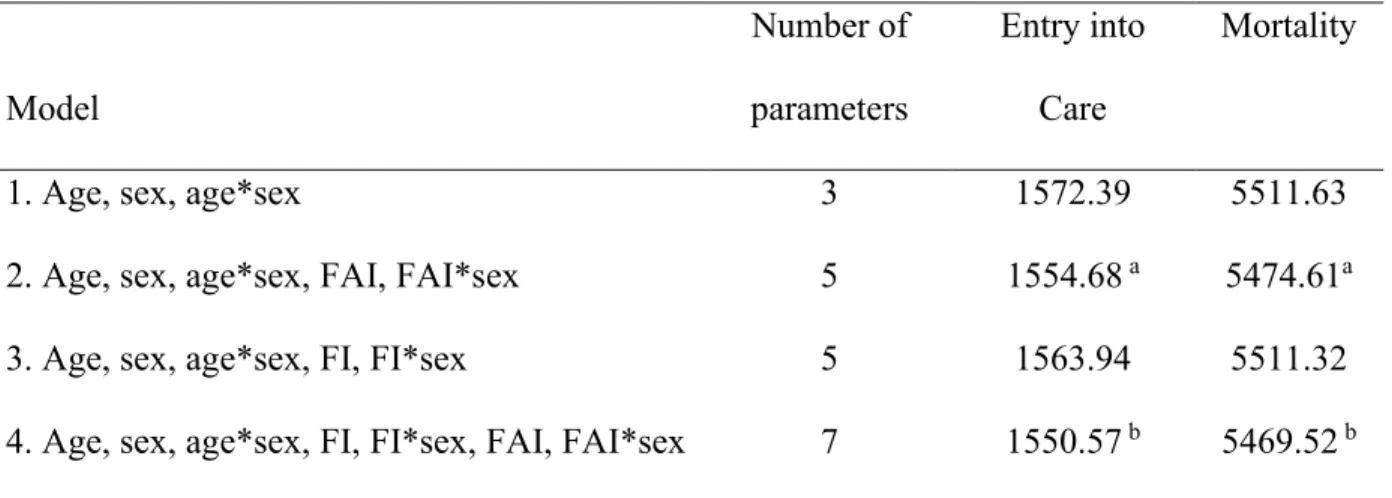
Two Cox survival models were compared for each outcome variable: model 1 included age at intake, sex, and age at intake x sex and model 2 added FAI and FAI x sex. Model fit statistics for each model are presented in Table 3. Comparing the two models provided a test of the predictive value of FAI in addition to age: results indicated that FAI contributed significantly to the prediction of entry into care (LRT = 17.71, df = 2, p < .01) and the prediction of mortality (LRT = 37.02, df = 2, p < .01) in the models that included chronological age as well. Hazard
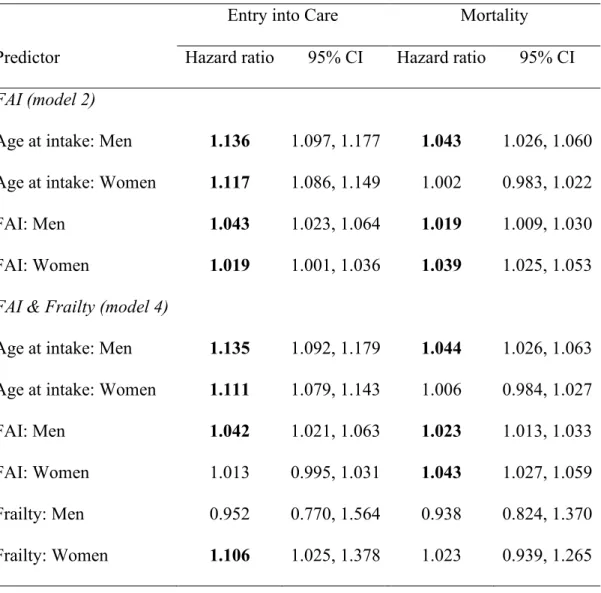
ratios for each predictor estimated by model 2 are presented in the top half of Table 4; significant hazard ratios are in bold. For prediction of both entry into care and mortality, hazard ratios for FAI were significant for both men and women. The 95% confidence intervals indicate that hazard ratio of FAI for entry into care for men (1.043) was significantly greater than the hazard ratio for women (1.019). In contrast, in the prediction of mortality the hazard ratio of FAI for women (1.039) was significantly great than the hazard ratio for men (1.019). 1
Complementing Frailty
Frailty and FAI at intake were correlated 0.48. Two additional regression models were completed to examine the role of FAI vis-à-vis frailty in predicting entry into care and mortality, and the model fit statistics are also presented in Table 3. Model 3 included age, sex, age x sex, FI, and FI x sex. In model 4, FAI and FAI x sex were added to model 3. Comparing the two models tested whether FAI complemented chronological age and frailty in the prediction of entry into care and mortality. Model comparisons indicate that FAI added significantly to the
prediction of both entry into care (LRT = 13.38, df = 2, p < .01) and mortality (LRT = 41.81, df = 2, p < .01), even when both age and frailty was included in the model. Hazard ratios for model 4 are reported in the bottom half of Table 4. Similar to the results for FAI alone (model 2), sex differences in the predictive value of FAI were evident for both entry into care and mortality. Again, the 95% confidence intervals indicate that hazard ratio of FAI for entry into care for men (1.042) was significantly greater than the hazard ratio for women (1.013), which was not
significantly different from zero in this model. In contrast, in the prediction of mortality the hazard ratio of FAI for women (1.043) was significantly great than the hazard ratio for men (1.023), even when both age and frailty were included in the model.
The aim of the current analyses was to develop and test a composite measure of functional aging to complement measures of frailty and biological age. Similar measures have been used in previous research [18, 22, 28, 29]; our purpose was to apply the conceptual
approaches common to creating composite measures of frailty and biological age to the creation of an index of functional biomarkers of aging. The functional aging index (FAI) was defined as the sum of standardized measures of gait speed, grip strength, lung function, and subjective sensory function. Latent growth curve modeling was used to validate the component functional biomarkers and then Cox survival models were used to examine the utility of the resulting index. Validation of Components of FAI
Criteria for validating measures of frailty and biological age have evolved as the research on these measures has developed [3, 12, 30]. We adapted a set of criteria proposed for frailty indexes [3] to establish that FAI meets generally accepted criteria for composite measures of the aging process. First, reviews of functional biomarkers of aging consistently identified the four measures included in FAI as strongly associated with functional health outcomes [9, 13]. Second, functioning on the measures should generally decline with age. Cross-sectional data can confound age and cohort and thus age correlations can tap cohort differences in functioning. In the current analyses, age-based latent growth curve modeling allowed us to examine person change with age in the functional biomarkers. The results indicated significant within-person increases in functional difficulties for all four biomarkers. Third, for all four functional biomarkers, the rate of change after age 75 was equal to or greater than the rate of change before age 75, demonstrating that none of the components saturated too early. Fourth, measures should tap a range of domains. Choice of components in the current analyses was based on reviews of research on functional biomarkers [9, 13] and research demonstrating that these domains are
associated with functional and cognitive aging outcomes (e.g., [18, 22]). To satisfy the final criterion that these component measures must be consistent over measurement waves, we chose straightforward physical measures and corrected for any changes in instrumentation over time. Utility of FAI
In the second part of the analyses, utility of the resulting FAI was tested in three ways: analysis of sex differences, complementing chronological age in prediction of entry into care and mortality, and investigation of its complementary role with an established frailty index. Sex differences in the experience of aging should be reflected in sex differences in age change trajectories in FAI. Men tend to have earlier and more compressed histories of major illnesses and disability prior to death, while women live longer, have more health complaints across the life course, and higher prevalence of chronic disabling but not fatal diseases later in life [14, 31]. As a result, women tend to demonstrate more frailty [32] and “older” biological age [33]. In the current analyses, latent growth curve models demonstrated significantly higher FAI for women compared with men, indicating poorer functioning for women than men. Individual differences in FAI increased with age for both sexes, but variance increased significantly more for men than for women, particularly after age 75. This sex difference in age trajectories for variance likely reflects the sex differences in both survival and illness histories: men who survive to late old age exhibit more individual differences in FAI than women of the same age range.
A primary criterion for any composite measures of aging is that it should complement chronological age in the prediction of mortality [12, 30]. Hazard models indicated that FAI added to the prediction of both entry into care and mortality in addition to chronological age and sex. Sex differences were evident in the role of FAI for prediction of both entry into care and mortality: the hazard ratio of FAI for entry into care was higher for men than women, but the
hazard ratio for mortality was higher for women than for men. Thus, for every unit increase in FAI, men had a 4.3% increased risk of entry into care whereas women had a 1.9% increased risk. For mortality, a one-unit increase in FAI resulted in a 3.9% increased risk for women but only a 1.9% increased risk for men. Single people are more likely to be in care and older women are more likely to be single (widowed or divorced), so significantly more women than men in the full sample were in care (16.3% vs. 11.7%). Because men were more likely than women to be married (68.7% vs. 43.6%) and thus living with someone who could provide support, a higher level of disability was required for men before it would be necessary to enter into care.
Similar to results reported by Rockwood and colleagues [2] for a composite of activities of daily living, model comparisons demonstrated that FAI contributed significantly to the prediction of entry care in addition to chronological age. Moreover, in the model that included frailty, the hazard ratio of FAI for entry into care was significant only for men, whereas the hazard ratio of frailty was significant only for women. Clearly, FAI and FI are tapping aspects of the aging process that differ for men and women, in relation to the different experience of aging for men and women [14, 31]. Evidence suggests that acute illnesses (e.g., cardiovascular disease and stroke) are more common for men, and these illnesses will have a dramatic impact on functional abilities, triggering entry into care [34, 35]. In contrast, women are more likely to experience a gradual increase in chronic illnesses that result in increased frailty, as measured by the frailty index, and eventually triggering entry into care as the number of conditions
accumulates with age [14]. Limitations
Limitations include many of the statistical assumptions common to structural equation models. The data are assumed to be missing at random and the sample is assumed to be relatively
homogeneous. As one focus of the current analysis was sex differences, it is important to note that patterns of participation did not differ significantly for men and women. As with any longitudinal sample, attrition occurred in these samples. However, using an age-based growth curve model instead of a time-based model allowed us to maximize power, especially for individuals with more participation waves. Even though the samples were representative of the population at intake, non-random dropout through the course of the longitudinal studies results in increasingly select samples of adults who are healthy enough to participate. However, inclusion of the OCTO-Twin and GENDER studies allowed us to oversample late adulthood and thus reduce the impact of selective survival. In addition, in all three studies, research nurses visited the participants at their current residence; therefore, data collection could continue even after entry into care. As a result, wave-to-wave dropout in these studies was quite low (about 8%), but dropout accumulates across waves. Consequently, our analyses have likely underestimated the extent of change with age. Finally, our estimate of age of entry in to care was inexact: we were only able to track change in living situation from one wave to the next but did know have exact age or date of entry into care, which introduces a certain amount of measurement error into prediction of entry into care.
Conclusions
FAI was designed to tap functional biomarkers of aging in order to complement existing measures that focus on medical health, such as frailty and biological age [12]. There is general agreement among aging researchers that no single measure, or single composite measure, can capture all facets of the aging process [4, 8, 9]. Indeed, the current analyses indicated that FAI and a standard frailty index have different predictive value for men and women for entry into care, suggesting that each composite focuses on different facets of the aging process and that
both are necessary for a complete picture of the aging process across genders. Thus while FAI, frailty, or biological age provide more information about processes of aging than can be captured by the passage of time (i.e., chronological age), they focus on different facets of the process. Investigations have confirmed the validity of these separate dimensions of disease status and functional limitations (e.g., [36]). Measures of frailty and biological age take a comprehensive approach to general disease status, quantifying a “nonspecific state of increasing risk,” that reflects multisystem physiological change [1, 6]. In contrast, the functional aging index
presented here emphasizes changes that will directly impact mobility and independence and thus can provide improved prediction of entry in to care (c.f., [12]). To the extent that the separate dimensions of disease status and functional status exist on a pathway from physiological deficits to overall health status [10, 12, 36, 37], indexes like FAI that focus on functional status will also contribute to the prediction of mortality.
NOTES:
1. Survival models that included individual Bayes estimates of intercept and slope from the latent growth curve of FAI in place of FAI at intake showed that results for FAI-intercept were no different from FAI at intake and adding FAI-slope to the model did not significantly improve model fit.
FUNDING
SATSA was supported by grants R01 AG04563, R01 AG10175, the MacArthur Foundation Research Network on Successful Aging, the Swedish Council For Working Life and Social Research (FAS) (97:0147:1B, 2009-0795) and Swedish Research Council (2007-7460, 825-2009-6141). OCTO-Twin was supported by grant R01 AG08861. GENDER was supported by the MacArthur Foundation Research Network on Successful Aging, The Axel and Margaret Ax:son Johnson’s Foundation, The Swedish Council for Social Research, and the Swedish Foundation for Health Care Sciences and Allergy Research. Finkel was supported by
1R03AG048850-01 and 2R56AG037985-06. Pedersen and Sternäng were supported by Swedish Research Council 2013-08689.
CONFLICTS OF INTEREST
ACKNOWLEDGEMENTS
Finkel contributed the primary statistical analyses associated with this submission. Sternäng, Jylhävä, and Bai contributed supplemental statistical analyses. Finkel, Sternäng, Jylhävä, Bai, and Pedersen contributed to the preparation of the manuscript.
References
1. Rockwood, K. and A. Mitnitski, Frailty in relation to the accumulation of deficits. Journal of Gerontology: Medical Sciences, 2007. 62A(7): p. 722-727 DOI: 10.1093/gerona/62.7.722.
2. Rockwood, K., et al., A global clinical measure of fitness and frailty in elderly people. CMAJ, 2005. 173(5): p. 489-495 DOI: 10.1503/cmaj.050051.
3. Searle, S.D., et al., A standard procedure for creating a frailty index. BMC Geriatrics, 2008. 8: p. 24 DOI: 10.1186/1471-2318-8-24.
4. Jylhävä, J., N.L. Pedersen, and S. Hägg, Biological age predictors. EBioMedicine, 2017.
21: p. 29-36 DOI: 0.1016/j.ebiom.2017.03.046.
5. Belsky, D.W., et al., Quantification of biological aging in young adults. PNAS, 2015: p. E4104-E4110 DOI: 10.1073/pnas.1506264112.
6. Levine, M.E., Modeling the rate of senescence: Can estimated biological age predict mortality more accurately than chronological age? Journals of Gerontology: Biological Sciences, 2013. 68(6): p. 667-674 DOI: 10.1093/geron/gls233.
7. Fried, L.P., et al., Frailty in older adults: evidence for a phenotype. J Gerontol A Biol Sci Med Sci, 2001. 56(3): p. 146-156 DOI: 10.1093/gerona/56.3.M146.
8. Sprott, R.L., Biomarkers of aging and disease: Introduction and definition.
Experimental Gerontology, 2010. 45: p. 2-4 DOI: 10.1016/j.exger.2009.07.008. 9. Anstey, K.J., Cognitive aging and functional biomarkers: What do we know, and where
to from here?, in Handbook of Cognitive Aging: Interdisciplinary Perspectives, S.H.D. Alwin, Editor. 2008, Sage: Thousand Oaks, CA. p. 327-339 DOI:
10. World Report on Ageing and Health. 2015, World Health Organization: Geneva. 11. Sanders, J.L., et al., Effects of Disease Burden and Functional Adaptation on Morbidity
and Mortality on Older Adults. J Am Geriatr Soc., 2016. 64: p. 1242-1249 DOI: 10.1111/jgs.14163.
12. Butler, R.N., et al., Biomarkers of aging: From primitive organisms to humans. Journal of Gerontology: Biological Sciences, 2004. 59A(6): p. 560-567 DOI:
10.1093/gerona/59.6.B560.
13. Anstey, K.J., S.R. Lord, and G.A. Smith, Measuring human functional age: A review of empirical findings. Experimental Aging Research, 1996. 22: p. 245-266 DOI: 10.1080/03610739608254010.
14. Deeg, D.J.H., F. Portrait, and M. Lindeboom, Health profiles and profile specific health expectancies of older women and men: The Netherlands. Journal of Women and Aging, 2002. 14: p. 27-46 DOI: 10.1300/J074v14n01_03.
15. Finkel, D. and N.L. Pedersen, Processing speed and longitudinal trajectories of change for cognitive abilities: The Swedish Adoption/Twin Study of Aging. Aging,
Neuropsychology, and Cognition, 2004(11): p. 325-345 DOI: 10.1080/13825580490511152.
16. McClearn, G.E., et al., Substantial genetic influence on cognitive abilities in twins 80 or more years old. Science, 1997. 276: p. 1560-1563 DOI:
10.1126/science.276.5318.1560.
17. Gold, C.H., et al., Gender and health: A study of unlike-sex twins. Journal of Gerontology: Social Sciences, 2002. 57B: p. S168-S176 DOI:
18. Wahlin, Å., et al., How do health and biological age influence chronological age and sex differences in cognitive aging: Moderating, mediating, or both? Psychology and Aging, 2006. 21(2): p. 318-332 DOI: 10.1037/0882-7974.21.2318.
19. Carta, A., et al., Self-assessment of the quality of vision: association of questionnaire score with objective clinical tests. Current Eye Research, 1998. 17: p. 506-512 DOI: 10.1076/ceyr.17.5.506.5191.
20. Cox, R.M., G.C. Alexander, and I.M. Rivera, Comparison of Objective and Subjective Measures of Speech Intelligibility in Elderly Hearing-Impaired Listeners. Journal of Speech, Language, and Hearing Research, 1991. 34: p. 904-915 DOI:
10.1044/jshr.3404.904.
21. Smith, S.L., L.W. Bennet, and R.H. Wilson, Prevalence and characteristics of dual sensory impairment (hearing and vision) in a veteran population. Journal of Rehabilitation Research & Development., 2008. 45(4): p. 597-610 DOI: 10.1682/JRRD.2007.020023.
22. Sternäng, O., et al., Associations between functional biological age and cognition among older adults in rural Bangladesh: Comparisons with chronological age. Journal of Aging and Health, 2018 DOI: 10.1177/0898264318757147.
23. Jiang, M., et al., Frailty index as a predictor of all‐cause and cause‐specific mortality in a Swedish population‐based cohort. Aging 2017. 9: p. 2629-2646 DOI:
10.18632/aging.101352.
24. Bryk, A.S. and S.W. Raudenbush, Hierarchical linear models. 1992, London: Sage Publications.
25. McArdle, J.J. and E. Anderson, Latent variable growth models for research on aging., in Handbook of the Psychology of Aging (3rd Ed.), J.E.B.K.W. Schaie, Editor. 1990, Academic Press: New York. p. 21-44.
26. Finkel, D., et al., Latent growth curve analyses of accelerating decline in cognitive abilities in late adulthood. Developmental Psychology, 2003. 39: p. 535-550 DOI: 10.1037/0012-1649.39.3.535.
27. Finkel, D., O. Sternäng, and Å. Wahlin, Genetic and environmental influences on longitudinal trajectories of functional biological age: Comparisons across gender. Behavior Genetics, 2017. 47: p. 375-382 DOI: 10.1007/s10519-017-9851-5. 28. MacDonald, S.W.S., C.A. DeCarlo, and R.A. Dixon, Linking biological and cognitive
aging: Toward improving characterizations of developmental time. The Journals of Gerontology, Series B: Psychological Sciences and Social Sciences, 2011. 66B(S1): p. i59–i70 DOI: 10.1093/geronb/gbr039.
29. MacDonald, S.W.S., et al., Biological age and 12-Year cognitive change in older adults: Findings from the Victoria Longitudinal Study. Gerontology, 2004. 50: p. 64-81 DOI: 10.1159/000075557.
30. McClearn, G.E., Biomarkers of age and aging. Experimental Gerontology, 1997. 32: p. 87-94 DOI: 10.1016/S0531-5565(96)00067-8.
31. Sainio, P., et al., Self-reported and test-based mobility limitations in a representative sample of Finns aged 30. Scandinavian Journal of Public Health, 2006. 34: p. 378-286 DOI: 10.1080/14034940500489859.
32. Collard, R.M., et al., Prevalence of Frailty in Community-Dwelling Older Persons: A Systematic Review. Journal of the American Geriatrics Society, 2012. 60(8): p. 1487-1492 DOI: 10.1111/j.1532-5415.2012.04054.x.
33. Voitenko, V.P. and A.V. Tokar, The assessment of biological age and sex differences of human aging. Experimental Aging Research, 1983. 9: p. 239-244 DOI:
10.1080/03610738308258458.
34. Leening, M.J., et al., Sex differences in lifetime risk and first manifestation of
cardiovascular disease: prospective population based cohort study. BMJ, 2014. 349: p. g5992 DOI: 0.1136/bmj.g5992
35. Barker-Collo, S., et al., Sex differences in stroke incidence, prevalence, mortality and disability-adjusted life years: results from the Global Burden of Disease Study 2013. Neuroepidemiology, 2015. 45(3): p. 203-214 DOI: 10.1159/000441103.
36. Johnson, R.I. and F.D. Wolinsky, Gender, race and health: The structure of health status among older adults. The Gerontolgist, 1994. 34: p. 24-35 DOI:
10.1093/geront/34.1.24.
37. Verbrugge, L.M. and A.M. Jette, The disablement process. Social Science & Medicine, 1994. 38: p. 1-14 DOI: 10.1016/0277-9536(94)90294-1.
Table 1. Sample demographics
Variable SATSA OCTO-Twin GENDER Full Sample
N individuals 740 478 477 1695
Men 304 167 240 711
Women 436 311 237 984
Age range at intake 45-86 79-93 70-81 45-93
Number of waves 8 5 3 8
Mean age at intake (SD) 65.02 (9.14) 82.96 (2.59) 74.46 (2.63) 72.74 (9.83) Men 63.87 (8.57) 82.63 (2.46) 74.49 (2.66) 71.86 (9.60) Women 65.82 (9.44)a 83.14 (2.65)a 74.43 (2.61) 73.37 (9.95)a
Mean # waves (SD) 3.95 (2.38) 2.67 (1.50) 2.24 (0.86) 3.11 (1.97)
Men 4.00 (2.37) 2.71 (1.46) 2.20 (0.86) 3.09 (1.95)
Women 3.92 (2.39) 2.65 (1.53) 2.27 (0.86) 3.12 (1.99) Mean yrs. follow up (SD) 12.31 (8.05) 5.35 (2.73) 6.57 (1.93) 8.73 (6.45) Men 12.19 (8.03) 4.99 (2.64) 6.43 (1.99) 8.55 (6.38) Women 12.40 (8.07) 5.54 (2.75)a 6.71 (1.86) 8.86 (6.50) a Difference between men and women is significant at p < .05.
Table 2. Results of latent growth curve models of components of functional biological age.
Variable LRT (df) Intercept Slope 1 Slope 2
Gait speed 366.9 (7) ** -0.28 (0.02)** 0.02 (0.002)** 0.09 (0.004)** Grip strength 44.1 (7) ** -0.01 (0.01) 0.02 (0.001)** 0.02 (0.001)** PEF 91.6 (7) ** -0.02 (0.04) 0.02 (0.002)** 0.06 (0.003)** Sensory 102.4 (7) ** -0.12 (0.03)* 0.02 (0.002)** 0.04 (0.003)** Note: LRT = likelihood ratio test of one-slope model versus two-slope model
Table 3. Model fit (-2LL) for Cox survival models with functional aging index (FAI) and frailty index (FI) predicting entry into care and mortality.
Model Number of parameters Entry into Care Mortality
1. Age, sex, age*sex 3 1572.39 5511.63
2. Age, sex, age*sex, FAI, FAI*sex 5 1554.68 a 5474.61a
3. Age, sex, age*sex, FI, FI*sex 5 1563.94 5511.32
4. Age, sex, age*sex, FI, FI*sex, FAI, FAI*sex 7 1550.57 b 5469.52 b a Model fit is significantly different from model 1 at p < .01
Table 4. Hazard ratios resulting from Cox survival models to predict entry into care and mortality (significant odds ratios are in bold).
Entry into Care Mortality Predictor Hazard ratio 95% CI Hazard ratio 95% CI FAI (model 2)
Age at intake: Men 1.136 1.097, 1.177 1.043 1.026, 1.060 Age at intake: Women 1.117 1.086, 1.149 1.002 0.983, 1.022
FAI: Men 1.043 1.023, 1.064 1.019 1.009, 1.030
FAI: Women 1.019 1.001, 1.036 1.039 1.025, 1.053 FAI & Frailty (model 4)
Age at intake: Men 1.135 1.092, 1.179 1.044 1.026, 1.063 Age at intake: Women 1.111 1.079, 1.143 1.006 0.984, 1.027
FAI: Men 1.042 1.021, 1.063 1.023 1.013, 1.033
FAI: Women 1.013 0.995, 1.031 1.043 1.027, 1.059 Frailty: Men 0.952 0.770, 1.564 0.938 0.824, 1.370 Frailty: Women 1.106 1.025, 1.378 1.023 0.939, 1.265
Supplement for:
Functional Aging Index Complements Frailty in Prediction of Entry into Care and Mortality
Deborah Finkel, Ola Sternäng, Juulia Jylhävä, Ge Bai, and Nancy L. Pedersen
Table 1: Correlations among individual biomarkers and factor loadings at each wave. Table 2: Items used to calculate the Frailty Index in each sample
Figure 1: Age distribution across SATSA, Octo-Twin, and GENDER Figure 2: Distribution of subjective sensory ability measure at each wave Figure 3: Latent growth curve aging trajectories for each individual biomarker
Supplemental Table 1. Correlations among individual biomarkers and factor loadings at each wave.
Wave1 Wave2 Wave3 Wave4 Wave5 Wave6 Wave7 Wave8
Variables SATSA OCTO GENDER SATSA OCTO GENDER SATSA OCTO GENDER SATSA OCTO SATSA OCTO
SATSA SATSA SATSA
N 1695 1561 1436 948 763 377 448 265 Correlations Grip x gait .33 .32 .33 .28 .31 .33 .42 .44 Grip x sense .11 .11 .14 .20 .21 .21 .26 .27 Grip x PEF .32 .19 .25 .27 .17 .32 .30 .23 Gait x sense .15 .18 .22 .25 .17 .18 .24 .16 Gait x PEF .34 .31 .28 .30 .11 .34 .22 .22 Sense x PEF .16 .14 .15 .15 .14 .15 .20 .15 Factor Loadings Grip .68 .63 .66 .67 .77 .69 .78 .75 Gait .73 .76 .74 .71 .68 .70 .72 .73 Sense .36 .41 .51 .55 .51 .53 .52 .57 PEF .75 .70 .63 .67 .69 .69 .53 .47 Variance explained 42% 40% 41% 43% 43% 43% 42% 41%
Supplemental Table 2. Items used to calculate the Frailty Index in each sample
Item SATSA OCTO GENDER
Health limits activities X X X
Self-reported general health X X X
Cancer or leukemia X X
Rheumatoid arthritis X X X
Arthritis X X
Chronic bronchitis or emphysema X X
Cataracts X X X
Chest pain X X X
Circulation problems in arms or legs X X X
Persistent cough X
Diabetes X X X
Goiter or other gland problems X X X
Heart failure X X X Hypertension X X X Kidney disease X X X Osteoporosis X X X Sciatica X X X Anemia X X
Cerebral hemorrhage or blood clot in brain X X
Dizziness X X
Gastric ulcer X X X
Allergies/allergic manifestations X X
Asthma X X
Shower and bathe X X X
Get in and out of bed X X
Dress and undress X X
Self-grooming X
Walking X X X
Trouble getting to toilet in time X X X
Travel further distances X X
Supplemental Table 2 continued
Item SATSA OCTO GENDER
Prepare meals X Manage medications X X Manage money X Use telephone X X Grocery shopping X X Loneliness X X X Depressions X X Feel happy X Feel tired X
Keep body fit X
Heart attack X X
Vascular spasm in leg X X
Herpes X
Migraine X X
Glaucoma X X
Speech impairment X X
Eczema X X
Hip joint impairment X X
Neck pain X Shoulder pain X Gall bladder X X Insomnia X X Psychological problems X Stroke X Epilepsy X Liver disease X Gout X
Picking something up from the floor X
Handle small things with your fingers X
Supplemental Figure 1: Age distribution across SATSA, Octo-Twin, and GENDER 171 281 240 48 372 184 293 184 0 100 200 300 400 500 600 700 45-54.9 55-64.9 65-74.9 75-84.9 85+ N u mber of Ind ivid u al s
Age Range at Intake
GENDER OCTO SATSA
Supplemental Figure 2: Distribution of subjective sensory ability measure at each wave. Wave 1 Wave 2 Wave 5 Wave 3 Wave 6 Wave 7 Wave 4 Wave 8 -2 0 2 4 -2 0 2 4