SAMINT-STS;20003
Examensarbete 15 hp
June 2020
Towards Climate Neutral Facility
Management
Improved Greenhouse Gas Emission Calculations
for Ihus
Isabella Agerhäll
Malin Kindmark
Cecilia Stern
Teknisk- naturvetenskaplig fakultet UTH-enheten Besöksadress: Ångströmlaboratoriet Lägerhyddsvägen 1 Hus 4, Plan 0 Postadress: Box 536 751 21 Uppsala Telefon: 018 – 471 30 03 Telefax: 018 – 471 30 00 Hemsida: http://www.teknat.uu.se/student
Abstract
Towards Climate Neutral Facility Management
Isabella Agerhäll, Malin Kindmark, Cecilia Stern
Uppsala municipality has set a goal in line with the UN’s 2030 Agenda for sustainable development to be fossil-free by 2030. To achieve this a lot of local companies have signed the Uppsala Climate Protocol. One of these companies is the municipal facility management company AB Uppsala Kommun Industrihus, Ihus. This project aimed to help Ihus map their emissions connected to facility maintenance and management and to enable them to reach their goal of becoming climate neutral by 2030. The daily facility management was split up into the categories gardening, ventilation and installation, cleaning and facility work, materials and products, renovations, and painting. A sustainability spend analysis was performed on Ihus’ organisation and emissions per spent MSEK were calculated for each category by researching Ihus’ suppliers. By using those emission intensities, the two categories with the highest emissions could be identified as renovations and materials and products with intensities of 84.48 and 57.56 tonnes CO2e/MSEK, respectively. The remaining categories all had intensities below 3 tonnes CO2e/MSEK.
Sensitivity analyses were performed on the results by tweaking the values of which the emissions were based on. The results showed that to lessen Ihus’ climate impact the areas of improvement are life cycle assessments for their facilities and overseeing transports.
ISSN: 1650-8319, SAMINT-STS;20003 Examinator: Joakim Widén
Ämnesgranskare: Umar Hanif Ramadhani Handledare: Robin Rushdi Al-Sálehi
Table of contents
1. Introduction ___________________________________________________________ 3
1.1 Aim and research questions _____________________________________________ 3 1.2 Limitations and delimitations ____________________________________________ 4 1.3 Overview of methodology and data _______________________________________ 4 1.4 Structure of the report _________________________________________________ 4
2. Background ___________________________________________________________ 5
2.1 Ihus ________________________________________________________________ 5 2.2 The 2030 Agenda _____________________________________________________ 5 2.3 CO2 equivalents and global warming potential _______________________________ 6
2.4 Climate neutrality _____________________________________________________ 6 2.5 Greenhouse gas protocol _______________________________________________ 6 2.6 Sustainability reports __________________________________________________ 7 2.7 Sustainable public procurement __________________________________________ 7 2.8 Environmental standards and measurement tools ____________________________ 8
3. Methodology ___________________________________________________________ 9
3.1 Sustainability spend analysis ____________________________________________ 9 3.2 Procedure __________________________________________________________ 10
4. Data processing _______________________________________________________ 11
4.1 Painting ____________________________________________________________ 11 4.2 Gardening __________________________________________________________ 11 4.3 Cleaning and facility work ______________________________________________ 12 4.4 Ventilation and installation _____________________________________________ 13 4.5 Renovations ________________________________________________________ 13 4.6 Materials and products ________________________________________________ 14
5. Results ______________________________________________________________ 14
5.1 Sensitivity analysis ___________________________________________________ 16 5.1.1 Painting ________________________________________________________ 16 5.1.2 Gardening ______________________________________________________ 17 5.1.3 Cleaning and facility work __________________________________________ 18 5.1.4 Ventilation and installation _________________________________________ 18 5.1.5 Renovations ____________________________________________________ 19 5.1.6 Materials and products ____________________________________________ 19
6. Discussion ___________________________________________________________ 19
2
6.2 Emission intensities __________________________________________________ 20 6.3 Ihus’ road towards climate neutrality _____________________________________ 21
7. Conclusion ___________________________________________________________ 24
References ________________________________________________________________ 26 Appendix A ________________________________________________________________ 30
3
1. Introduction
Now more than ever the battle on climate change needs to be acted upon. All parts of society need to contribute for a sustainable future. The United Nations established the 2030 Agenda for sustainable development in 2015, which consists of 17 goals covering social, economic, and environmental perspectives (United Nations, n.d.).
Uppsala municipality has set its own goal to achieve the 2030 Agenda. This has been done in cooperation with multiple different companies and organisations located in Uppsala (Uppsala Climate Protocol, n.d.). It is called the Uppsala Climate Protocol and strives towards a fossil-free Uppsala in 2030 and a climate positive Uppsala in 2050. One of the companies taking part is AB Uppsala kommun Industrihus, henceforth Ihus, a municipal facility management company. As a part of the climate protocol, Ihus wants to reduce its greenhouse gas emissions to minimise its climate impact and become climate neutral by 2030.
To lessen Ihus’ greenhouse gas emissions it is necessary to first determine the amount of emissions and from what part of their organisation most emissions originate. The Greenhouse Gas Protocol is one way to standardise the measurement of greenhouse gas emissions (Greenhouse Gas Protocol, n.d.). With knowledge of emission intensities and total emissions for both the entire organisation and for different parts of the
organisations, it can be determined where the biggest need for reducing climate impact is.
In 2018 a student report analysed Ihus’ organisation to find which parts have the highest emission intensity (Bergström Bostner, et al., 2018). They concluded that facility
maintenance work played an important role. Now Ihus wants to determine the
greenhouse gas emission intensities from different parts of the daily maintenance work and see what actions can be taken to reduce these emissions.
1.1 Aim and research questions
For Ihus to be able to reduce their impact on the environment and become climate neutral, the greenhouse gas emissions in Ihus’ maintenance work need to be mapped. By finding emission intensities for Ihus’ work, Ihus will be able to direct their actions towards streamlining the least efficient work. Therefore, the aim of this report is to map greenhouse gas emissions in Ihus’ maintenance work by analysing the suppliers’ work and help Ihus reach climate neutrality. We aim to answer the following questions:
▪ What types of daily management and maintenance work are done? ▪ Is it possible to determine an emission intensity, and if so, how much
greenhouse gas emissions do the management and maintenance generate in total and per spent MSEK?
▪ How can the estimated emissions help Ihus reach the goals of Uppsala Climate Protocol?
4
1.2 Limitations and delimitations
The studied system was Ihus’ management and maintenance work on their current properties. No new construction projects were analysed. We focused on emissions connected to the daily management operation. To limit the scope of the study, suppliers that mainly work with electricity, waste disposal, and water and sewage services were excluded since these were studied in the student report mentioned above. This means we looked at different types of daily work including gardening, cleaning, and
renovation. The suppliers’ relevance for facility management was decided and only those determined as relevant were used in the calculations of the results. For example, all waste disposal companies were excluded. A list of the relevant companies can be found in appendix A.
Our work has been limited by our ability to contact companies and the information we received from them. Firstly, the situation with COVID-19 meant that many companies needed to review their organisation and therefore had no time nor resources to help us. Secondly, many of Ihus’ suppliers are small, local businesses and few of these had any calculations for their emissions or had collected data or other information about
transport and material use that we could use to perform our calculations. Therefore, we used data from other, similar companies which might not reflect Ihus’ and Ihus’ suppliers’ emissions exactly.
1.3 Overview of methodology and data
This report was partly a literature study and partly a sustainability spend analysis (SSA). The literature study provided information on how to use SSA to calculate the emission intensity and some of the data used in those calculations. The SSA method is divided into four steps: collection of data, mapping of the data in different categories,
application of emission factors, and identification of hotspots for the emissions.
The data this report was based on was obtained from several different sources. A part of it was based on invoices Ihus received from their suppliers. This was to provide
information on the cost of the different services. In cases where no direct information was available, data from companies that conduct similar work but are bigger and have published a sustainability report were used.
In one case, Ihus provided a service description, from which the greenhouse gas emissions from more detailed parts of the work could be calculated.
1.4 Structure of the report
The second chapter in this report is the background that presents and explains relevant terms and subjects needed to understand the calculations and discussion. In the third chapter the methodology is presented. The fourth chapter explains the different ways the data was produced and processed. The results of the emission calculations will follow in
5
the fifth chapter. Together with the results, there will be a sensitivity analysis for the method and how this affects the reliability of the obtained results. In the sixth chapter a discussion will follow about the results, what they mean for Ihus, and what possible solutions can be applied to lessen their environmental impact. Lastly, the report will end in a conclusion.
2. Background
This section presents background information and an overview of relevant concepts needed for further understanding of this study.
2.1 Ihus
AB Uppsala kommun Industrihus (Ihus) is a municipal facility management company founded in 1972. It is owned entirely by Uppsala Stadshus AB, which in turn is owned by Uppsala Municipality (Ihus, 2017). Ihus manages industrial and special properties around Uppsala. Uppsala kommun förvaltningsfastigheter AB, henceforth FFAB, is a sister company to Ihus with the municipality as the joint owner. FFAB is the owner of around 20-30 special properties such as Uppsala Konsert och Kongress, Uppsala City Hall (Stadshuset), and Biotopia (Rushdi Al-Sálehi, 2020). Since the properties are owned by FFAB but managed by Ihus, which also holds the employees, this report consistently refers to Ihus instead of FFAB even when discussing special properties.
In 2018 another student report called Klimatneutralt Ihus 2030 conducted a
sustainability spend analysis of Ihus’ whole supply chain (Bergström Bostner, et al., 2018). Their study determined that construction had the biggest greenhouse gas emissions. The second biggest source of emissions was facility management. That is why Ihus now needs a deepened and detailed analysis of maintenance and management, since it was discovered that it is a category with many opportunities for development.
2.2 The 2030 Agenda
The UN’s 2030 Agenda is a compilation of 17 goals for a better world. Its purpose is to promote social, environmental, and economic sustainability (United Nations, 2015). The goals were adopted in 2015 and have since then served as the foundation of
sustainability initiatives all over the world. Governments and corporations alike have been engaged in such initiatives.
Uppsala municipality has created the Uppsala Climate Protocol as a path to reach the goals of the 2030 Agenda (Uppsala Climate Protocol, n.d.). As of today, 40 members participates in the network from both the private and public sector. The protocol’s goal is a fossil-free Uppsala in 2030 and a climate positive Uppsala in 2050. Ihus is a part of the network and plans to become climate-neutral by 2030 or sooner (Rushdi Al-Sálehi,
6
2020). Out of the 17 goals, Ihus has primarily focused on those which strongly emphasise a sustainable environment. These include sustainable industry, innovation and infrastructure, affordable and clean energy, sustainable cities and communities, responsible consumption and production, and climate action.
2.3 CO
2equivalents and global warming potential
Carbon dioxide equivalents, shortened CO2e, is a standardised unit measuring
greenhouse gasses (GHG), and the impact these have on the environment (Ecometrica, 2012). It is part of a standard called global warming potential, or GWP. The unit makes it possible to understand what impact different greenhouse gasses have on the climate. It is then possible to compare or sum different greenhouse gasses. GWP aims to compare the results over different periods of time such as 20 or 100 years (IPCC, 2013). While 1 kg of carbon dioxide emits 1 kg CO2e, 1 kg of methane emits 25 kg CO2e since it causes 25 times more global warming over 100 years than CO2 (Ecometrica, 2012). CO2e can be calculated for many different aspects and present comparable effects on the
environment and global warming. This unit will be used further on in this report when referring to greenhouse gas emissions.
2.4 Climate neutrality
This study is one step taken by Ihus to become climate neutral by 2030. Climate neutrality means that the net effect on the climate is zero (Klimatordlista, 2010). A company which strives to be climate neutral have to make sure no emissions affecting the climate are released in their business unless they are compensated for through carbon offsets.
Carbon offsets are a tool to compensate the emissions of CO2e from a company,
government or organisation (Carlén, 2007). Different markets exist for this where one is based on the EU emission trading scheme and is strictly regulated, and another one is less regulated and more on an individual basis. The EU emission trading scheme uses assigned amount units where one unit represents a metric tonne of CO2. The more flexible market is open for both organisations and individuals (Cames, et al., 2016). An individual can for instance purchase offsets (certified emission reductions, CER:s) to plant trees or support a solar park to compensate for their air travel. Some criticism of the offsets market has emerged regarding the credibility and effectiveness of the purchases. One example is that companies often overestimate the reduction of emissions. Another example is that some projects are not economically viable which means that the CER:s will not have the promised effect (Gibbens, 2019).
2.5 Greenhouse gas protocol
The greenhouse gas protocol (GHG protocol) was developed to standardise the
7
governments to manage their emissions (World Business Council for Sustainable Development, 2004). The GHG protocol provides standards for actors, ranging from cities and communities to corporations and countries. Two of these standards are the product standard and the corporate value chain standard. The product standard is used to understand a product’s whole life cycle, whereas the corporate value chain standard is used to find the climate impact of a company’s entire value chain’s emissions (The Greenhouse Gas Protocol, 2004) (The Greenhouse Gas protocol, 2011).
The GHG protocol uses three different scopes to categorise where emissions take place in a company (World Business Council for Sustainable Development, 2004). Scope 1 is direct emissions caused by sources owned by the company, including the company’s own electricity generation, cement production, and transports. Scope 2 includes all CO2e associated with the usage of electricity in the company, but the emissions in scope 2 are generated at the scene where the electricity is produced, not within the company. Scope 3 is by far the most difficult to calculate and is the only one that is not mandatory for companies to determine when using the standards from the GHG protocol. It
includes transports by external actors, emissions from suppliers, and waste disposal and covers the emissions not covered by scope 1 and 2. The scopes are designed so that one company cannot report the same emission in two scopes, but two different companies can report the same emission in different scopes. The GHG protocol is used in many of the sustainability reports this study is based on.
2.6 Sustainability reports
Since the financial year 2017, sustainability reports are demanded from businesses of a certain size according to Swedish law (Bolagsverket, 2019). The companies that are required to provide such a report are those that fulfil at least two of the following three criteria: 250 or more employees, total assets of 175 MSEK, or sales over 350 MSEK. The reports are a part of the work to reach the UN’s 2030 Agenda and the Swedish environmental goals (Effort, n.d.). In the sustainability report, the companies need to disclose information and an understanding of the consequences of their work
concerning the environment, social factors, the personnel, human rights, and corruption. The sustainability report can be a part of their annual report or a separate report
referenced in their annual report. The companies are required to send them to Bolagsverket or publish it on their website within six months of the end of their financial year (Bolagsverket, 2019).
2.7 Sustainable public procurement
Sweden has a national agency for public procurement that work with sustainable public procurement (The National Agency for Public Procurement, 2017). They act as a support for contracting between governments, authorities, entities and suppliers. Their aim and responsibility are that public funds are used in the best possible way. The
8
frameworks in which the contracts are developed are based on several principles, including the principle of non-discrimination and the principle of transparency. The latter means that the contracts must be clear and distinct for all actors involved and with all requirements specified.
Sustainable public procurement refers to requirements concerning social, economic, and environmental sustainability (The National Agency for Public Procurement, 2016). The purchaser can form proposals with criteria that require certain levels of environmental sustainability from the supplier to secure transparency.
2.8 Environmental standards and measurement tools
The CDP (previously Carbon Disclosure Project) works to disclose the environmental impact from companies and cities worldwide (CDP, n.d.). With the disclosure of the environmental impact, the aim is to engage in change for a better environment. The CDP collects data from companies and helps them and other actors with long-term sustainability for both the economy and the environment. The information about companies and corporations that exist in the CDP database can be used for multiple purposes, such as deciding whom to work with.
An environmental product declaration (EPD) is a document that gives transparent and comparable information about a product from an independent source (IVL Svenska Miljöinstitutet, n.d.). An EPD is used as a tool to determine the environmental impact of a product or service for its entire lifecycle. It has several uses but one of them is as a requirement in sustainable procurement.
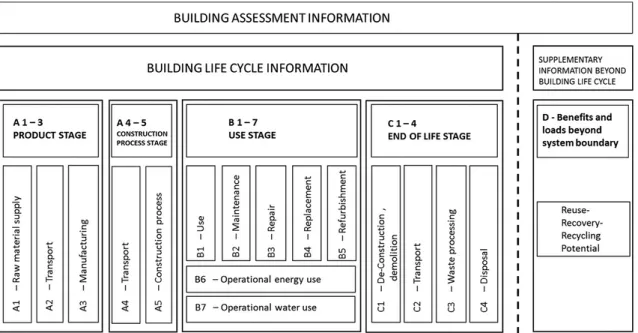
Life cycle assessment (LCA) is a method for calculating products or services’ effect on the climate and environment (Sustainable Facilities Tool, n.d.). The goal is to calculate the total impact something has, not only the effects when it is in use. An LCA is performed on products or projects and can begin when the materials it is made of is taken from the ground and end when the materials go back in the ground. This is called a “cradle to grave” perspective. Important factors are emissions, water consumption, and chemicals and raw material used. The LCA method is standardised with the international standard ISO 14040, where ISO 14041-9 specifies requirements.
An LCA on a building’s lifespan is divided into different categories. These include the production and construction stage A1-A5, the use stage B1-B7, and the end-of-life stage C1-C4 (Gervasio & Dimova, 2018). The production and construction stage cover
everything that has to do with the actual making of the building while the use stage is for everything that comes after the building is finished, including repairs, renovations and use of energy. The end-of-life stage consists of dismantling and disposal of waste from the building. Both the production and the end-of-life stage includes transports, which is not included in the use stage. The stage B1-B7 is the most interesting stage for this report. An illustration of the life cycle is shown in figure 1 below.
9
Figure 1. Building assessment information of a life cycle assessment (Hafner & Rueter, 2018).
Byggvarubedömningen (BVB) is an organisation that performs environmental assessments on construction-related products, primarily focusing on chemicals used. Companies can see what impact different products have on the environment, in order to make an informed decision (Byggvarubedömningen, 2019). It sorts products into three categories, recommended, accepted, and avoid. Ihus’ vision is to primarily use products from the recommended category (Rushdi Al-Sálehi, 2020). Only when this is not possible can products from the accepted category be used.
3. Methodology
In this section the method and data used for finding emission intensities is described. It will begin with a definition of the main method and then continue with a description of how data was collected. Calculations and data processing of Ihus’ spending posts and emissions will be outlined in the section data processing.
3.1 Sustainability spend analysis
Sustainability spend analysis (SSA) is a tool for understanding the impact of different environmental factors, such as water consumption and GHG emissions, and quantifying them. An SSA is performed on the whole supply chain of an organisation and can thus connect environmental impacts to spend categories such as maintenance and transport. Therefore, the categories with the highest impact should be the focus of emissions mitigation. What differentiates an SSA from other ways of measuring emissions is that
10
it not only focuses on operational work, but includes the whole supply chain, which resonates with the aforementioned three scopes (VitalMetrics Group, 2020).
Four steps can be identified for conducting an SSA (VitalMetrics Group, 2020), which are as follows:
1) Collect data: Collect data from accounting, invoices, and procurements. This requires some coordination between different departments such as maintenance and finance.
2) Map data: Map the data collected in step 1 to the different spending categories for the organisation.
3) Apply emissions factors: Apply specific GHG emissions factors to the data from the steps above. This is where the unit goes from SEK and CO2e to CO2e per spent SEK.
4) Identify hotspots: Identify the largest emission per spending post, a hotspot, which then can be further analysed and reduced.
In order to conduct the sustainability spend analysis, data was collected from multiple sources. One part of the data was a list of Ihus’ suppliers connected to their facility maintenance work. For each supplier, the total number and sum of invoices were
provided. Also included was calculations for emissions, materials, and fuel use from the different suppliers. Template calculations for Ihus’ emissions based on the calculations from Klimatneutralt Ihus 2030 or the CDP database were used. We also had access to a service description for one supplier in gardening.
For the services where no data from Ihus’ suppliers was available, other representative companies have been used. In some cases, the representative companies had calculated an emission intensity, and in some cases, other data from their annual or sustainability reports were used to find an emission intensity. Two typical examples are that a
company had reported a total amount of emissions but not an emission intensity, or that two companies had very different intensities for similar services. In the categories where more than one source has been used a weighted mean value has been calculated with consideration to expenses.
3.2 Procedure
Methods for converting emissions and environmental impact to CO2e for different data formats were found through a literature study. Additionally, this provided us with values for emissions for some of the supplier companies or in some cases, values for similar companies. As will be visible in section 3.3 the unit in step 3 in the method will vary but the final result will be the same.
11
All relevant suppliers under maintenance were divided into the following subcategories and sorted based on spending posts: painting, gardening, installation and ventilation, renovations, cleaning and facility work, and materials and products.
To get a comparable result, the emission intensity for each category or supplier was calculated and a sustainability spend analysis was performed, as described above. The emission intensities were then used to determine the category with the most emissions so that Ihus knows where to focus their work.
4. Data processing
A sustainability spend analysis was performed on each category, where steps 1-3 are described in this chapter. The method varied slightly between the categories since not all companies report emissions the same way. Therefore, what assumptions were made and what data was collected for each category is described in the sections 4.1-4.6 below. In all cases but renovations the total amount of emissions in tonnes CO2e for a company was calculated and then divided by its revenue to get the intensity in tonnes
CO2e/MSEK. Calculations for renovations is described in section 4.5.
4.1 Painting
Painting is a minor spending post for Ihus. One 5 litre can of paint emits 13.58 kg CO2e (Newlife Paints ltd, 2012). According to Sandå, a painting company that Ihus did not work with during 2019, their revenue was 1,477 MSEK and around 288 MSEK of the revenue went into materials (Sandå Sverige AB, 2019). The reason for using Sandå instead of a company that Ihus has worked with is that none of those companies has any public information about emissions. 5 litres of paint cost between 250 and 1,200 SEK (Byggahus.se, 2017), but for this calculation, one can was estimated to 1,000 SEK. Assuming half of the material used by Sandå consist of paint, the number of paint cans would be 143,782 cans. The total emission for paint would then be 1,952.56 tonnes CO2e. According to their sustainability report for 2019, Sandå had 1,546 employees and the emissions from transports were 1.45 tonnes CO2e /per employee (Sandå Sverige AB, 2020) which results in 2,241.7 tonnes CO2e from all employees and transports. Assuming these numbers are representative for both 2018 and 2019, the total emissions from both transport and paints were 4,194.26 tonnes CO2e for Sandå during 2019.
4.2 Gardening
For calculating the emission intensity for the category gardening, the company Trädgårdsanläggare Hallbloms was used as a template. In the contracts between Ihus and Hallboms, the tools and vehicles used are specified. Each type of vehicle or tool was assigned an emission.
12
Cars and light trucks have an upper limit of 200 and 250 g CO2e/km respectively according to the contracts and were assumed to drive between Hallbloms and Ihus two times a day. Heavy trucks were assumed to be over 3.5 tonnes without trailers with diesel engines. They have an emission of 0.5 kg CO2e/km (Wisell, et al., 2015). They were assumed to drive between Hallbloms and Ihus 1.5 times a day. Public holidays and weekends were excluded from calculations.
A lawnmower for professional use has an emission of 830 g CO2e/kWh and 9.9 kW as rated power (Husqvarna AB, 2020). Lawnmowers were assumed to be used 3 hours per week and property for a third of the year (May 15-September 15) on Ihus’ properties.
A trimmer for professional use has an emission of 1,141 g CO2e/kWh and 1 kW as rated power (Husqvarna AB, 2020). Based on service descriptions, they are used two times a year and were assumed to be in use 6 hours each time.
A weighted average in tonnes per year was then calculated for the different numbers of vehicles and emissions. By using the revenue for Hallbloms, the emission intensity in tonnes CO2e/MSEK was calculated (Trädgårdsanläggare Hallbloms AB, 2019). It was then used together with the reported emission intensity for Svensk Markservice AB, a company Ihus worked with in 2019 (Svensk Markservice AB, 2018), to find a weighted mean value for the whole gardening category.
4.3 Cleaning and facility work
One of Ihus suppliers is Berendsen. According to their sustainability report for 2019, Berendsen stated that they emit 20.1 tonnes CO2e/MSEK (Berendsen Textil Service AB, 2020). Berendsen is a company that mostly washes textiles and is not directly comparable to a more distinctly cleaning-focused company such as Städhuset AB, another supplier to Ihus. However, the use of chemicals in detergents or cleaning agents in the work process might be similar. Since one part of Berendsen’s work is delivering the laundered textiles to and from the client, transport is also relevant for emissions calculations. As such, transport is a relevant variable for all cleaning companies.
Another company used for comparison that Ihus does not work with is Samhall, who in their sustainability report state that their total CO2e emission for 2019 for scopes 1 to 3 is 4,297 tonnes and that their total revenue for the same year is 3,050 MSEK (Samhall AB, 2020).
These two companies were used to calculate a weighted mean value for the intensity for this category. Samhall was assumed to be equivalent to the company Inspira AB, that actually works for Ihus. Ihus largest expense in this category is to Inspira.
13
4.4 Ventilation and installation
Since the aim of this report is to analyse Ihus’ daily management and maintenance work, the emissions from ventilation and similar systems are not included in the calculations. It was assumed that ventilation and heating systems are installed when a building is constructed and that the main source of emissions is electricity use, which together with heat are categories not included in this report. A big part of emissions from ventilation and installation was assumed to be the transportation of service personnel.
A supplier that has reported emissions is Assemblin AB. Their business travel
accounted for 56 kg CO2e /FTE (the full-time equivalent of an employee), electricity for 25 kg CO2e /FTE and vehicles for 1,363 kg CO2e /FTE. The sum of their emissions equals 1,443 kg CO2e/employee. The total number of employees is 5,630 employees with a revenue of 8,885 MSEK (Assemblin Holding AB, 2019).
A company similar to Assemblin is Bravida, which also performs installations and similar services. Their annual report states that their transport emits 23,634 tonnes CO2e annually (Bravida Sverige AB, 2020). Their revenue is 20,404 MSEK. Bravida only discloses scope 1 and does not disclose any other specifications of their emissions.
4.5 Renovations
A large spending post for Ihus can be found in renovations, which was considered a part of daily management, while new construction was not. To calculate an emission
intensity for renovations it was necessary to start in construction. A report from White arkitekter about new buildings says that building a new house generates 189 kg CO2e/m2 Atemp, where Atemp means that it only includes areas that are heated to more than 10°C (Hedén & Sande Beiro, 2019). This is distributed as 89% production of materials representing A1-A3 in an LCA, 10% transports representing A4, and 1% production, representing A5, and equals a total amount of emissions at 2,099 tonnes CO2e. The area for the new building used for their calculations was estimated to 11,106 m2.
Given that Ihus does mostly smaller renovations and tenant adjustments, some of the emissions were not considered when translating the results from the report by White arkitekter. The included emission values were for wood, Styrofoam, HDF, mineral wool, steel girders, and the category “other”. The materials for the frame, outer wall, and cellar were not considered. This resulted in the emissions from material in renovation being around 26% of the material for a new construction.
The emissions for transport was adjusted to exclude transportation for the groundwork, which was assumed unnecessary for renovations, leaving 108 tonnes CO2e. It was also assumed that the production stage, A5, emits equal amounts for new buildings as for renovations, 20 tonnes CO2e. These are both values for 26 months (Hedén & Sande
14
Beiro, 2019) but to be consistent with the other results, it was calculated over a year. As such, the sumtotal of emissions from renovations is 604.8 tonnes CO2e. By dividing this with the area that was built the emission per area was found to be 54.5 kg CO2e/m2 and year. By multiplying this number with the total area renovated by Ihus in 2019 the total emissions for this category was calculated.
4.6 Materials and products
Many of Ihus’ suppliers in the materials and products category are smaller, local companies. None have reported emissions on their website nor provided relevant information when contacted. To be able to calculate an emission intensity, the company Jula has been assumed to be representative. According to their sustainability report for 2018, they emit 144 tonnes CO2e per employee (Jula AB, 2019). Jula AB has 2,791 employees according to their annual report and revenue of 6,982 MSEK (Jula Holding AB, 2019). Since the list of companies that Ihus has worked with during 2019 includes some metal and steel companies, lamp stores, and furniture stores, it is assumed that Jula with its wide range of products is representative.
5. Results
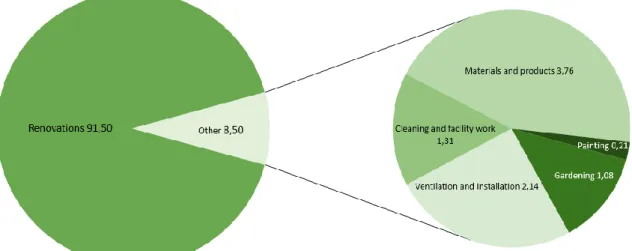
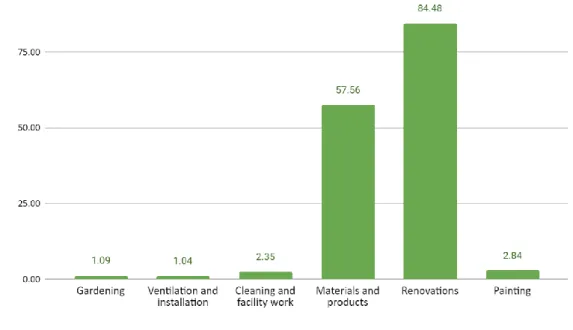
The calculations and data processing described in the fourth chapter led to the results for the different emission intensities shown in table 1. Ihus’ emissions for each category were calculated by multiplying the emission intensity with the cost of that category and is presented as a percentage of Ihus’ total emissions in facility management. In figure 2, the distribution of Ihus’ total emissions in facility management is shown. Figure 3 shows the emission intensities for each category.
15
Table 1. Results for emission intensities and total emissions for Ihus’ spending in different categories. Category Expenses (MSEK) Emission intensity (tonnes CO2e/MSEK) Total emissions (tonnes CO2e) Emission distribution (%) Gardening 5.17 1.09 5.63 1.08 Ventilation and installation 9.16 1.05 11.28 2.17 Cleaning and facility work 2.90 2.35 6.82 1.31 Materials 0.34 57.56 19.57 3.76 Renovation 5.63 84.48 476.00 91.47 Painting 0.38 2.84 1.07 0.21
Figure 2. Illustration of the distribution of emissions from each category of Ihus’ daily maintenance work, where the smaller categories are shown in the pie chart to the right
16
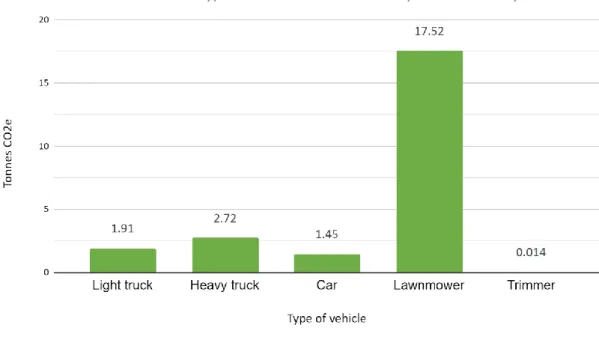
Figure 3. Emission intensities for each category.
5.1 Sensitivity analysis
All calculations are based on assumptions and different companies’ sustainability reports not necessarily comparable to Ihus’ suppliers. Because of this, our results are uncertain. To interpret the results better, a sensibility analysis has been performed.
5.1.1 Painting
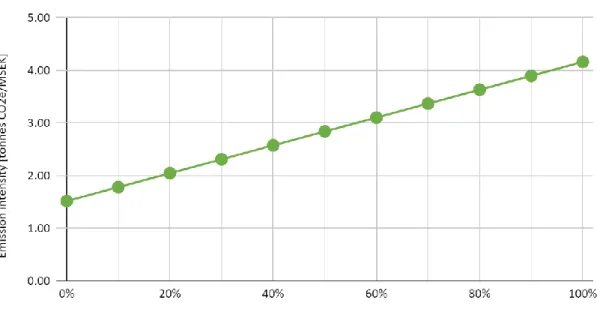
When calculating the emission intensity for the category painting it was assumed that paint was 50% of all material used. By instead assuming 40%, which would be a reduction of material use of 20%, the emission intensity was reduced from 2.84 to 2.58 tonnes CO2e/MSEK. which corresponds to a reduction of 9.15%. This shows that small errors do not grow exponentially throughout the calculations. These kinds of
calculations make assumptions necessary, in this case assuming the price of paint as well as the amount used. These are assumptions made by the authors of this report, unlike the emissions for paint. The advantage of this method is that it is easy to go back and change values when more information is made available, which makes it easier to correct assumptions. Figure 4 shows emission intensities for paint as different
percentages of material usage. Even though the estimation that paint accounts for 50% of material use might be incorrect, the final emission intensity only varies between 1.52 and 4.16 tonnes CO2e/MSEK. An easy approximation of the curve is to the equation of a straight line for the first and last data point, which results in a slope of 2.64. This
17
indicates that a 10% increase in material usage does not mean a 10% increase in emission intensity.
Figure 4. Emission intensities calculated for paint as different percentages of material usage with a slope of 2.64.
5.1.2 Gardening
The calculations for the category gardening were based on the number of each type of vehicle Hallbloms mentioned in their service description. Svensk Markservice AB might have more heavy trucks than Hallbloms. If instead the vehicles were half heavy trucks, half lawnmowers instead of multiple cars, the emission intensity for gardening would be 3.03 tonnes CO2e/MSEK, which is almost triple the original emission intensity. This shows that it is important what types of vehicles are used – by avoiding usage of heavier vehicles and planning journeys, CO2e emissions can be reduced. Ihus spends more than 16 times the amount of money on this category compared to painting, and the 300% increase in intensity therefore has a much bigger impact on the total emissions. For better visualisation of the differences, see figure 5.
18
Figure 5. Emissions from different types of vehicles expressed in tonnes CO2e/vehicle
and year. Trimmers are categorised as vehicles for simplicity.
5.1.3 Cleaning and facility work
In this calculation the two companies included have very different intensities. To
calculate the intensity of this category, the distribution of the other companies (appendix A) was assumed to be the same as between Inspira and Berendsen. If, instead, the other companies included in this category all had the same intensity as Berendsen this would result in total emissions of 8.8 tonnes CO2e instead of 6.8 tonnes CO2e. This shows that even though Berendsen has a much higher intensity (20.1 CO2e/MSEK) compared to Inspira’s representative company, Samhall, (1.4 CO2e/MSEK) it does not make a significant difference since the expenses were not evenly distributed.
5.1.4 Ventilation and installation
The emissions reported by Bravida only accounted for transports and thus scope 1 emissions. Assemblin disclosed all their scopes in their calculations which gives a better view of their emissions. For Assemblin, scope 2 and scope 3 (electricity and business travel) accounted for 5.94 % of their total emissions. If this percentage is added to Bravida for a representation of their scope 2 and scope 3, their total emissions result in 25,038 tonnes CO2e for one year. Application of this number and recalculation of the emission intensity results in 1.07 tonnes CO2e/MSEK. This is an increase of 0.02 tonnes CO2e/MSEK and results in new total emissions of 11.52 tonnes CO2e for Ihus in this category. This results in increased emissions for Ihus, but the difference compared to earlier calculations is less than 1%, which could mean that the biggest emissions from this category originate in scope 1 from transport, not scope 2 and 3.
19
5.1.5 Renovations
There are many uncertainties when it comes to renovations since performed work can differ greatly. In this report it has been calculated based on assumptions regarding material used, and how that differs between renovation and new constructions.
In the calculations, it is assumed that renovations require 26% of the amount of material used in new productions. If it were assumed that waste disposal accounts for about as much emission as material and thus twice the amount of material would be required, the emissions would increase from 476 tonnes CO2e to 904 tonnes CO2e. Since most of the emissions are material-related, this change has a significant impact on the results for the total emissions and demonstrates the importance of monitoring the amount of used and discarded material.
5.1.6 Materials and products
Very few companies have reported any emissions that can be categorised as materials or products, which have made it difficult to find an emission intensity for this category. Therefore, it has not been possible to perform a sensitivity analysis on Jula’s numbers.
6. Discussion
This section will begin with a discussion of uncertainties in the performed calculations. It will be followed with a discussion of the results and end with a discussion of what action Ihus can take for lowering their emissions.
6.1 Uncertainties in the calculations
The uncertainties of this study lie within what data has been available for analysis, both from Ihus and from their suppliers or other companies that are representative of the suppliers. This is partly because there are big differences in how companies report data on sustainability within their organisation
One big margin of error is that in the case where a service description has been used, it is not clear enough to perform a complete analysis on it. In one case the wording is that a certain service will be performed when it is “deemed necessary”, which makes it difficult for Ihus to know how many times or how often that service is performed. Another problem is that only some parts of the business are available for analysis. An example is the calculations of the gardening company Hallbloms, where only the spring, summer, and autumn work was available since no data regarding snow clearance was included. The reason for not including snow clearance was that no vehicles or machines of that type were mentioned in the service description. Therefore, it was assumed that trucks or tractors are equipped for snow clearance during the winter months, which does not significantly affect the emission intensity.
20
The contents of sustainability reports vary greatly between companies, and many companies have no public reports. For example, in the ventilation and installation category, Assemblin reported their business travel, electricity, and transportation, while the similar company Bravida only reported their transports. This was considered in the sensitivity analysis and determined to not affect the result in a significant way in this case. Although it did not have a large impact on this category’s results, it might in categories where the contents of scope 2 and 3 play a larger part. To break down exactly how companies report their scopes is difficult, and this especially applies to scope 3 since it is not included in the requirements for a company’s sustainability report. Those that have reported scope 3 might for example have reported business travel by plane which is not representative for a small or local company.
Most of the calculations are based on data reported by companies. Companies report their emissions for the scopes differently, especially scope 3. One problem with the reporting of emissions is that if a company makes fewer assumptions and more thorough calculations, it will most likely look like they have higher emissions than an identical company that does not do as extensive calculations. Long-term, it could result in that the second company is praised for its sustainability work. Inconclusive or
incomplete numbers or calculations could be problematic to use as groundwork for new theories or conclusions. To produce this report’s results this issue has been considered continuously.
6.2 Emission intensities
It was expected that renovation would have a big impact, but the emissions from materials and products are slightly higher than expected. As seen in figure 2 in the results section, renovation is the part of Ihus’ business which generates the most emissions at 476 tonnes CO2e. This is also the category with the highest emission intensity, of 84.48 tonnes CO2e/MSEK. The explanation for this is that renovations contain many parts where avoiding emissions is difficult. Renovations will lead to the use of new materials, transport, waste, and depending on when the building was built or last renovated the materials used are not necessarily chosen with consideration for emissions. When the construction of a new building is planned there are many options, for example regarding the frame and how much cement to use, which can lower the building’s emissions. When the building is already standing, on the other hand, the possibilities are fewer.
The category materials and products have the second-highest emissions and emission intensity, with total emissions of 19.57 tonnes CO2e and intensity of 57.56
CO2e/MSEK. This could be explained by the storing and transportation of goods. The materials and products category consist of smaller purchases of building equipment and products. These products need to be transported from their production sites - which can be located all over the world - to warehouses and then be transported from the
21
warehouses to Ihus’ facilities. The production also leads to emissions, especially if it is located in a country where the energy mix generates more emissions.
For the cleaning and facility work category, two companies were used to calculate an emission intensity, namely Berendsen and Samhall. The intensities for these two differ quite a lot; Berendsen reported 20.1 CO2e/MSEK, Samhall 1.4 CO2e/MSEK. This could be explained by the fact that the companies do very different things while still within the category’s limits. Berendsen deals with cleaning textiles and Samhall does all kinds of facility work. Berendsen’s emissions mostly come from transport and bought textiles (Berendsen Textil Service AB, 2020) while Samhall’s emissions mostly come from their energy production and their vehicles (Samhall AB, 2020). Since textiles and transporting textiles are Berendsen’s core, this results in big emissions. Samhall, on the other hand, does lots of things that is not just transportation and production of their energy, which makes these emissions smaller compared to their revenue.
A key to determine the energy consumption of a building is ventilation, but the
decisions to lower emissions from this area are taken at the beginning of a project rather than during the continuous work, which makes this category relatively small in this report. In this report, electricity use and production of ventilation systems have not been considered part of maintenance. Therefore, emissions connected to maintenance
originate mostly from transports.
In their annual report, Vasakronan writes that waste from renovations varies between 32 kg CO2e /m2 to 77 kg CO2e /m2 depending on what buildings were renovated
(Vasakronan, 2020). While this reflects well upon our calculations based on the project
A Working Lab by White Arkitekter (Hedén & Sande Beiro, 2019), it only represents
waste disposal. Another student report from Linköping University showed that renovation and waste disposal from renovation of apartment buildings emit 18.74 kg CO2e/m2 (Barkö & Godtland, 2018). A third report, written on the new construction of Blå Jungfrun, stated that the emission intensity during the construction phase was 350 kg CO2e/m2 (IVA & Byggindustrier, 2014). From these different values of a
renovation’s emissions, it can be understood that the emissions from a renovation or construction project are difficult to determine and can vary greatly between different projects. The selection of materials, for example, can have a big impact on the total emissions. To determine exactly how much a certain project emits an LCA needs to be performed on that project.
6.3
Ihus’ road towards climate neutrality
Sustainable public procurement can be used to require a certain level of environmental sustainability in purchases. If the procurement can require an LCA or an EPD there can be a better assessment of the entire lifecycle of the product or service to be purchased. Requiring certain levels of environmental awareness and life-cycle perspective from suppliers could help Ihus obtain a more detailed picture of where the most greenhouse gas emissions are generated. Some more detailed requirements can refer to the use of
22
environmentally friendly paint, electric tools and machines, or certain criteria on the transports from the supplier. One example would be that Ihus currently demands that cars used by the gardening company Hallboms have an upper limit of 200 g CO2e/km. From the beginning of 2020, the European Union provides a goal for Europe’s vehicle fleet of 95 g CO2e/km for newly produced passenger cars and classifies a ZLEV (zero- and low-emission vehicles) as under 50 g CO2e/km, which is significantly lower than 200 g CO2e/km (European Parliament; Council of the European Union, 2019).
To reach climate neutrality and lessen the impact a company has on the environment there is a possibility to use carbon offsets. In Ihus’ case, their head of sustainability has decided that Ihus will not use carbon offsets to reduce their climate impact (Rushdi Al-Sálehi, 2020). Instead, they want to use methods that focus on the sources of the emissions.
A large spending post for Ihus is gardening since many properties have some green areas. The calculations showed that especially lawn mowers have a large impact on the total amount of emissions in the gardening category. This is not new information but part of a field with multiple studies. One example is a study from Sveriges
Lantbruksuniversitet, SLU, showed that different types of grass and other plants have different impacts on the environment, especially if one of them requires lawn mowing and not the other (Gamberg, 2013). A typical grass lawn also requires watering, which is a topic that has not been covered in this report. One way of lowering the impact of gardening is to convert lawns to meadows, which significantly reduces the need for lawn mowers and increases biodiversity, however meadows cannot withstand as much wear and tear as a lawn (Gamberg, 2013). Depending on the use of existing lawns and the soil conditions, it could be beneficial to turn them into meadows.
To lower the emissions from ventilation, it is important to be thorough when planning the transports. Using a local company to maintain the ventilation system reduces the distance travelled by car. If the ventilation works well and does not need constant maintenance, it will also decrease the need for transportation and lower emissions. If there is a choice between a low-maintenance system and high-maintenance system, it might be beneficiary to choose the former.
Depending on what kind of renovation is done, the emissions will vary. If the base is part of the renovation and new materials in concrete are added, it has a large impact compared to if the renovation consists of carpet paving. It is clear that more information about different types of renovation is needed, and we recommend that Ihus perform LCA:s on renovation aspects of their buildings. It is only then further action can be taken towards minimising emissions and reaching climate neutrality.
As shown above, it is more expensive emission-wise to construct new buildings than to renovate already existing ones. One key to lower emissions long-term is extensive planning. Another is to reuse materials as much as possible since a big emission post is waste disposal of building materials (Johansson, et al., 2017). By using different
23
documentation standards such as Byggvarubedömningen (BVB) it is possible to know the products and materials used in a building, which simplifies the renovation process and makes it easier to know what parts can be reused or recycled.
The materials and products category have a high intensity and even though it is rather small in spending, its total emissions are quite high. When it comes to products, the best way to purchase is to buy products approved by an environmental organisation like BVB or Svanen. It is also effective to use less products and material if possible. By investing in products and materials which have a longer lifetime and/or can be recycled, the emissions of this category can be lowered. The type of material used has a big impact on how much emissions are generated. Cement, for example, is more
complicated to recycle or reuse than wood (Johansson, et al., 2017), which could be a reason to try to use more wood instead of cement even if it means newer, perhaps more complicated construction methods.
A common feature across all categories is the large transport-related emissions. One key to lower Ihus’ total emissions is planning their transports and limiting the emissions generated by these and demanding that their suppliers do the same. Products that travel far will lead to more emissions, and by being aware of where the purchased products are produced it is possible to make informed decisions about what products to use.
24
7. Conclusion
This study divided Ihus’ management daily work into the six categories painting, gardening, cleaning and facility work, ventilation and installation, renovation, and materials and products. It did not consider electricity, heating and waste disposal as daily maintenance since those have already been studied for Ihus’ business.
The emission intensities for all categories were obtained in this study, but the accuracy varied since some estimations were based on actual service descriptions from Ihus while others were calculated from other companies’ sustainability reports.
The biggest source of emissions was by far renovation, which was found to have an emission intensity of 84.48 tonnes CO2e/MSEK and a total emission of 476 tonnes CO2e during 2019. It was followed by materials and products which generated 57.56 tonnes CO2e/MSEK. Since it was a smaller spending post, the total emission from that category was calculated to 19.57 tonnes CO2e. Remaining categories had intensities below 3 tonnes CO2e/MSEK and were smaller spending posts.
This study also identified which part of the business was responsible for the most emissions and which generated the most compared to the money spent. It discussed several possible solutions to help Ihus towards climate neutrality and the goals of the 2030 Agenda, including performing life cycle assessments for renovations and that decreasing and optimising transports is key.
We want to thank everyone who has helped us with this project!
Special thanks to:
Umar Hanif Ramadhani, our supervisor at Uppsala University
Robin Rushdi Al-Sálehi, our external contact and head of sustainability at Ihus
26
References
Assemblin Holding AB, 2019. Årsredovisning, Stockholm: Assemblin Holding AB. Barkö, J. & Godtland, M., 2018. Hållbar renovering, Norrköping: Linköping University.
Berendsen Textil Service AB, 2020. Hållbarhetsrapport 2019, Malmö: Berendsen Textil Service AB.
Bergström Bostner, A. et al., 2018. Ett klimatneutralt IHUS 2030, Uppsala: Uppsala universitet. Bolagsverket, 2019. Bolagsverket: Hållbarhetsrapport. [Online]
Available at:
https://bolagsverket.se/ff/foretagsformer/aktiebolag/arsredovisning/delar/hallbarhetsrapport -1.17962
[Accessed 4 Maj 2020].
Bravida Sverige AB, 2020. Årsredovisning inklusive hållbarhetsrapport 2019, Stockholm: Bravida Holding AB.
Byggahus.se, 2017. Vad kostar det att måla fasaden?. [Online]
Available at: https://www.byggahus.se/renovera/vad-kostar-mala-fasaden [Accessed 4 May 2020].
Byggvarubedömningen, 2019. Byggvarubedömningen. [Online]
Available at: ttps://byggvarubedomningen.se/globalassets/bedomningar/kriterier-5.0.pdf [Accessed 20 April 2020].
Cames, M. et al., 2016. How additional is the clean development mechanism, Berlin: Öko-Institut .
Carlén, B., 2007. Sveriges klimatpolitik: värdet av utsläppshandel och valet av målformulering, Stockholm: Finansdepartementet, Regeringskansliet.
CDP, n.d. What we do: CDP. [Online]
Available at: https://www.cdp.net/en/info/about-us/what-we-do [Accessed 28 April 2020].
Ecometrica, 2012. Ecometrica. [Online]
Available at: https://ecometrica.com/assets/GHGs-CO2-CO2e-and-Carbon-What-Do-These-Mean-v2.1.pdf
[Accessed 5 Maj 2020].
Effort, n.d. Lagen om hållbarhetsredovisning. [Online]
Available at: https://www.effort.se/blogg/lagen-om-hallbarhetsredovisning-varfor-vem-vad/ [Accessed 4 Maj 2020].
27
European Parliament; Council of the European Union, 2019. Regulation (EU) 2019/631 setting CO2 emission performance standards for new passenger cars and for new light commercial vehicles, and repealing Regulations (EC) No 443/2009 and (EU) No 510/2011. Official Journal of the European Union, Volume 62, pp. 13-53.
Gamberg, M., 2013. Omföring från gräsmatta till äng - fördelaktigt i urban och semiurban miljö?, Alnarp: Sveriges Lantbruksuniversitet.
Gervasio, H. & Dimova, S., 2018. Model for Life Cycle Assessment (LCA) of buildings, s.l.: European Commission .
Gibbens, S., 2019. What are carbon offsets? Here’s why travelers are buying them. [Online] Available at: https://www.nationalgeographic.com/science/2019/12/what-are-carbon-offsets/ [Accessed 12 May 2020].
Greenhouse Gas Protocol, n.d. About Us. [Online] Available at: https://ghgprotocol.org/about-us [Accessed 15 Maj 2020].
Hafner, A. & Rueter, S., 2018. Method for assessing the national implications of environmental impacts from timber buildings—an exemplary study for residential buildings in Germany. Wood and Fiber Science, pp. 139-154.
Hedén, K. & Sande Beiro, T., 2019. Klimatberäkning under byggskedet - A Working Lab, s.l.: White arkitekter AB.
Husqvarna AB, 2020. HUSQVARNA 525LK. [Online]
Available at: https://www.husqvarna.com/se/produkter/trimmers/525lk-motorenhet/967148301/
[Accessed 4 May 2020].
Husqvarna AB, 2020. HUSQVARNA R 214TC. [Online]
Available at: https://www.husqvarna.com/se/produkter/akgrasklippare/r-214tc/967846901/ [Accessed 4 May 2020].
Ihus, 2017. Om Ihus. [Online]
Available at: https://ihus.nu/om-ihus/ [Accessed 13 May 2020].
IPCC, 2013. Climate Change 2013: The Physical Science Basis. Contribution of Working Group I to the Fifth Assessment Report of the Intergovernmental Panel on Climate Change, Cambridge, United Kingdom and New York, NY, USA: Cambridge University Press.
IVA & Byggindustrier, S., 2014. Klimatpåverkan från byggprocessen, Stockholm: Kungl. Ingenjörsvetenskapsakademien (IVA).
IVL Svenska Miljöinstitutet, n.d. Miljövarudeklarationer (EPD). [Online] Available at:
https://www.ivl.se/sidor/vara-omraden/hallbara-28
vardekedjor/miljovarudeklarationer-epd.html [Accessed 13 Maj 2020].
Johansson, P. et al., 2017. Kvalitet hos byggnadsmaterial i cirkulära flöden, Borås: RISE Reasearch Institutes of Sweden.
Jula AB, 2019. Hållbarhetsredovisning 2018, Skara: Jula AB. Jula Holding AB, 2019. Årsberättelse 2018, Skara: Jula Holding AB. Klimatordlista, 2010. Klimatordlista: Klimatneurtral. [Online] Available at: http://www.klimatordlista.se/klimatneutral/ [Accessed 21 April 2020].
Newlife Paints ltd, 2012. Carbon Impact of Waste Paint – The Stats!. [Online]
Available at: http://www.newlifepaints.com/carbon-impact-of-waste-paint-the-stats [Accessed 24 April 2012].
Rushdi Al-Sálehi, R., 2020. Meeting 2 [Interview] (6 April 2020).
Samhall AB, 2020. Års- & hållbarhetsredovisning 2019, Stockholm: Samhall AB. Sandå Sverige AB, 2019. Årsredovisning och Koncernredovisning för Sandå Sverige AB, räkenskapsåret 2018, Danderyd: Sandå Sverige AB.
Sandå Sverige AB, 2020. Hållbarhetsredovisning 2019, s.l.: Sandå Sverige AB. Sustainable Facilities Tool, n.d. Life Cycle Assesment (LCA) Overview. [Online] Available at: https://sftool.gov/plan/400/life-cycle-assessment-lca-overview [Accessed 20 April 2020].
Svensk Markservice AB, 2018. Hållbarhetsrapport 2017, s.l.: Svensk Markservice AB. The Greenhouse Gas Protocol, 2004. A Corporate Accounting and Reporting Standard, Conches, Geneva and Washington, DC: World Business Council for Sustainable Development; World Resources Institute.
The Greenhouse Gas protocol, 2011. Product life cycle accounting and reporting standard, WA, USA: World Resources Institute.
The National Agency for Public Procurement, 2016. Why sustainable procurements. [Online] Available at:
https://www.upphandlingsmyndigheten.se/en/sustainable-public-procurement/why-sustainable-procurement/ [Accessed 13 Maj 2020].
The National Agency for Public Procurement, 2017. Upphandlingsmyndigheten: Public Procurement. [Online]
Available at: https://www.upphandlingsmyndigheten.se/en/publicprocurement/ [Accessed 19 April 2020].
29
Trädgårdsanläggare Hallbloms AB, 2019. Årsredovisning 2018/2019, Uppsala: Trädgårdsanläggare Hallbloms AB.
United Nations, 2015. Transforming our world: the 2030 agenda for a sustainable development, s.l.: United Nations.
United Nations, n.d. The Sustainable Development Agenda. [Online]
Available at: https://www.un.org/sustainabledevelopment/development-agenda/ [Accessed 17 April 2020].
Uppsala Climate Protocol, n.d. The Uppsala Climate Protocol – A local climate agreement between the private and public sectors. [Online]
Available at: https://klimatprotokollet.uppsala.se/om-klimatprotokollet/in-english/ [Accessed 17 April 2020].
Vasakronan, 2020. Årsredovisning 2019, Stockholm: Vasakronan.
Wisell, T. et al., 2015. Översyn och uppdatering av emissionsfaktorer för Naturvårdsverkets underlag för beräkning av koldioxidutsläpp i rapportering enligt miljöledningsförordningen. [Online]
Available at:
https://www.naturvardsverket.se/upload/stod-i-miljoarbetet/vagledning/miljoledning/pm-co2-schabloner-170116.pdf [Accessed 4 May 2020].
VitalMetrics Group, 2020. Sustainability Spend Analysis. [Online] Available at: https://www.vitalmetricsgroup.com/spend-analysis [Accessed 17 April 2020].
World Business Council for Sustainable Development, 2004. The Greenhouse Gas Protocol. A Corporate Accounting and Reporting Standard, Washington, DC: World Resources Institute.
30
Appendix A
List of suppliers used for calculations; category wise.
Gardening Cleaning and Facility Work
Painting Materials and Products Skånela Trädfällning AB Aremo Sanering AB Alviks Måleri I Uppsala AB AJ Produkter Svensk Markservice AB Beredsen Textil Service AB
Flügger AB Ahlsell Sverige AB
Trädgårdsanläggare Hallblom AB Inspira AB Sweline Linjemålning Skarin Jörgen service AB Skadeservice I Östhammar AB
Uppsala måleri och kakel/Hokke
Maskin & Verktyg
Städhuset AB Wärngrens Måleri K-Rauta AB
Gl Plåt AB
Lampaffären i Uppsala AB
31
Renovations Ventilation and Installation
Dematek AB ALLTEK Uppsala AB
GK Gunnar Karlsen Sverige AB Assemblin Ventilation AB
Markona AB Biozone Scientific Scandinavia
Mälardrottningens Bygg & Fastighet AB Bravida Sverige AB
Mälarlift i Västerås AB BT Ventilation AB
Projektidé AB Caverion Sverige AB
Ramböll Sverige AB Dahl Sverige AB
UFS Upplands Företagsservice AB Edekyl och värme
Upplands Schakt ek förening ELAK
Zillén Bygg Håkan AB Elektroskandia
Östuna Åkeri och Entreprenad AB Euro Teaterteknik AB
Fresh Air Ventilation i Uppsala
FSAB
Galore i Uppsala AB
Indoor energy Sweden AB
JMAB Elinstallationer AB Kvist VVS AB Mella El AB Pannpartner AB Radiator VVS AB Relita Skadeservice AB Sallén Elektriska AB Schneider Electric
32
Renovations Ventilation and Installation
Sallén Elektriska AB
Schneider Electric
Service works global nordic AB
Sibe International AB
Sv Storköksservice
Thorszelius Vent & Service AB
Upplands Energi AB Upplands Tryckluftservice AB Upplands Värmecenter AB Uppsala Elcentral AB Z-Klimat Invest AB Åke Huss AB