MODELLING BIFACIAL
PHOTOVOLTAIC SYSTEMS
Evaluating the albedo impact on bifacial PV systems based on case studies in
Denver, USA and Västerås, Sweden
ANTON NYGREN
ELIN SUNDSTRÖM
School of Business, Society and Engineering
Course: Degree Project in Energy Engineering Course code: ERA402
Credits: 30 hp
Program: M.Sc. in Industrial Engineering and
Management
Supervisor: Bengt Stridh Examinor: Hailong Li
Costumer: Mälardalen University Date: 2021-06-11
Email:
ann16019@student.mdh.se esm15004@student.mdh.se
ABSTRACT
This study aims to develop a simulation and optimisation tool for bifacial photovoltaic (PV) modules based on the open-source code OptiCE and evaluate dynamic and static albedo impact on a bifacial PV system. Further, a review of the market price development of bifacial PVs' and an optimisation to maximise energy output was conducted. Two case studies with bifacial PV modules, a single-axis tracker in Denver, USA, and a vertical and a tilted system installed at a farm outside Västerås, Sweden, were analysed in this study. The results showed that an hourly dynamic albedo value could provide more accurate simulation results of the rear side irradiance for the bifacial single-axis tracker than a static albedo value. The developed model showed an R2 accuracy of 93% and 91% for the front and rear sides, respectively, when simulated with an hourly albedo value for the bifacial single-axis tracker system. The optimisation was based on weather data from 2020. The results showed that the tilted reference system could increase its energy output by 8.5% by adjusting its tilt from 30° to 54° and its azimuth angle from 0 to -39°. In contrast, the vertical system would increase its energy output by 2.1% by rotating the azimuth angle from -90° to -66°. Conclusions that could be drawn are that bifacial PV price has closed in on the high-performance monofacial PV price the last five years and may continue to decrease in the coming years. Further, it was concluded that detailed dynamic albedo values lead to more accurate simulations of the ground-reflected irradiance. The availability of measured albedo data at the location is essential when the ground-reflected irradiance stands for a significant share of the
irradiance. It was determined that during 2020 the optimal configurations of a vertical and tilted bifacial PV system in Västerås would save 11 300 SEK by consuming self-produced electricity and earn 11 600 SEK from selling the surplus of electricity for the farm outside Västerås.
Keywords: Bifacial PV, albedo, modelling photovoltaics, solar radiation, module price, OptiCE
PREFACE
This study is a degree project in Energy Engineering at Mälardalen University in Västerås, Sweden, written by Anton Nygren and Elin Sundström during the spring semester of 2021.
The study has been conducted in cooperation with the research project Evaluation of the first
agrivoltaic system in Sweden, at Mälardalen University, with Dr Pietro Elia Campana and Dr
Bengt Stridh.
We want to thank both Pietro Campana and Bengt Stridh for their guidanceand support throughout the project. Your insightful feedback has helped us improve our work.
Further,
we would like to thank our examiner Hailong Li for his valuable suggestions and
comments during the progress of our thesis.
We also want to acknowledge and thank Dr Bill
Marion, Dr Silvana Ayala Pelaez, Dr Chris Deline, and the National Renewable Energy
Laboratory for providing data in the data hub DuraMAT. Finally, we thank our classmates
that have provided us with insightful opposition during this spring.
Västerås in June 2021
SUMMARY
Solar photovoltaics have increasingly become a vital renewable energy source globally. New technical innovations such as bifacial PV modules show good energy return also using the rear side of the module to receive irradiance. Previous research has identified the difficulties in simulating the energy generation from the rear side due to illumination variation. The rear side of tilted bifacial PV modules is dependent on the ground-reflected irradiance. The dependency enforces the importance of simulation with a precise value of the ground surface reflectivity, also called albedo. This study aimed to develop a model to simulate the
performance of bifacial PV modules and assess the impact of the grounds' albedo value. Also, the study aimed to evaluate which tilt and azimuth angle maximises the energy output of two bifacial PV systems in Västerås, Sweden.
A literature study was made to research the market price development of bifacial PV
technologies and previous studies within bifacial PV. The literature study contributed to the mathematical framework for the developed model by exploring equations from scientific research and the open-source library PVLIB ToolBox. The developed model was based on the open-source model OptiCE in Matlab. The optimisation was achieved with the built-in genetic algorithm in OptiCE. Two case studies were used during this study: a bifacial single-axis tracker system in Denver, USA, and two recently installed bifacial PV systems (one tilted and one vertical) at a farm in Västerås, Sweden. Only measurements for the system in Denver was available, which limited the validation of the developed model to the single-axis tracker system.
The main result of this study shows that a mathematical model for bifacial PV modules has been developed that can simulate both the received front and rear irradiance and energy output. The model was validated to measurements of front and rear irradiance for the bifacial single-axis tracker system. The R2 accuracy of the model with hourly albedo was 93% and 91% for the front and rear side, respectively. PVsyst simulations with a fixed albedo showed similar precision for the front side (94%) and lower accuracy for the rear side (42%). The rear side irradiance simulations with a satellite-derived albedo value and a fixed albedo value resulted in a lower accuracy than the hourly albedo value. In contrast, the front side showed similar accuracy for all three albedo alternatives. The result was caused by the rear side receiving a significant share of ground-reflected irradiance. However, advanced
measurement equipment is required to calculate hourly albedo values. The optimisation result showed that the tilted reference and vertical PV systems' energy generation could increase by 8.5% and 2.1%, respectively, compared to the installed configurations. The literature study showed how the price of bifacial PV modules had decreased over the last five years, thus increasing the competitiveness against monofacial PV modules.
The conclusion was drawn that when the ground-reflected irradiance is a large share of the irradiance, a dynamic albedo value is necessary to achieve an accurate simulation result. With optimal angles would the farm in Västerås, Sweden, save 11 300 SEK from
self-consuming produced electricity and earn 11 600 SEK in selling electricity 2020 (total capacity of 34.64 kW). However, the optimisation result should be regarded cautiously since the developed model is not validated against the systems at the farm.
SAMMANFATTNING
Solceller har alltmer blivit en väsentlig global förnybar energikälla. Nya tekniska innovationer som tvåsidiga solcellsmoduler påvisar god energiavkastning till följd av baksidans förmåga att ta emot solinstrålning. Tidigare studier har identifierat svårigheter inom simulering av energigeneration från baksidan på grund av ljusvariationer. Baksidan på tvåsidiga solcellsmoduler är beroende av markreflekterad Detta stärker vikten av
simuleringar med korrekt värde på markens reflexionsförmåga, även kallad albedo. Syftet med denna studie var att utveckla en modell för att simulera tvåsidiga solcellsmoduler och utvärdera effekten av markens albedo. Samt var syftet att utvärdera vilka lutnings- och orienterings vinklar som maximera elproduktionen för två tvåsidiga solpanelssystem i Västerås, Sverige.
En litteraturstudie genomfördes för att utforska marknadsprisutvecklingen för tvåsidiga solcellsteknologier och tidigare studier inom tvåsidiga solcellsmoduler. Litteraturstudien bidrog till det matematiska ramverket för den utvecklade modellen genom att använda ekvationer från vetenskaplig forskning och öppna källbiblioteket PVLIB ToolBox. Den utvecklade modellen var baserad på den öppna källkoden OptiCE i Matlab. Optimeringen uppnåddes genom en inbyggd genetisk algoritm i OptiCE. Två fallstudier användes i denna studie: ett tvåsidigt 1-axlig solföljningssystem i Denver, USA, och två fast installerade tvåsidiga solpanelssystem (ett lutat och ett vertikalt) på en gård i Västerås, Sverige. Endast driftdata för systemet i Denver vad tillgängligt, vilket begränsade valideringen av den utvecklade modellen till 1-axliga solföljningssystemet.
Det huvudsakliga resultatet av denna studie är att en matematisk modell för tvåsidiga solcellsmoduler har utvecklats som kan simulera både framsidan och baksidans mottagna instrålning och elproduktion. Modellen validerades mot mätningar av fram- och
bakinstrålning för det tvåsidiga 1-axliga solföljningssystemet. R2 precisionen för modellen med tim-albedo var 93% för framsidan och 91% för baksidan. PVsyst simuleringar med ett konstant albedovärde visade liknande precision för framsidan (94%) och lägre precision för baksidan (42%). Simulering av baksidans instrålning med satellit-hämtade albedovärden och konstant albedovärde resulterade i lägre exakthet än med tim-albedovärden. I motsats till, visade framsidan liknande exakthet för alla tre alternativ. Resultatet beror av att baksidan mottar en signifikant andel markreflekterad instrålning. Däremot, avancerad mätutrustning är nödvändig för att beräkna tim-albedovärden. Optimeringsresultatet visade att det lutade och vertikala PV systemens elproduktion kunde öka med 8,5% respektive 2,1% jämfört med de installerade konfigurationerna. Litteraturstudien visade att priset för tvåsidiga
solcellsmoduler har minskat under de senaste fem åren, således ökar konkurrenskraften mot ensidiga solcellsmoduler.
Slutsatsen drogs att när markreflekterad instrålning är en stor del av instrålningen är ett dynamiskt albedovärde väsentligt för att åstadkomma tillförlitliga simuleringsresultat. Med optimala vinklar skulle gården i Västerås, Sverige, spara 11 300 SEK i att konsumera
egenproducerad elektricitet och tjäna 11 600 SEK i att sälja överskottselektricitet (total kapacitet på 34.64 kW). Optimeringsresultatet borde dock beaktas varsamt eftersom den utvecklade modellen inte är validerad mot systemen på gården.
CONTENT
1 INTRODUCTION ...1 1.1 Background ... 1 1.2 Problem definition ... 3 1.3 Purpose ... 3 1.4 Research questions ... 31.5 Scope and delimitations ... 4
2 METHOD ...5
2.1 Literature study ... 5
2.2 Developing and validating the model ... 5
2.3 Evaluation of the impact of albedo value ... 7
2.4 Find and evaluate optimal configurations for Kärrbo Prästgård ... 7
3 LITERATURE STUDY ...9
3.1 PV technologies ... 9
3.1.1 Bifacial PV ... 9
3.1.2 Cell technologies ...10
3.1.3 PV system performance metrics ...11
3.2 Market price development ...12
3.3 The albedo value ...14
3.3.1 The impact on ground-reflected irradiance ...14
3.3.2 Albedo measurements ...15
3.3.3 Albedo modelling ...15
3.4 System configurations & surrounding factors ...17
3.5 OptiCE and genetic algorithms in previous research ...18
4 MODEL AND CASE STUDIES ... 20
4.1 Model framework ...20
4.2 Front and Rear Irradiance ...21
4.2.2 Reflection losses ...22
4.2.3 Direct beam irradiance ...23
4.2.4 Diffuse irradiance ...23
4.2.5 Ground-reflected irradiance...25
4.3 Power generation ...29
4.4 NREL BEST field ...30
4.4.1 Hourly, satellite-derived and fixed albedo ...31
4.5 Kärrbo Prästgård ...32
4.5.1 Hourly and fixed albedo ...33
4.5.2 Optimisation of system configurations ...34
4.5.3 Value of electricity ...35
5 RESULTS ... 38
5.1 Validation of the model: NREL BEST-field ...38
5.2 Albedo effect on the irradiance: NREL BEST-field ...41
5.3 Optimisation results: Kärrbo Prästgård ...43
6 DISCUSSION... 46
6.1 Market price development of bifacial PV ...46
6.2 Validation of model and evaluation of albedo ...46
6.3 Optimal configurations of Kärrbo Prästgård ...48
7 CONCLUSION ... 51
8 FURTHER STUDIES ... 52
9 REFERENCES ... 53
LIST OF FIGURES
Figure 1 Radiation on a bifacial PV module ... 2
Figure 2 Schematic flow chart of the methodology. ... 5
Figure 3 Schematic drawing of an industry-typical monofacial PERC cell and a bifacial PERC+ cell ... 9
Figure 4 Schematic drawings of the bifacial PERC+ cell in bifacial glass-glass PV modules and monofacial PV modules with a white back sheet ... 10
Figure 5 Cost gap between bifacial and conventional modules . ... 13
Figure 6 EU spot market module prices by technology ... 13
Figure 7 Cost model results for cell conversion and module assembly ...14
Figure 8 Overall model framework... 20
Figure 9 Solar irradiance components ...21
Figure 10 Angles of PV module ... 22
Figure 11 Self-shading of ground-reflected light from isotropic light. ... 26
Figure 12 Self-shading of ground-reflected light from direct (Dir) and circumsolar diffuse light (Diffcir) (own illustration, inspiration from Sun et al. (2018))... 27
Figure 13 Illustration of view factor of the shaded ground to the rear side of the module.... 28
Figure 14 Matlab code for calculating the view factor ... 29
Figure 15 Picture of the bifacial PV modules installed at NREL BEST-field ... 30
Figure 16 Albedo alternatives for seven months in 2019-2020 at NREL BEST-field. ... 31
Figure 17 Albedo alternatives from the 10th to the 15th of November 2019 at NREL BEST-field. ... 32
Figure 18 Picture of the vertical system & reference system installed at Kärrbo Prästgård. .. 32
Figure 19 Hourly albedo from Roskilde and fixed albedo from Kärrbo Prästgård, for 2020. 33 Figure 20 Hourly albedo from Roskilde and fixed albedo from Kärrbo Prästgård, for five days in June 2020. ... 34
Figure 21 Graph of the electric hourly load curve for Kärrbo Prästgård, the year 2020. ... 35
Figure 22 Monthly average spot price of electricity, the year 2020 ... 36
Figure 24 Scatterplots of front and rear irradiance with the developed model (hourly albedo
and fixed albedo) and PVsyst (fixed albedo) - NREL BEST field, for Oct-Apr ... 39
Figure 25 Irradiance components on the front and rear side of the results from the developed model with hourly and fixed albedo and PVsyst compared to the measured irradiance– NREL BEST field, for Oct-Apr ... 40
Figure 26 Scatterplots of the simulated result of front and rear irradiance with hourly, fixed and satellite-derived albedo - NREL BEST field, for Oct-Nov & Apr-Mar ...41
Figure 27 Scatterplots of the simulated result of rear irradiance with a fixed albedo of 0.15, 0.30, 0.45 and 0.60 - NREL BEST field, for Oct-Nov & Apr-Mar ... 42
Figure 28 Irradiance components on the front and rear side of the vertical system with hourly and fixed albedo for optimal and installed configurations – Kärrbo Prästgård, 2020 ... 44
Figure 29 Irradiance components on the front and rear side of the reference system with hourly and fixed albedo for optimal and installed configurations – Kärrbo Prästgård, 2020 ... 45
LIST OF TABLES
Table 1 Surface albedos ... 2Table 2 Performance metrics. ... 7
Table 3 Efficiency and bifaciality factor of c-Si cell technologies. ... 10
Table 4 Brightness Coefficients ... 25
Table 5 PV system characteristics of BEST field ... 31
Table 6 Characteristics of the installed systems at Kärrbo Prästgård. ... 33
Table 7 Boundaries of system configurations for optimisation. ... 34
Table 8 Price of components. ... 36
Table 9 Comparison of performance metrics from the developed model (hourly and fixed albedo) and PVsyst (fixed albedo) – NREL BEST field, for Oct-Apr. ... 40
Table 10 Comparison of performance metrics for hourly, fixed and satellite-derived albedo – NREL BEST field, Oct-Nov & Apr-Mar. ... 42
Table 11 Comparison of performance metrics for a fixed albedo of 0.15, 0.30, 0.45 and 0.6 – NREL BEST field, Oct-Nov & Apr-Mar. ... 43 Table 12 Result of the optimisation and the installed configurations with fixed albedo (0.2)
for 2020. ... 43 Table 13 Result of the optimisation and the installed configurations with hourly albedo for
NOMENCLATURE
Symbol Description Unit
𝑎𝑟 Angular loss coefficient -
𝐵𝐹 Bifaciality factor %
𝑐1 Fitting parameter -
𝑐2 Fitting parameter -
C Constant depending on the surface type -
𝑑 Day of the year -
E Module elevation m
F1 Circumsolar brightness coefficient -
F2 Horizon brightness coefficient -
𝑓 Fraction -
𝑓𝑖𝑗 Brightness coefficient -
𝐻 Module height m
𝐼 Diffuse horizontal irradiance 𝑊/𝑚2
𝐼0 Diode reverse saturation current A
𝐼𝐶 Current A
𝐼𝐿 light current A
𝑘 Boltzmann's constant 𝐽/𝐾
𝐿𝑠 Shadow length m
𝑚 Air mass -
𝑁𝑠 Number of cells in series -
𝑛 Ideality factor -
𝑓𝑑𝑖𝑓𝑓 Diffuse fraction -
𝑃 Power 𝑊
𝑃𝑚𝑝 Maximum power 𝑊
𝑞 Electronic charge coulomb
𝑅𝑙𝑜𝑠𝑠 Reflection loss -
𝑅𝑆 Series resistance Ohm
𝑅𝑆ℎ Shunt resistance Ohm
𝑆𝐶 Solar constant 𝑊/𝑚2
𝑇 Temperature K, °C
𝑉𝐹 View factor -
𝑉𝑆𝐴 Vertical shadow angle °
Symbol Description Unit
𝛼𝑠 Solar altitude angle °
𝛽 Surface tilt angle °
𝛾 Surface azimuth angle (0°=south, 180°=north) °
𝛾𝑠 Solar azimuth angle (0°=south, 180°=north) °
Δ Brightness parameter - 𝜀 Clearness parameter - 𝜂𝑐 Module Efficiency - 𝜃 Angle of incidence ° 𝜃𝑀 Masking angle ° 𝜃𝑧 Zenith angle ° 𝜌 Ground albedo - 𝛺𝑖 Solar geometry °
INDEX
Index Description 𝑎𝑙𝑏 Albedo / Ground-reflected 𝑏𝑒𝑎𝑚 Beam 𝑏𝑠 Black sky 𝑐𝑖𝑟 Circumsolar𝐷𝐻𝐼 Diffuse horizontal irradiance 𝑑𝑖𝑟 Direct
𝑑𝑖𝑓𝑓 Diffuse
𝐷𝑁𝐼 Direct normal irradiance
𝐸𝑥𝑡𝑟𝑎 Extra-terrestrial normal-incidence irradiance
𝐹 Front
𝐺𝐻𝐼 Global horizontal irradiance
𝑔𝑟𝑑 Ground
ℎ𝑜𝑟 Horizon 𝑖𝑠𝑜 Isotropic
𝑛𝑠 Not shaded
Index Description
𝑡𝑜𝑡 Total
𝑤𝑠 White sky
ABBREVIATIONS
Abbreviation Description
BEST Bifacial Experimental Single-Axis Tracker c-Si Crystalline Silicon
DSO Distribution System Operator
GA Genetic Algorithm
HLT Hight Load Time
IBC Interdigitated Back Contact IC Installed Configurations LCOE Levelized Cost Of Electricity
LLT Low Load Time
MAE Mean Average Error
MBE Mean Bias Error
NOCT Nominal Operating Cell Temperature NREL National Renewable Energy Laboratory OPT Optimal Configurations
PERC Passivated Emitter Rear Contact
PERL Passivated Emitter Rear Locally Diffused PERT Passivated Emitter Rear Totally Diffused
PM Performance metric
PV Photovoltaics
𝑅2 Coefficient of Determination
RMSE Root Mean Square Error
RS Reference System
SEK Swedish Krona
SHJ Silicon Hetero-Junction
SMHI Swedish Meteorological and Hydrological Institute STC Standard Test Condition
Abbreviation Description
USD US Dollar
VS Vertical System
DEFINITIONS
Definition Description
Albedo The fraction of sunlight that a surface reflects Bifacial module PV module that absorbs light from the front and
rear surface
Bifacial gain Additional rear-side yield compared to the front side
Bifaciality The ratio of the rear side efficiency to the front side efficiency
Monofacial module PV module that absorbs light from the front Specific yield The ratio between total annual energy produced
1
1
INTRODUCTION
Solar photovoltaics (PV) has become one of the fastest-growing renewable energy sources in the world. The global power generation from solar PV reached 720 TWh in 2019 and became the third-largest renewable electricity technology after hydropower and onshore wind (IEA, 2019). Improving the efficiency and cost-effectivity of PV technologies are a continuous process supported by material cost reductions and government support (Tyagi, Rahim, Rahim, & Selvaraj, 2013). Bifacial PV modules were developed to increase the power output compared to conventional monofacial PV modules since bifacial PV modules can absorb solar radiation from both the front and rear side (Cuevas, Luque, Eguren, & del Alamo, 1982). In this study, bifacial PV modules are mathematically modelled using Matlab. The developed model is based on OptiCE (n.d.) and will be used for simulations and optimisations of two bifacial PV systems.
1.1
Background
In 2020, the world market share for PV modules was dominated by monofacial modules (Fischer, Woodhouse, Herritsch, & Trube, 2021). At the same time, bifacial PV modules stood for 17% of the market share. Recent competitive projects have increased the market
confidence in bifacial PV performance (Masson & Kaizuka, 2020). By assuming that bifacial and monofacial module have similar costs, Patel, Khan, Sun and Alam (2019) found a reduction of LCOE by about 2-6% for bifacial over monofacial PV module farms at latitudes higher than 30°. Khan, Hanna, Sun and Alam (2017) add that the energy gain must be carefully balanced with the increased installation cost to ensure the investment's economic viability for a bifacial PV system. Despite higher overall installation costs, bifacial PVs' performance shows competitiveness in the market (Masson & Kaizuka, 2020). The International Technology Roadmap for Photovoltaic predicts that the market share for bifacial PV modules will increase in the coming years and go beyond 55% in 2031 (Fischer et al., 2021).
One crucial obstacle for bifacial technology is to be considered bankable1 to increase its market share. Therefore, predicting the energy yield of a bifacial PV system and comparing it to a conventional system is essential. The energy yield of a bifacial PV module compared to the energy yield of a monofacial PV module is known as the bifacial gain (Shoukry, Libal, Kopecek, Wefringhaus, & Werner, 2016). The bifacial gain of a bifacial PV module is affected by prerequisites involving the location and deployment (Rodríguez-Gallegos et al., 2018). Katsaounis et al. (2019) state that a bifacial PV system's deployment faces several challenges
2
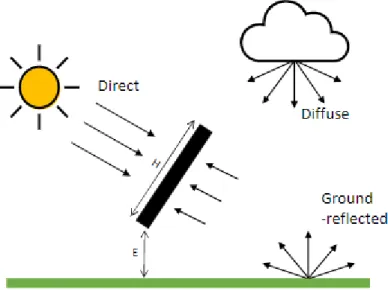
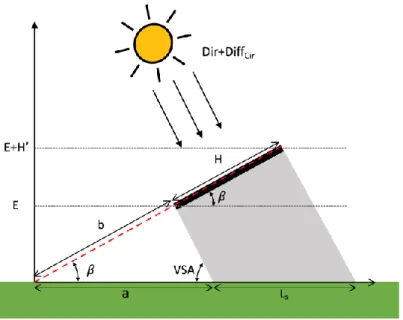
today than the conventional monofacial system. The main reason for these challenges is evaluating the field performance due to illumination variations on the rear surface. Different authors mention several parameters that aggravate the simulation of the rear surface. Both Wang et al. (2015a) and Sun, Khan, Deline and Alam (2018) state that the essential parameters are diffused radiation, ground reflectance, module elevation,
orientation, and tilt angle. The direct, diffuse and ground-reflected radiation on a bifacial PV module is illustrated in Figure 1, where E and H are the PV module's elevation and height. The albedo, or ground reflectance, is a unitless quantity that specifies the fraction of the incident sunlight that the surface reflects (National Snow & Ice Data Center, 2020). The scale varies between 0 and 1, with 0 meaning a perfect absorber and that no solar energy is
reflected.
Figure 1 Radiation on a bifacial PV module (own illustration, inspiration from Sun et al. (2018)).
The albedo value is not strictly a fixed property of a surface since the reflected fraction depends on the angular and spectral effect (Iqbal, 1983). It includes sun position, solar spectrum, diffuse and beam irradiation, season and latitude. Chiodetti et al. (2016) state that daily albedo variations can reach up to 60 % for grass between morning and noon due to the incident angle of the light. Water can also achieve much higher reflectivity depending on the angle of incidence (Shaw & Vollmer, 2017). The albedo value is also affected by what kind of surface type is present at the location and if the surface is wet or not (Hutchins, 2020a; Iqbal, 1983). Some typical values are presented in Table 1.
Table 1 Surface albedos (data taken from Climatedata (n.d.) and Iqbal (1983)). Surface type Range of albedo
Snow 0.4 - 0.9 Sand 0.4 Grassland 0.15 - 0.25 Deciduous trees 0.15 - 0.18 Coniferous forest 0.08 - 0.15 Ocean 0.07 - 0.1
3
1.2
Problem definition
Bifacial PV module technology has shown promising results in energy yield compared to conventional monofacial PV modules. Calculating the energy production gain is essential for evaluating a bifacial PV systems' profitability (Shoukry et al., 2016). However, bifacial modules have proven to be more complex in simulations due to illumination variations on the rear surface (Stein et al., 2021). Compared to monofacial PV modules, the rear side of bifacial PV modules is more dependent on ground-reflected light (Lindsay et al., 2015). Several software tools have been developed to evaluate bifacial PV performance. PVsyst is one of these tools (PVsyst, n.d.a). However, PVsyst does not recommend simulating with tilt angles over 60 degrees, and the albedo values can only be adjusted at the highest frequency each month (Mermoud & Wittmer, 2016; PVsyst, n.d.b). Chiodetti et al. (2016) point out that considering a constant albedo is not sufficient when simulating some PV applications, for example, the yield of bifacial PV modules. OptiCE software is an open-source code with a PV simulation tool. OptiCE provides flexibility for the user but does not include bifacial PV modules as a simulation option (OptiCE, n.d.). As the bifacial PV technique increases in popularity, it becomes necessary to evaluate how surrounding factors and system
configurations, such as albedo value, tilt angle and azimuth angle, influence power output. Various researches have investigated how different fixed albedo affect the energy yield of monofacial or bifacial PV systems (Sreenath, Sudhakar, & Yusop, 2021; Lindsay et al., 2015; Asgharzadeh et al., 2018). However, there is a lack of sufficient research on the impact on the power output when simulating with a dynamic albedo compared to a static albedo value.
1.3
Purpose
This study aims to develop the OptiCE model to simulate the performance of bifacial PV modules and evaluate the effect of the albedo value. Also, the aim is to assess what system configurations are most optimal to maximise the energy output.
1.4
Research questions
• Compared to monofacial PV, how have the bifacial PV market segmentation and price developed in the last five years?
• How does a dynamic albedo value affect the irradiation on a bifacial PV module compared to a static albedo value?
• How does the availability of albedo data affect the developed model performance? • What tilt and azimuth angle maximise the energy output for the bifacial PV systems in
Västerås?
4
1.5
Scope and delimitations
The developed model was limited to a single stand-alone PV module and does not include row to row shading. Due to the lack of available data from installed PV systems, the
validation was limited to the Bifacial Experimental Single-Axis Tracker (BEST) -field located at the National Renewable Energy Laboratory (NREL) Campus in Denver, Colorado, USA. The validation of model performance was based on the front and rear irradiance due to insufficient information about the installed PV modules. The data available refer to seven monitoring months, from October 2019 to April 2020.
5
2
METHOD
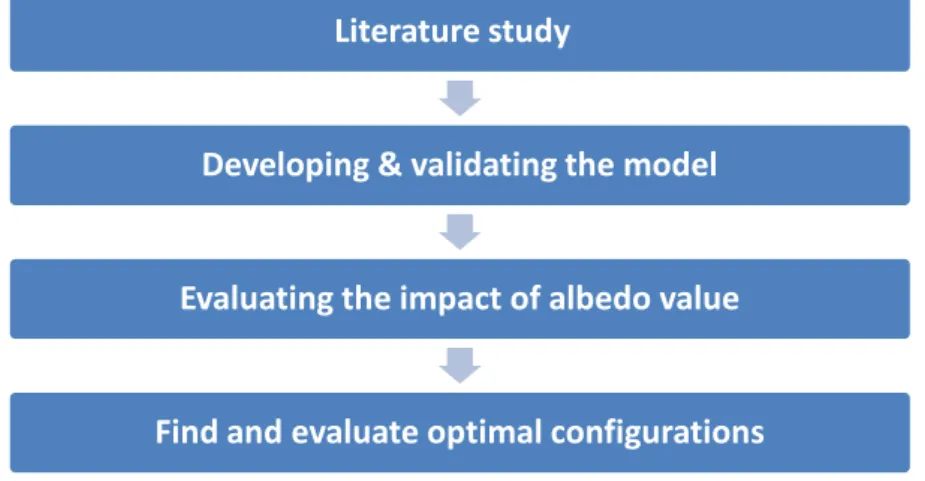
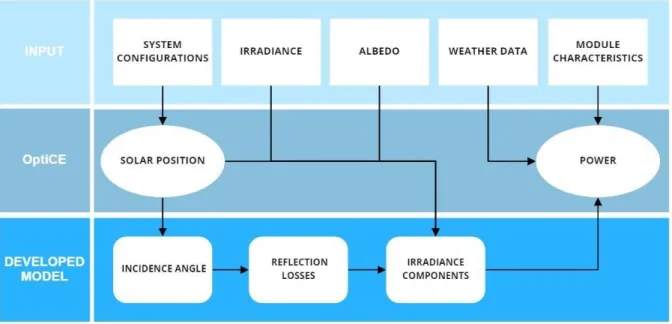
In this chapter, the model development methodology is presented. Summarised method steps are shown in the schematic flow chart in Figure 2. Since this study had a deductive approach, the first step was to develop a theoretical framework from the literature study. The
framework includes researching mathematical modelling and market development for bifacial PV. The second step was to develop the OptiCE code to include bifacial PV modules and validate the developed model. The third step was to evaluate how the albedo value affects the model performance based on three different albedo values. A case study of a bifacial PV single-axis tracker system located in Denver, USA, was used in this step. The fourth step was to analyse the optimal configurations to maximise the energy output of two installed bifacial PV system for the second case study of the farm Kärrbo Prästgård in Västerås, Sweden.
Figure 2 Schematic flow chart of the methodology.
2.1
Literature study
The literature research was based on gaining more knowledge about bifacial PV systems and the essential parameters from previously conducted research. Systematic literature research on state of the art was performed to describe the PV market development of bifacial modules. The monofacial price development was used as a comparison. The research focused on retrieving peer-reviewed information from google scholar, ScienceDirect and Primo (Mälardalen University library's search service). Keywords such as albedo, bifacial photovoltaic module, modelling photovoltaics, PV module price, PV cell technology and Matlab were used throughout this study.
2.2
Developing and validating the model
The developed bifacial PV model was implemented in the open-source code OptiCE, written in Matlab language (OptiCE, n.d.). Matlab is a software and programming language that enables mathematical and technical computations (Mathworks, n.d.a). The developed model
Literature study
Developing & validating the model
Evaluating the impact of albedo value
6
uses weather data and installation information to simulate the front and rear irradiance for a bifacial PV module. OptiCE functions and PV module parameters were used in the developed model to calculate the energy output. The developed model is further described in section 4.1 Model framework. The developed model was based on equations retrieved from PVLIB ToolBox and various scientific articles. PVLIB Toolbox is a set of open-source modelling functions available for Matlab and Python (Stein, Holmgren, Forbess, & Hansen, 2016). The Matlab version of PVLIB is available on the PV Performance Modelling Collaborative website (PVPMC Sandia, n.d.).
One site with installed bifacial PV modules was used to validate the model: the NREL Bifacial Experimental Single-Axis Tracker (BEST) field in Denver, USA. The validation was done by comparing the experimental irradiation data, measured at the site, with the model's
simulated irradiation result. The data available refer to seven monitoring months, from October 2019 to April 2020. A single-axis tracker system was included in the developed model to simulate the BEST field site. The single-axis tracker equations were retrieved from the PVLIB toolbox (PVPMC Sandia, n.d.). For the simulations at NREL BEST-field in Denver, the weather and experimental data were available at the data hub DuraMAT (Ayala & Deline, 2020a; Ayala & Deline, 2020b). The weather and experimental data included measured front and rear irradiation, sun radiation, albedo values and installation configurations, as axis rotation and azimuth angles. The validation of the model was limited to measured data of the single-axis tracker system since the two systems at Kärrbo Prästgård (another site in
Västerås, Sweden) was recently installed, and measured data was not available.
To further validate the model's performance, the result was compared with simulations in PVsyst. The software tool PVsyst enables the evaluation of different PV systems (PVsyst, n.d.c). PVsyst has developed a bifacial model for a single-axis tracker that is based on a 2D view-factor model. Asgharzadeh et al. (2019) evaluated the accuracy of PVsyst and three other bifacial irradiance models. The result indicated that the evaluated 2D bifacial models estimate the bifacial gain with about 1% absolute accuracy. PVsyst were chosen for this study due to availability.
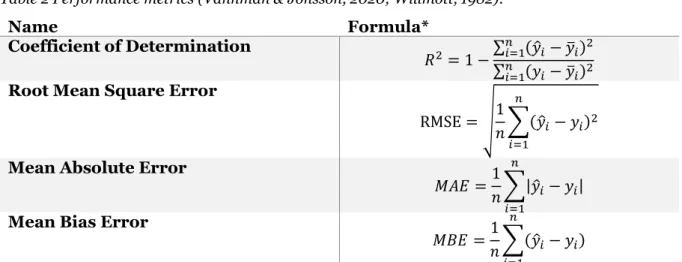
Performance metrics as 𝑅2, RMSE, MAE and MBE were used when evaluating the model
performance. Table 2 shows the formulas for the coefficient of determination (𝑅2), root mean
square error (RMSE), mean absolute error (MAE) and mean bias error (MBE). The 𝑅2 value
range from 0 to 1 (or 0% to 100%), with a higher value indicating better goodness of fit2 for the observations (Glen, n.d.; Grace-Martin, n.d.). The RMSE indicates how close the
observed data is to the predicted values and a lower value means a better fit (Grace-Martin, n.d.). The MAE is used to measure forecast accuracy, and a smaller value is usually better. However, the RMSE and MAE performance is dependent on the average value of the data. If the RMSE or MAE is much lower than the average value of the data, then the accuracy is considered better. If the RMSE or MAE is similar to the average value, the accuracy is considered inferior (Vandeput, 2019). MBE describes the direction of the error of the
7
predicted values. If it is negative, then the predicted data is, on average, underestimated compared to the measured data and vice versa (AgriMetSoft, 2019).
Table 2 Performance metrics (Vännman & Jonsson, 2020; Willmott, 1982).
Name Formula* Coefficient of Determination 𝑅2= 1 −∑ (𝑦̂𝑖− 𝑦̅𝑖) 2 𝑛 𝑖=1 ∑𝑛𝑖=1(𝑦𝑖− 𝑦̅𝑖)2
Root Mean Square Error
RMSE = √1
𝑛∑(𝑦̂𝑖 − 𝑦𝑖)
2 𝑛
𝑖=1
Mean Absolute Error
𝑀𝐴𝐸 =1
𝑛∑|𝑦̂𝑖− 𝑦𝑖|
𝑛
𝑖=1
Mean Bias Error
𝑀𝐵𝐸 =1
𝑛∑(𝑦̂𝑖− 𝑦𝑖)
𝑛
𝑖=1
*Where 𝑦̂ is the predicted value of y, 𝑦̅ is the mean of y and 𝑛 is the number of observations.
2.3
Evaluation of the impact of albedo value
When evaluating how the dynamic and static albedo value affects the irradiation of a bifacial PV module, the dynamic albedo value was divided into two different frequencies based on availability. The first albedo alternative were data for every hour measured at the site. The second was satellite-derived albedo, measured for every tenth day, to examine the accuracy of a model simulation without accessibility to advanced equipment. The static albedo, hereafter named as the fixed albedo value, was calculated at the site. The NREL BEST-field case study was used in the evaluation due to the available measured albedo values. Measured albedo data at Kärrbo Prästgård was not available for a sufficient period.
The hourly albedo values and fixed value were downloaded from the data hub DuraMAT (Ayala & Deline, 2020a; Ayala & Deline, 2020b). Satellite-derived albedo values for Denver was retrieved from the Copernicus global land service. Copernicus is a European programme that focuses on delivering open satellite earth observations (Copernicus, n.d.a). One of their programs is the Copernicus global land service, which delivers qualified bio-geophysical products on the land surface's status and evolution. The service can monitor the surface reflection of the earth for specific locations, and the spatial resolution is 1𝑥1 km (Copernicus, n.d.b; Lellouch et al., 2020).
2.4
Find and evaluate optimal configurations for Kärrbo Prästgård
An optimisation tool was incorporated into the developed mathematical model to evaluate what system configurations maximise the energy output for the installed PV systems at Kärrbo Prästgård. The OptiCE open-source code has an existing optimisation function based
8
on genetic algorithms (GA) and will be used to retrieve optimal configurations (OptiCE, n.d.). The genetic algorithm is a function of the Optimisation Toolbox in Matlab (MathWorks, n.d.b). The optimisation of energy output was done by changing two parameters, the tilt and azimuth angle, which were chosen due to inspiration from previous research. The
optimisation result was then compared with the output of the installed configurations that the developed model generated. The evaluation of the results was made by comparing the economic savings from selling electricity surplus and using self-produced electricity. The comparison was conducted with both a fixed albedo and an hourly albedo.
Hourly albedo was not possible to retrieve from the site at Kärrbo Prästgård due to
availability. The hourly albedo data was calculated for a grass area in Roskilde, Denmark. The ground-reflected irradiance and global horizontal irradiance for the grass area was
downloaded from the data hub DuraMAT (Marion, 2020a). Albedo calculations from a grass area in a similar climate as Kärrbo Prästgård was considered acceptable for this study. The installed configurations, as tilt angle, azimuth angle, and module elevation, were retrieved by visiting the site of Kärrbo Prästgård. For the simulations at Kärrbo Prästgård, the weather data, which includes sun radiation, ambient temperature, and wind speed, was retrieved from SMHI and STRÅNG, which are open data sources (SMHI, n.d.a; SMHI, n.d.b). The site at Kärrbo Prästgård has installed two bifacial PV systems with two different module types. The module types are Jolywood 380W bifacial frameless module (JW-D72N-380M) and LONGi Solar 370W bifacial PERC module (LR4-60HBD-370M). Solar cell parameters for the installed modules were retrieved from datasheets by the manufacturers (LONGi Solar, 2020; EnergyPal, n.d).
The electricity consumption and electricity cost of the farm were required to evaluate the optimisation results. The load profile was provided by the farmer at Kärrbo Prästgård, Ulf Andersson. The optimisation was made for the entire year of 2020 to include all seasons. The economic data used to assess economic savings were based on the electricity spot price, taxes and fees related to Kärrbo Prästgård. The spot price was retrieved at Nord Pool (2021). The fixed fees in electricity cost were not considered since they do not vary on the electricity consumption. Investment costs and operation costs were not included in the optimisation since it was assumed that changing the tilt and azimuth angles of the systems would be the same.
9
3
LITERATURE STUDY
Previous studies regarding PV technologies, performance metrics and modules' price development are summarised in this chapter. Further, the impact of albedo on bifacial PV systems, system configurations and other factors that affect the performance are presented. Finally, a review of previous works conducted with OptiCE and genetic algorithms are described.
3.1
PV technologies
3.1.1 Bifacial PV
The commercialisation and mass production of bifacial modules started in the 2010s using various crystalline silicon (c-Si) bifacial PV cell structures (Liang et al., 2019). c-Si dominate the PV cell market 2020 with about 95% market share (Fischer et al., 2021). Common types of c-Si cells are PERL (passivated emitter rear locally diffused), PERC (passivated emitter rear contact), PERT (passivated emitter rear totally diffused), IBC (interdigitated back contact) and SHJ (silicon hetero-junction). The PERL/PERT/PERC market share was about 80% in 2020 (Fischer et al., 2021). SHJ cells stood for 2 - 3% of the market share but are forecasted to increase to 18% by 2031. Bifacial PERC cell technology can also be named PERC+, a schematic illustration of the cells shown in Figure 3 (Dullweber et al., 2015). The bifacial cells can accept light from the rear side since the technology only require
metallisation of a proportion on the backside (Stein et al., 2021).
Figure 3 Schematic drawing of (a) an industry-typical monofacial PERC cell and (b) a bifacial PERC+ cell (Dullweber et al., 2015). Reprinted with permission.
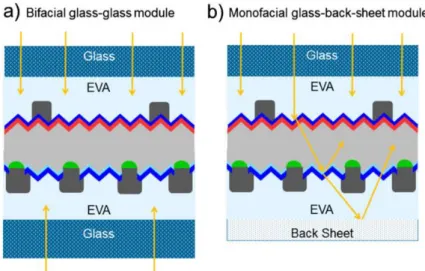
Although bifacial PV modules stood for 17% of the market share during 2020, bifacial cells stood for 28% (Fischer et al., 2021). The gap in market share between bifacial cells and modules is because bifacial cells can be used in bifacial and conventional monofacial
modules. Thus, 11 % of the bifacial cells are used in monofacial PV modules. For a bifacial cell in a monofacial glass-back-sheet PV module, illustrated in Figure 4(b), the white back sheet acts as a reflector for the cell (Dullweber et al., 2015). In bifacial PV modules, the cell's rear side is either encapsulated glass or a transparent polymer back sheet supported by an aluminium frame (Singh, Gou, Peters, Aberle, & Walsh, 2015; Stein et al., 2021). Bifacial glass-glass PV modules can also be frameless, meaning they are manufactured without an
10
aluminium frame. The bifacial glass-glass module in Figure 4(a) shows how the light can reach the cell through both the module's front and rear sides.
Figure 4 Schematic drawings of the bifacial PERC+ cell in (a) bifacial glass-glass PV modules and (b) monofacial PV modules with a white back sheet (Dullweber et al., 2015). Reprinted with permission.
3.1.2 Cell technologies
c-Si cell technology is also called the "first generation" of solar PV technologies (Sundaram, Benson, & Mallick, 2016, Chapter 2). Sundaram et al. (2016) describe the technology as mature with well-developed mass production. The cell technology also has a reasonable price and good efficiency (NREL, n.d.a). Table 3 summarises the front and rear efficiency and bifacial factor (𝐵𝐹) of different c-Si cell technologies. According to IEC 60904-1-2 standards, the bifaciality factor is 𝑃𝑚𝑝,𝑟𝑒𝑎𝑟/𝑃𝑚𝑝,𝑓𝑟𝑜𝑛𝑡 at standard test conditions (STC), where 𝑃𝑚𝑝 is the
maximum power (Liang, Pravettoni, Singh, Wang, & Khoo, 2018). However, sometimes the bifacial factor (or bifaciality) is defined as the ratio of the rear side efficiency to the front side efficiency (Deline et al., 2017). The efficiencies depend on the surroundings of
measurements, complicating a comparison between different bifacial cells.
Table 3 Efficiency and bifaciality factor of c-Si cell technologies. Front-side
efficiency Rear-side efficiency Bifacial factor Reference
PERC 21.2 - 22.7% 15.4 - 18.6% 69 - 82% (Dullweber et al., 2015; Zhang et al., 2020; Hu et al., 2019; Bellini, 2017)
PERL 19.8% 17.6% 89% (Lohmüller et al., 2017)
PERT 18.6 - 23.2% 15.3 - 18.6% 80 - 87.5% (Teppe et al., 2015; Bellini, 2019; Wei et al., 2017; Mihailetchi et al., 2015)
IBC 20.9 - 22% 15.6 - 18.3% 74 - 83% (Guillevin et al., 2017; Mihailetchi et al., 2015)
11
In addition to c-Si cells, there are other types of developed solar cells with varying
efficiencies. These can be divided into second and third-generation (Sundaram et al., 2016). The second generation is thin-film technology. The cells are made from very thin
semiconductor materials to reduce the material and energy consumption (NREL, n.d.a; Sundaram et al., 2016). Sundaram et al. (2016) summarise the main technologies in thin-film technologies: copper indium gallium selenide, cadmium telluride and amorphous silicon. Multijunction solar cells based on III-V materials have high efficiency but are not considered cost-effective due to high production costs and the low abundance of cell technology
components. Lee and Ebong (2017) state that thin-film solar cells show promise in competing with c-Si technology within efficiency due to minimal material usage. In contrast, Fisher et al. (2021) assume that the market share of thin-film cells will remain at 5%. Little progress in implementing bifacial technology in thin-film cells has been made, according to Phillips et al. (2020), due to high back surface recombination velocity. The surface recombination velocity is seemed to be an important parameter since it affects the dark saturation current and quantum efficiency of solar cells (Markvart & Castañer, 2017).
The third-generation solar cells aim to use environmentally friendly materials and reduce manufacturing costs (Sundaram et al., 2016). The leading technologies in the third generation are dye-sensitized, organic and perovskite solar cells. Perovskite/c-Si tandem solar cells have emerged in recent years by achieving an efficiency of 28 - 30% (NREL, n.d.b; Hutchins, 2020b). However, perovskite/c-Si tandem cells are still in research stages and have not yet been commercialised (Li & Zhang, 2020). Tandem configurations are designed to absorb the entire solar light range and include two or more cells (Wali, Elumalai, Iqbal, Uddin, & Jose, 2018). Lehr et al. (2020) found that bifacial perovskite/c-Si tandem PV modules can increase the energy yield by 18 - 23% compared to monofacial tandem perovskite/c-Si modules. And by 24 - 38% compared to bifacial c-Si PV modules.
3.1.3 PV system performance metrics
The specific yield is a commonly used performance metric for solar PV systems is according to Zhang (2017a). It is mainly used to analyse the difference between PV designs or compare suitable locations for PV systems. The specific yield is the energy produced in kWh divided by the kWp of module capacity and is often calculated over a year. Zhang also mentions factors that impact the specific yield. Zhang concludes that the chosen location is the main
influencing factor. The exposure of shade, soiling and snow cover are factors related to the location. Further factors that influence the specific yield is the weather file used in
simulations, module orientation and module selection. The balance of system efficiency concerning the inverter efficiency, current losses, mismatch losses, and inverter clipping affects the specific yield.
Leloux et al. (2015) found that the mean annual specific yield in the United Kingdom, Belgium, France, and Spain was 898, 908, 1115 and 1450 kWh/kWp. The systems
investigated were of different sizes, PV technologies and orientations. The authors discussed that factors, such as newly emerged technologies, would be interesting to add in future research to update the results. Baumann et al. (2018) evaluated an east-west oriented vertical
12
bifacial PV system at a rooftop site in Switzerland. The result showed that the system had an annual specific yield of 942 kWh/kWp from August 2017 to August 2018. Schelin (2019) conducted a degree project to evaluate existing PV systems' specific yield in Sweden. Results showed that the annual specific yield of PV systems in Sweden ranged from 602-955
kWh/kWp during 2017 and 681-1015 kWh/kWp during 2018, with the southern systems ranging higher than the northern systems. The PV systems in region Västmanland had an annual mean specific yield of 745 kWh/kWp for 2017 and 867 kWh/kWp 2018.
Molin, Stridh, Molin and Wäckelgård (2018) found that a vertical east-west oriented bifacial PV system in Sweden had an annual specific yield of 990 kWh/kWp from 2016 to 2017. In addition, the authors evaluated a monofacial PV system with a south-facing orientation close to the bifacial system. They found that it had an annual specific yield of 980 kWh/kWp during the same period. The authors also evaluated two systems at another experimental site with south-oriented bifacial and monofacial PV systems, both with a 40° tilt. They found that the annual specific yield for the south-oriented bifacial PV system was 1000 kWh/kWp, and for the monofacial PV system, the annual specific yield was 950 kWh/kWp.
3.2
Market price development
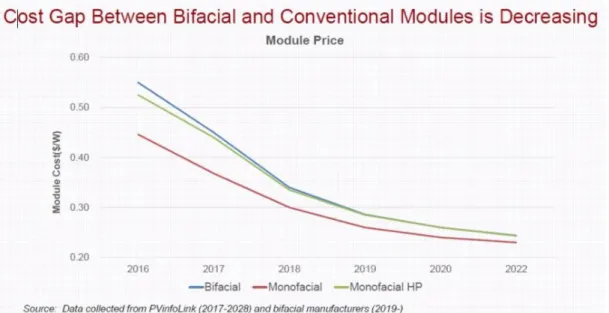
The price of PV modules has decreased over time. According to IRENA (2020), a decrease of 87% to 92% has been seen from 2009 to 2019, depending on the c-Si module type. The decline mainly depended on five factors; continued improvement in module efficiency, reduced material uses in manufacturing processes, decreased labour cost with more efficient manufacturing methods, economies of scale and increased competition between suppliers. Lusson (2020) discuss bifacial modules and that the technology may claim a significant market share of the solar PV market in the future. However, one crucial factor is the cost. In Figure 5, data from PVinfoLink (n.d.) and bifacial manufacturers shows that the price for bifacial modules and monofacial high-performance modules have closed in on each other in the global market. In addition to the increased production of bifacial modules, the decreased cost gap leads to more available data and improved design, according to Lusson. However, factors such as different designs, site location and challenging installations compared to monofacial systems may create problems for investors and affect widespread adoption.
13
Figure 5 Cost gap between bifacial and conventional modules (Lusson, 2020; PVinfoLink, n.d.). Reprinted with permission.
The global deployment of bifacial modules emerged in 2019. In December 2019, the average price for a bifacial module was 0.38 €/WP in Europe (IRENA, 2020; Schachinger, 2021). In Figure 6, Schachinger (2021) summarised how the price for bifacial modules closed in on high efficiency and all-black modules during 2020 on the EU spot market.
Figure 6 EU spot market module prices by technology (Schachinger, 2021; pvXchange, 2020). Reprinted with permission.
14
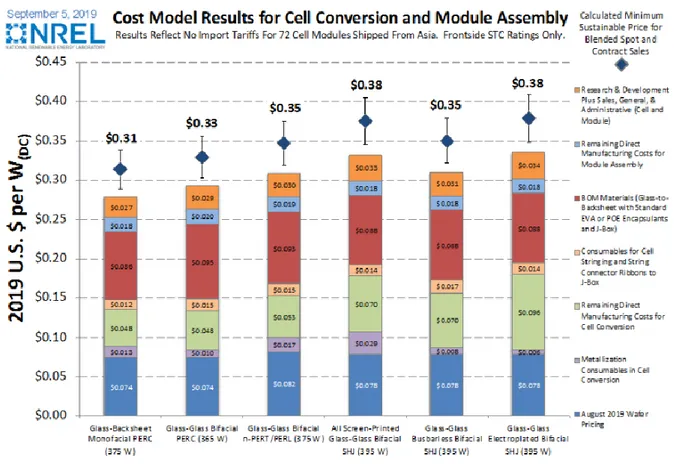
Woodhouse et al. (2019) compared the manufacturing cost between monofacial PERC modules with bifacial PERC, n-PERT/PERL and SHJ based on glass-glass technology, illustrated in Figure 7. It showed that in 2019, a 375W monofacial PERC module and a 365W bifacial PERC module had a 6% difference in module cost. The monofacial PERC module had an average manufacturing cost of $0.31/WDC, and the bifacial PERC module $0.33/WDC. The cost components with the highest impact on the manufacturing cost were the bill of
materials, remaining direct manufacturer costs for cell conversion, and wafers' price. The n-PERT/PERL module cost $0.35/WDC and had a similar cost component dependence as the PERC modules. The SHJ module showed the highest manufacturing cost, varying between $0.35 - 0.38/WDC, with a higher remaining direct manufacturer cost for cell conversion than the other technologies. The wafer price and bill of materials costs were similar for all of the different cell technologies.
Figure 7 Cost model results for cell conversion and module assembly (Woodhouse et al., 2019). Reprinted with permission.
3.3
The albedo value
3.3.1 The impact on ground-reflected irradiance
The surface albedo has long been under assessment by various researchers. Dickinson (1983) describes that the albedo is generally dependent on both the wavelength and incident angle of
15
incoming solar radiation. Surface albedos are dependent on the surface textures and
structures as well as composition. Molin et al. (2018) state that the albedo value significantly influences the bifacial PV energy yield. They conclude that a higher ground albedo will increase the energy yield. Sun et al. (2018) found that the bifacial gain increased by 20% when comparing a ground-mounted bifacial PV module with albedo 0.25 to a module elevation height of 1 m and albedo 0.5.
The albedo effect on the energy yield was analysed by Chiodetti et al. (2016). The authors compared the energy yield simulated by a bifacial PV system that used both a variable albedo and a fixed albedo. The results showed that a fixed albedo overestimated the total energy yield compared to a variable albedo. Since the variable albedo considered factors such as solar zenith angle, the diffuse ratio, and the influence of rain, it was more accurate. Chiodetti et al. also investigated how fixed albedo values of 0.2, 0.4, and 0.6 affected the ground-reflected (albedo) irradiance of a bifacial module's front and rear side. The result showed that the diffuse and beam irradiation on the front and rear side were not affected by an increased albedo while the reflected irradiance increased. For the rear side, the
ground-reflected irradiance increased significantly, while for the front side, the increase was minor. Zhang, Wang, Pan and Hu (2012) examined diurnal albedo variations and concluded, as Chiodetti et al., that surface albedo is higher in the morning than in the afternoon when the solar elevation angle is less than 40°. The up-facing parabolic curve of diurnal surface albedo was caused by solar elevation angle under clear sky conditions.
3.3.2 Albedo measurements
Reliable albedo data is essential to estimating a bifacial PV systems's energy yield (Chiodetti et al., 2016). Hutchins (2020a) explained that onsite measured albedo is essential for accurate simulations when evaluating bifacial projects. Calculating the albedo can be done with two horizontal pyranometers, one facing the ground and the other facing the sky (Marion, 2020b). The albedo is the irradiance measured by the ground-facing pyranometer divided by the irradiance measured by the sky-facing pyranometer (Lave, 2015), shown in equation (1). 𝜌 =𝐺𝑟𝑜𝑢𝑛𝑑 𝑟𝑒𝑓𝑙𝑒𝑐𝑡𝑒𝑑 𝑖𝑟𝑟𝑎𝑑𝑖𝑎𝑛𝑐𝑒 𝐺𝑙𝑜𝑏𝑎𝑙 ℎ𝑜𝑟𝑖𝑧𝑜𝑛𝑡𝑎𝑙 𝑖𝑟𝑟𝑎𝑑𝑖𝑎𝑛𝑐𝑒= 𝐼𝐺𝑅𝐼 𝐼𝐺𝐻𝐼 (1) 3.3.3 Albedo modelling
Measured albedo at the location is considered more reliable but requires advanced
equipment (Marion, 2021). Marion (2021) found that satellite-derived albedos can be used cautiously to evaluate bifacial PV systems' performance. It is possible to retrieve satellite-derived albedo measurements at the Copernicus Global Land Service (Copernicus, n.d.b). The available data in the Copernicus Global Land Service is divided into bi-hemispherical and directional-hemispherical reflectance, which is also called white-sky albedo (𝜌𝑤𝑠) and
black-sky albedo (𝜌𝑏𝑠), respectively. Wang et al. (2015b) describe the difference between
16
irradiation, which is independent of direction and assumes 100% diffuse irradiation. The black-sky albedo is dependent on direct irradiation and solar geometry (𝛺𝑖). Solar geometry
involves solar zenith and azimuth angles.
The albedo of a surface that considers the white- and black-sky albedo is known as the blue-sky albedo (Lewis & Barnsley, 1994; Wang et al., 2015b). The blue-blue-sky albedo (𝜌) is presented in equation (2) and depends on the fraction of diffuse irradiation. The diffuse fraction (𝑓𝑑𝑖𝑓𝑓) is the ratio of the diffuse horizontal irradiation (𝐼𝐷𝐻𝐼) to the global horizontal irradiation
(𝐼𝐺𝐻𝐼).
𝜌(𝛺𝑖) = 𝜌𝑤𝑠∙ 𝑓𝑑𝑖𝑓𝑓+ 𝜌𝑏𝑠(𝛺𝑖) ∙ (1 − 𝑓𝑑𝑖𝑓𝑓) (2)
Diurnal variation of albedo can be estimated using the solar zenith angle as the dominant variable (Dickinson, 1983). Briegleb, Minnis, Ramanathan and Harrison (1986) presented an approach to estimate the direct-beam surface (black-sky) albedo based on the work of
Dickinson (1983), shown in equation (3).
𝜌𝑏𝑠(𝜃
𝑧) = 𝜌0∙
1 + 𝐶 1 + 2 ∙ 𝐶 ∙ cos(𝜃𝑧)
(3)
where 𝜃𝑧 is the solar zenith angle, 𝜌0 is the albedo under direct illumination at 𝜃𝑧 = 60°, 𝐶 is a
constant depending on the surface type (0.4 for arable land, grassland and desert, and 0.1 for all other types) (Briegleb et al., 1986). Wang, Zeng, and Barlage (2007) proposed that the 𝐶 value could be obtained by minimizing the difference between measured and computed albedo values. The authors recommend a new set of 𝐶 values in their report (0.26 for
grasslands). Yang et al. (2008) stated that the albedo under direct illumination at solar zenith angle 60° varies depending on the surface type, geographical location and season. Grant, Prata and Cechet (2000) evaluated the estimation of the daily mean albedo with equation (3) using different ways to estimate 𝐶 and 𝜌0; fixed or fitted for each day. The authors found that
determining the 𝐶 and 𝜌0 values for each day gave a higher simulation accuracy of the albedo
compared to fixed values. Wang et al. (2007) stated that the white-sky albedo is independent of the solar zenith angle and thus can be obtained by integrating equation (3) over all solar zenith angles, shown in equation (4).
𝜌𝑤𝑠= 𝜌 0∙ 1 + 𝐶 𝐶 (1 − 1 2 ∙ 𝐶ln(1 + 2 ∙ 𝐶)) (4)
Chiodetti et al. (2016) evaluated the Briegleb et al. (1986) approach and presented a mathematical method to estimate the albedo, shown in equation (5). The mathematical model is an adaption of equation (2).
𝜌(𝜃𝑧) = 𝜌𝑤𝑠∙ 𝑓𝑑𝑖𝑓𝑓+ 𝜌0∙
1 + 𝐶 1 + 2 ∙ 𝐶 ∙ cos(𝜃𝑧)
∙ (1 − 𝑓𝑑𝑖𝑓𝑓) (5)
Chiodetti et al. (2016) stated that the unknown parameters of equation (5) (which are 𝐶, 𝜌0
and 𝜌𝑤𝑠) can be found by fitting the model to onsite measurements. According to the authors,
17
to various irradiation conditions. The global RMSE of the mathematical method was reported to be 6.6% for concrete and 5.5 % for grassland.
3.4
System configurations & surrounding factors
Asgharzadeh et al. (2018) stated that the optimal tilt of a south-facing bifacial PV module is complicated to estimate since it depends on the albedo, module elevation, size, weather conditions and season. Various researchers have studied vertical tilted modules with a tilt angle of 90°. Guo, Walsh and Peters (2013) compared the minimum albedo required to get a higher performance of a vertical bifacial PV module than a monofacial PV module for
different latitudes. The result showed that for lower latitudes, the minimum required albedo is higher than for higher latitudes. Wang et al. (2015a) concur with Guo et al. (2013). that the latitude of where the bifacial module is installed influences energy yield. As the sun elevation angle decreases with higher latitude, they conclude that a bifacial PV module has higher performance at locations with low sun elevation angles. The authors argue that the required module elevation depends on the latitude. The result showed that a lower module elevation is sufficient at higher latitudes compared to lower latitudes. Results were due to the
self-shadowing effect directly underneath the module.
Sun et al. (2018) estimated that a south-north-facing optimal tilted bifacial PV module has higher bifacial gain across the globe than an east-west vertical bifacial PV when ground-mounted with an albedo of 0.25. The optimally tilted bifacial PV modules were optimised for maximum production. However, when increasing the albedo to 0.5, the authors found that the ground-mounted east-west vertical bifacial PV can have higher bifacial gain than the south-north-facing optimal tilted bifacial PV module below the latitude of 30°. For latitudes above 30°, the result was reversed. Sun et al. also compared the two module setups for module elevation of 1 meter and albedo 0.5. They found that when elevating the two meters to 1 meter, the south-north suffers less from self-shading and can produce more power than the east-west. Thus, the south-north facing becomes again optimal. Appelbaum (2016) supports these results by studying the identical two setups at a latitude of 32°. The south-north-facing module produced 32 % more energy than the east-west facing module. Appelbaum (2016) found that vertical collectors are more sensitive to row-to-row shading than tilted collectors due to the height. However, the author adds that more vertical collectors than tilted collectors can be installed in the same area. Nonetheless, if the row pitch is too small, it will increase the row-to-row shading. Self-shading is a part of the shadowing effect and can lead to significant losses for a PV module (Masters, 2004). Asgharzadeh et al. (2018) state that the increased shadowing effect on large-scale bifacial PV, compared to single module systems, generates a lower energy output in the centre module. The shadowing effect includes horizon blocking, diffuse sunlight blocking from surrounding modules, and area shadowing cast by modules on the ground. The shadowing effect can include the row pitch and row distance, where the row pitch is the distance between the module centre of two PV rows. The distance between the back edge of the first row and the second row's front edge is the row distance. The row pitch is equal to the row distance for vertically installed modules.
18
Shoukry et al. (2016) conducted a study regarding the row distance effect on the energy yield for a setup of three rows. Results showed that a small distance between the rows decreased the bifacial gain in the centre modules compared to the outer layer.
Hajjar, Dubaikel and Ballard (2015) showed that vertical collectors are less affected by soiling, which affect energy production and cost, in climates with high dust accumulation. Granlund, Narvesjö and Petersson (2019) show in their study, conducted in Sweden at latitude 65°N, that snow soiling has less impact on vertical modules than lower tilts. With snow-covered ground, it is possible to achieve high albedo values. Chen, Li, Li and Liu (2014) found that the snow albedo is relatively high (0.7-0.9) for fresh snow. However, the snow albedo decreases exponentially with time after the snowfall.
3.5
OptiCE and genetic algorithms in previous research
The open-source code OptiCE is used to design, simulate, and optimise off-grid applications (OptiCE, n.d.). The OptiCE model focuses on integrating clean energy technologies in
microgrids or as distributed generation in larger grids. It has been continuously developed to include solar photovoltaic (PV), wind turbine, diesel generator and battery bank for off-grid applications, and power-to-heat conversion technologies and storage systems. The open-source code is based on Matlab language and uses a GA for optimisation problems. Campana, Zhang, Lundblad, Li and Jinyue (2017) evaluated the capabilities of the open-source code. They described it as a tool, which can be used for more than ten clean energy technologies with several operational strategies. Additionally, since OptiCE is based on Matlab, the end-user can customise the simulation, optimisation and operational strategies. Campana et al. pointed out that further development of the open-source code involves integrating further models and validating the models and optimisation techniques.
GA is an optimisation and search method which adapts and evolves depending on genetic processes similar to biological organisms (Beasley, Bull, & Martin, 1993). According to Beasley et al. (1993), a close reference would be the principles of natural selection and
"survival of the fittest". The GA can, with suitable encoding, adopt this principle and "evolve" solutions to real-world problems. However, this artificial evolution method is much more simplified than real natural evolution, but GAs' have shown a capability to solve surprisingly complex design problems (Renner & Ekárt, 2003). Similar to the real world, Beasley et al. explain that GAs'consist of a population of "individuals" that each represent a possible
solution for a given problem. Each individual is assigned a fitness score according to how well it fits the solution objective. The individuals with higher scores are then "mated" to form the next generation of individuals. Meanwhile, the individuals with lower scores will most likely not be used for reproduction, so they will "die out". This process will continue to converge and find the optimal solution to the problem. Renner et al. conclude that genetic algorithms are flexible and adapted to different design and optimisation problems. For example, Merei, Berger and Saur (2013) used a genetic algorithm to investigate the optimised configuration of a hybrid system. The system consisted of PV panels, a wind turbine, batteries for energy storage and a backup diesel generator.
19
Several studies on PV systems have used OptiCE and GA to find optimal solutions for various objectives. Campana et al. (2015) performed an economic optimisation of a photovoltaic water pumping system for irrigation, which was conducted based on three decisional variables. The variables included PV power peak capacity, tilt angle, and surface azimuth angle. By combining the dynamics of the PV water pumping system, crop water demand, and groundwater level and using the optimisation function in OptiCE, the system's efficiency increased. Additionally, the investment cost was reduced. The results showed a 10% increase in PV power output during the irrigation period with the optimised tilt and azimuth angles compared to the existing orientation. The PV size was also reduced from 1.44kWP to 0.96kWP. Campana et al. (2016) developed an MS Excel-VB program based on the OptiCE model to optimise the capacity of solar home systems components. The focus was to minimise costs and maximise the self-sufficiency of the system. The results showed that the developed model was a powerful tool for designing optimal configurations of solar home systems based on a given load profile. The original Matlab based model was in good agreement with the optimisation results of the developed Excel program.
Zhang et al. (2017b) used OptiCE to compare a single diode PV model, a simplified model, and two different battery models. The objective was to maximise the self-sufficiency ratio and maximise the net present value based on three decisional variables. The three variables included component capacity, PV azimuth angle and PV tilt angle. Results showed that a single-diode model was more favourable than the simplified model since the simplified model tended to overestimate production compared to the single-diode model. Another report studied the optimisation of floating PV systems for shrimp farm cultivation in
Thailand (Campana, Wästhage, Nookuea, Tan, & Yan, 2019). The study included a dynamic techno-economic approach and evaluated different types of PV and wind-based hybrid systems. It was based on simulations and optimisations to minimise the LCOE while maximizing the energy system self-sufficiency. Decisional variables such as tilt angle, azimuth angle, PV capacity, wind tower height, wind power capacity and battery capacity were used. Results showed that a hybrid energy system with PVs' represented the best solution for the selected location. The hybrid energy system with PVs' was favourable due to the abundance of solar irradiation compared to available wind resources.
20
4
MODEL AND CASE STUDIES
In this chapter, the model framework and the theories used when developing the
mathematical model are explained. Further, two different cases are presented. In the first case, the NREL BEST-field was used to validate the developed model and study the effect of dynamic and static albedo. In the second case, Kärrbo Prästgård was used to evaluate the optimal system configurations for maximum energy output.
4.1
Model framework
The model is based on OptiCE (n.d.), and the overall model framework of the developed model is presented in Figure 8. The model's input is the system configuration, irradiation, albedo, weather data, and module characteristics. OptiCE is used to calculate the solar position and power. The developed model uses the inputs and solar position to calculate the incidence angle, reflection losses and irradiance components. The steps in the OptiCE and the developed model will be presented and explained throughout section 4.2 Front and Rear Irradiance and 4.3 Power generation.
21
4.2
Front and Rear Irradiance
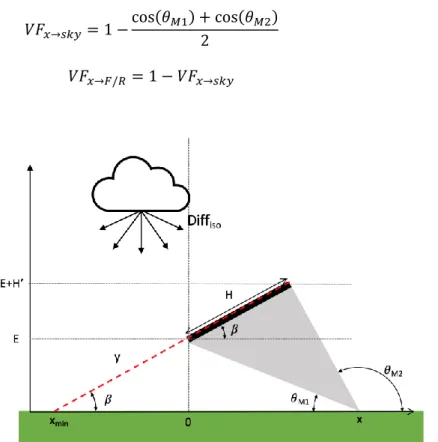
The total solar irradiance is the sum of the total beam irradiance (𝐼𝑏𝑒𝑎𝑚), diffuse irradiance
(𝐼𝑑𝑖𝑓𝑓) and ground-reflected (albedo) irradiance (𝐼𝑎𝑙𝑏) on the surface, seen in equation (6)
(Duffie & Beckman, 2006). The beam, ground-reflected and diffuse components can be seen in Figure 9. The diffuse irradiance consists of diffuse isotropic, diffuse circumsolar and diffuse horizon brightening.
𝐼𝑡𝑜𝑡= 𝐼𝑏𝑒𝑎𝑚+ 𝐼𝑑𝑖𝑓𝑓+ 𝐼𝑎𝑙𝑏 (6)
Figure 9 Solar irradiance components (own illustration, inspiration from Duffie & Beckman (2006)).
4.2.1 Solar and PV module angles and directions
The position of the sun and the orientation of the module can be expressed in angles (Duffie & Beckman, 2006). Figure 10 is a schematic illustration that shows some of the angles. The solar position can be described with the solar azimuth angle (𝛾𝑠) and solar altitude angle (𝛼𝑠). The irradiation onto the PV module will depend on solar position, module azimuth angle (𝛾) and module tilt (𝛽). The solar zenith angle (𝜃𝑧) is defined as 90 − 𝛼𝑠.
For a bifacial PV module, the five components are computed for both the front and rear surface to find the front and rear irradiance. When calculating the rear irradiance, the module tilt and module azimuth angles are corrected with 180 degrees: 𝛾𝑅= 𝛾𝐹+ 180 and
𝛽𝑅 = 180 − 𝛽𝐹. Where 𝐹 and 𝑅 stand for "Front" and "Rear", respectively. The tilt (𝛽) in