Sixteen years age limit for learner
drivers in Sweden - an evaluation
of safety effects
Reprint from Accident Analysis & Prevention 32 (2000),
pp.25 35
Nils Petter Gregersen, Hans-Yngve Berg, Inger Engström,
Sixten Nolén, Anders Nyberg, VTI and
Per-Arne Rimmö, University of Uppsala
c» a: O') v-I
q-oo
oo
x U >= h IH a 25 m ÖVNINGSBIL L å * " *. ' », . » " .? . A , , " ~ :L & & ; _, '., » :* , . ä,, O l: ' n . . _ _, , f n : * * » i ' . , . l & :! _(ä 5 3 l; , f- Q . _ 5 = g i:- . ~. 3 1 », ,3 ,,'-Swedish National Road and
VTI särtryck 334 - 1999
Sixteen years age limit for learner
drivers in Sweden an evaluation
of safety effects
Reprint from Accident Analysis & Prevention 32 (2000),
pp.25 35
Nils Petter Gregersen, Hans-Yngve Berg, Inger Engström,
Sixten Nolén, Anders Nyberg, VTI and
Per-Arne Rimmö, University of Uppsala
Copyright 2000, with permission from Elsevier Science
Sweeiisir
and
ACCIDENT
ANALYSIS
&
PREVENTION
www.elsevier.com/locate/aap
PERGAMON
Accident Analysis and Prevention 32 (2000) 25 35Sixteen years age limit for learner drivers in Sweden an
evaluation of safety effects
Nils P. Gregersen **, Hans-Yngve Berg a,b, Inger Engström a c, Sixten Nolén a,b,
Anders Nyberg a d, Per-Arne Rimmö e
a Swedish National Road and Transport Research Institute (VTI), Linköping, Linköping, Sweden b Department of Health and Environment, University of Linköping, Linköping, Sweden c Department of Education and Psychology, University of Linköping, Linköping, Sweden
d Department of Education, University of Uppsala, Uppsala, Sweden e Department of Psychology, University of Uppsala, Uppsala, Sweden
Received 17 October 1997; received in revised form 4 March 1999; accepted 24 March 1999
Abstract
Through a reform implemented in Sweden, September 1993, the age limit for practising car driving was lowered from 17% to 16 years while the licensing age remained 18. The purpose of lowering the age limit was to give the learner drivers an opportunity to acquire more experience as drivers before being allowed to drive on their own. The primary aim of this study was to evaluate the effect of the reform in terms of accident involvement and data were therefore obtained from the national register of police reported accidents. The results show that after the reform there was a general reduction in the accident risk (accidents per 10 million km) of novice drivers with approximately 15%. Additional analyses show that the reduction of accident risk in the group who utilised the new age limit was approximately 40%, whereas those who did not utilise the prolonged training period did not bene t at all. Between 45 and 50% of the age population were found to utilise the reform. The accident reduction does not seem to be just an initial rst year effect since the results were similar over 3 years of novice drivers during their first 2 years with a licence. These results suggest that the reform has been bene cial for the safety of novice drivers in Sweden. The results also suggest a potential for additional safety improvements if more young learner drivers can be brought to utilise the low age limit. © 1999 Elsevier Science Ltd. All rights reserved.
Keywords: Learner drivers; Accident involvement; Safety effects; Sixteen years old
ence (Pelz and Schuman, 1971; Spolander, 1983; May-cock et al., 1991; Levy, 1990; Cooper et al., 1995).
During the last decade numerous literature reviews on young, novice drivers and driver training have been
1. Introduction
Through a reform implemented in September 1993, the age limit for practising car driving was lowered from 17% to 16 years while the licensing age remained 18. The purpose of lowering the age limit was to give the learner drivers an opportunity to acquire more experience as drivers before being allowed to drive on their own.
A large number of studies have drawn attention to the fact that one of the largest contributory factor to novice drivers crash involvement is their lack of
experi-*Corresponding author. Te].: +46-204000; fax: +46 13-141436.
E-mail address: nils.petter.gregersen©vti.se (N.P. Gregersen)
published. In all these reviews the lack of experience has been pointed out as a serious problem (Drummond et al., 1993; Smith, 1994; Lynam and Twisk, 1995; Cavallo and Triggs, 1996; Gregersen, 1996a; Mayhew and Simpson, 1996).
A common model for explaining why experience lowers the accident risk is that new drivers go through several phases of behavioural control in which they learn to handle the large number of assignments which are included in driving a car. The new driver is faced with many new tasks and situations, all of which re-quire mental resources. The perceptual situation is new
0001-4575/99/$ - see front matter © 1999 Elsevier Science Ltd. All rights reserved. PII: SOOOl~4575(99)00045-7
and imposes special requirements on visual search skills, and interpretation of what is happening in the surrounding environment. The handling of the car itself also requires a certain mental capacity involving a number of control levers, stalks and warning devices which must be used and co-ordinated in a complex pattern. The entire traf c environment with all its rules, regulations and requirements for speci c behaviour also increases the mental workload. With increasing
experi-ence, however, more and more of these tasks will
become automated and the mental workload will reduce.
According to Rasmussen (1984) the skill acquisition process and the behavioural control can be described at
three levels. At the rst level of behaviour control, the
knowledge based level, extensive mental effort is allo-cated to attention, decision making and acting; as in the case of identifying the need for gear shifting, decision on how to perform the different tasks that are involved and the actual combination and performance of the task. Through experience the solution of the task be-comes familiar and mental rules are developed. This is according to Rasmussen the rule based level. These rules can combine several steps of different solutions or nested subtasks so that the driver will gain control over long behaviour sequences. For example, in gear shifting the whole sequence will be solved as one single task and the effort demanding fragmentation will be avoided. With yet further experience combined action chains will be more automatically controlled. Attention is then needed rather to decide when to shift gear, than how to do it. This development towards the skill based level, makes it possible to shift more of the attention and decision making from the primary driving task to the driving environment, other road users etc. and makes it possible to predict the behaviour of other road users and evaluate hazards in traf c.
This knowledge about the process of experience gain-ing and its potential safety bene ts was one of the main arguments behind the decision to lower the age limit for practising in Sweden from 175 to 16 years. By keeping the licensing age at 18 years, this made it possible to gain 2 years of experience under mandatory supervision before driving alone.
During the rst 5 years after the introduction of the new age limit, the Swedish system offered two possibil-ities with slightly different regulations. At an early start (between 16 and 175, of cial permissions for the
learner, and for a supervisor, were required, whereas at
a later start (after 17%) only the learner permit was needed. In October 1998 the supervisor s permit became obligatory for all ages. Currently all learner drivers must have a learner s permit and a supervisor s permit if a lay instructor such as a parent is engaged. If only professional driving schools are used, no supervisor s permit is required. A supervisor must always be at least
24 years old and must have had a driving licence continuously for the past 5 years without it having been recalled by the authorities. For all learner drivers the choice is free to go through the education and training in a driving school and/or together with a lay supervi-sor. Skid training, which is lasting for about half a day is compulsory for all learner drivers in Sweden.
Several countries have introduced different systems aiming at increased experience. Mainly, two different types of systems have been used: an extended learning period and, graduated licensing. The general idea be-hind extending the learner-driving period in Sweden, Norway, France, Belgium and other countries is to increase the total bank of experience under supervision. One of the main assumptions has been that a learner driver with extended practice before receiving a driving licence will be better off to utilise the mental resources required and thus become a safer driver. During such a prolonged period, the learner driver will have more time to acquire knowledge and experience how to han-dle the car and to increase automation of action and reaction. More training will also increase actual experi-ence in handling various traf c situations and thus learning to interact with other road users in everyday traf c situations. Learning from formal rules and be-havioural patterns is one thing, but learning to drive in smooth interaction with other road users is often some-thing quite different. Along with the adaptation to-wards an informal behavioural pattern the learner driver will have opportunities to experience that the behaviour of other road users is not always entirely predictable. This process develops gradually over a period of time, under which safety motives are balanced against other goals such as smoothness and transporta-tion needs. However, proponents of formal traf c edu-cation have expressed their concern about problems connected with a non-professional driving education: Unless in an education situation proper, bad habits can be acquired quickly. Since research has shown the signi cance of experience in accident development it may be assumed that the total effect of experience is good for safety.
A Norwegian study (Moe, 1992) monitored the pro-gress of 28 learner drivers who were given the opportu-nity to begin driving tuition from the age of 16. The minimum age limit for issuing a driving licence was 18 years. Their evaluation of the training programme, including many obligatory sections, showed that it was mainly positive although the learners did not fully exploit the opportunity to practice driving as much as they could. The main reason referred to was a lack of time.
In evaluations of the French system contradictory
results have been presented. Initially, a 70% reduction
of accidents were mentioned (Fafet, 1990). It turned out that there was no scienti c support for these results and
N.P. Gregersen et al. / Accident Analysis and Prevention 32 (2000) 25 35 27
subsequently another evaluation study was carried out by Page (1995). He found a 30% mean increase of accident-free distance driven as a result of the new
system.
One precondition for a reduced age limit to have the expected effect is that it is really exploited to gain a lot of driving practice. Experience from France shows that the system reaches out to a relatively small group of youngsters. In the French system, a large portion of the training is obligatory, which is assumed to explain why many youngsters decline.
The evaluation of the Swedish reform comprises sev-eral sub-studies. Some of these are still running whereas others have been published elsewhere (Gregersen, l996b, 1997). In these previously published parts of the evaluation the results of a 1-year after licence follow-up of accident involvement among the rst learner drivers and a process evaluation have been presented. In the evaluation after 1 year with licence, accident risk in terms of accidents per 10 million km was found to be reduced among those who utilised the reform. The reduction was approximately 35%.
The aim of the process evaluation was to analyse how the new age limit was used and by whom. The results of the process evaluation, based on data from the national licence register, show that 45 50% of the 16 years old population did make use of the new possibilities during the rst 25 years after the introduc-tion by applying for and receiving a learner s permit. From logbooks, lled out by randomly drawn samples
of learner drivers, it was also found that 95% of the
youngsters with a low-age learner s permit actually did practice. The total amount of practising was also mea-sured through questionnaires distributed to randomly drawn samples of drivers. The results from these showed an increase in the amount of practice before licence to 117.6 h (mean). This was an increase with approximately 2.5 times compared to young learner drivers before the change (mean=47.6 h) and three times compared to those who started at 17% years of age after the change (mean = 41.4 h).
An analysis of the accident involvement during prac tising showed that the accident risk (per hour and per learner driver) among the youngest (16 17å) was not higher than in the older group (Nå 18). This suggests that during the after-reform period, the increased prac-tising at a lower age was not more dangerous than whatever education given during the pre-reform period. Calculated as accidents per driver the accident involve-ment was approximately 35 times higher during the rst 2 years after licensing than during the 2 years of practising. Comparable data on exposure have not been available but these per driver figures give a general public health perspective of the situation.
One of the most well known trials with extended formal education and training for learner drivers was
the DeKalb project. The DeKalb education comprised
72 h divided into 32 h of class room education, 16 h of
simulator driving, 16 h of driving range training, 3.5 h of training on evasive manoeuvres and 5 h of on-street training. In a review of the large number of evaluations of the program, Mayhew and Simpson (1996) con-cluded that despite signi cant efforts, the DeKalb eval-uation failed to provide evidence of the bene cial effects of formal instruction. The project is sometimes looked upon as an effort to increase the experience as a driver. The problem is, however, that very little of the time was spent in actual traffic. Even if all the real driving is taken into account in the DeKalb study, the amount of true driving will only sum up to 25 h. This may be compared to the normal Swedish learner driver who before the lowering of the age limit was practising in real traf c situations for approximately 48 h on average (Gregersen, l996b). Yet another problem found in the DeKalb study was that the participants tended to get their licence earlier and thus were more exposed.
The second variant of training with extended experi-ence is the staged process, known as graduated licens-ing. This is a system whereby the student goes through several stages, at each of which the degree of dif culty and the driver s responsibility are increased gradually. It is possible, for instance, to control where, when and how to practice in the various stages. It is also possible to integrate limitations such as driving on the motor-way, during the hours of darkness, above a certain speed or with even lower blood alcohol levels. Several evaluations of graduated licensing systems have been undertaken around the world, with promising results. This is the case in New Zealand (Langley et al., 1996) where the reduction of accidents was estimated to 7 23% depending on the influence of exposure, and in Ontario (Boase and Tasca, 1998) where the reduction was 31%. Several reports have been published where more recent experiences from graduated licensing are
presented (Haworth, 1994; Smith, 1994; Langley et al., 1996; Mayhew and Simpson, 1996; Simpson, 1996;
TRB, 1996).
2. Aim
The aim of this study was to evaluate the effects of the reform of a lowered age limit for practising car driving in terms of accident involvement (accidents per 1000 licence holders and accidents per 10 million km) during the first 2 years after licensing among young novice drivers. Two hypotheses have been tested. The rst was that those who utilised the new age limit will have lower accident involvement as novice drivers com pared to young drivers who did not utilise the pro-longed practising period before or after the change. The
second hypothesis was that accident involvement among the youngest, novice drivers in general would be reduced as an effect of the reform.
3. Materials and methods
3.1. Evaluation design
The change of age limit was introduced on a national level which made it impossible do evaluate the change
with an experimental design. It was, however, decided
that an evaluation was important so another design had to be chosen. Two designs were discussed, one was a before after comparison and the second a comparison between those who after the change made use of the lowered age limit and those who did not. Both the designs have disadvantages. The before after design cannot differentiate effects of the change from other time-related changes such as economical changes in society, unemployment or changes in weather condi-tions from one year to another. The second comparison between the users and the non-users includes a self-se-lection bias of for example greater interest or resources among the users.
In order to minimise these problems as much as possible without having the possibility to carry out an experiment, the two designs were combined. Three groups were thus compared as shown in Fig. 1. To control for the trends over time, and thereby avoid some of the problems in the before after comparison, an analysis of the accident involvement trend among young drivers over the period 1992 1997, the period covered in the evaluation, was performed.
Three comparison groups have thus been used in the present study. The group, which has made use of the possibilities to start practising at 16 will in this presenta-tion, be referred to as the 16 years group. For one of the two control groups, driver licence was obtained during the pre-reform period, before the change. These will be referred to as the old 17%2 years group. The second
Stan
control group, which comprise youngsters who, after the reform, did not make use of the extended training period but started practising after 17%; will be referred to as the new 17% years group. Common for all groups was that the age limit for getting a licence was 18 years. 3.2. Confounding factors
In addition to the trend analysis, two other possible confounding factors have been estimated. These are socio-economic background differences and age at which the drivers got their licence. In accordance with
earlier research (Jessor, 1988; Beirness and Simpson,
1991; Berg, 1994; Murray, 1998) it may be assumed that people with different socio-economic background also have different probabilities of accident involvement. Consequently, parts of the difference in accident in-volvement between the groups may be explained by differences in such background factors. Detailed results on these differences among the learner drivers in the three comparison groups have been published earlier (Gregersen, 1996b). From these results the answers of one of the questions in the questionnaire, What is the highest education in your family? has been used as an indicator of their socio-economic status. It has not been possible to apply any exact level of this in uence on accident involvement since such data were not available. A generous interpretation of this in uence was used in order to avoid overestimation of the effect of the change of age limit.
The accident involvement may also be in uenced by the age at which the drivers are licensed. If the 16 years drivers are licensed earlier, their accident involvement may partly be caused by their earlier exposure to traf c. This must also be regarded as a result of the change of age limit and the effects must thus be corrected corre-spondingly. This problem has been shown in the evalu-ations of the DeKalb project (Mayhew and Simpson, 1996). In that study it was found that the drivers who received the full training programme were licensed ear-lier than the control group.
+ 2 years + 4 years 16-years:
WW
T
Old 17Vz-years: % New 171/z-years: Trend analysisJ
W
I
i:] [___l 1:1 G
//A = training period = evaluation period
N.P. Gregersen et al. / Accident Analysis and Prevention 32 (2000) 25 35 29
Those who
re-ceived a lear- Those who
ner's permit af- % were licensed = 16 years group
ter 1/9-1993 1/3 1994 younger than 31/12 1997 /7 l7 /z years
Those who
were licensed Those who
<12 months were licensed = Oldl7 /2 years after turning 18, l/l 1992 group 1/1 1992 31/121993 31/12 1997 7 N) Those without learner's permit or received one between 17V:-18 years \ Those who
were licensed = New 17V: years 1/1 1994 - group 31/12 1997
Fig. 2. Criteria for de ning the three comparison groups in the national licence register and the police records.
3.3. Population register data
Information about accidents was collected from the register of police reported accidents. Only the accidents causing fatalities or personal injuries were used. For each accident involved driver, type and date of accident were obtained from the register. Information on date of learner s permit and licence were obtained from the national register on licences. The criteria for assigning the drivers to each of the three comparison groups are shown in Fig. 2. The first common criterion was that the licensing age should be under 19 years. The second criterion was that the selected drivers should have held their licence for more than 2 years since the aim was to present the effect over the rst 2 years with a licence. The analyses are based on all Swedish drivers who t into these criteria over the period from January lst 1992 to December 3lst 1997. In total the analyses concern 243 823 drivers and 4192 police reported accidents.
In the additional trend analysis the samples included young drivers between 20 and 24 years. Still younger drivers were excluded to obtain comparison data, which were independent from reform effects.
Table 1
Sample size, response rate and effective group size in the question-naire study
Group Sample size Effective group Response rate size (%)
Old 17% years 1200 1011 84.3
New 171 years 422 72.2
16 yearsz
2000
1024
72.2
3.4. Questionnaires
The samples used for the questionnaire study were randomly drawn from the Swedish national licence register. The questionnaires were mailed to drivers in the three comparison groups who had been licensed for
2 years. Due to the fact that the drivers in the old 17%
years group by definition were licensed earlier than the other groups, they received their questionnaires 1 year before the other groups (see Fig. 1). The sample sizes were 1200 in the old 17% years group and altogether 2000 in the remaining groups. Drivers in this sample were assigned 16 years drivers or new 17% years drivers in accordance with their answer to a question about their age when they started practising. Two reminders were used, the first after 3 weeks and the second after another two weeks. The response rates were 84% in the sample of 1200 and 72% in the sample of 2000. The final group sizes are shown in Table 1.
In this presentation, only two types of data from the questionnaires have been used. These are data on mileage and socio-economic background. Other results of the questionnaire studies have been published earlier by Gregersen (1996b, 1997).
3.5. Analysis procedure
1. The three comparison groups were identified in the two population registers, that is, the total number of drivers in each group and, the number of drivers in each group who had been involved in police re-ported accidents with personal injuries.
2. Individual data about date and age of learner s permit and licence were transferred from the licence register to the corresponding post in the accident register. The Swedish individual social security num-ber was used to match individuals in the two registers.
3. The accidents per 1000 licence holders in each com-parison group were calculated.
4. Data on mileage driven in each group obtained from the questionnaires were used as estimates of exposure, to be used in the calculations of risk from the population registers data.
5. Accident risk (accidents per 10 million km) was calculated for each of the three comparison groups. 6. The general effect of the reform was analysed by combining the 16 years drivers and new 17% years drivers and comparing their accident involvement
with the old 17% years drivers.
7. The accident involvement of the 16 years drivers,
the new 17% years drivers and the old 17% years
drivers were compared to each other.
8. Questionnaire data on socio-economic background, trends in national accident statistics and national register data 'on differences in licensing age were used to estimate confounding factors.
3. 6. Statistical methods
Differences in accident risk were estimated using the incidence density ratio (IDR) with 95% con dence in-tervals (McNeil, 1996).
4. Results
4.1. Effect of the reform
Table 2 shows the accident involvement of each of the three comparison groups and the corresponding aggregatedmeasure of accident involvement of the 16 years and the new 17% years groups. A comparison of the accident involvement between the old 17% years group and the combined gures from the other groups (the 16 years and new 17% years groups) gives a measure of the general effect of the reform. The analysis shows that the reduction of accidents per 1000 drivers after the reform compared to before was 20.8% and the reduction in accidents per 10 million km was 17.20/0. Each of the three comparison groups was compared as well. The results show that the 16 years group had a lower number of accidents per 1000 licence holders and a lower accident risk (accidents per 10 million km) compared to each of the two control groups. The difference in accident risk between the 16 years group and the two control groups were in both cases 45.9%. All differences except between the two 17%-year groups were significant (P < 0.05) as shown in Table 3.
Table 3 shows the IDR estimates and the 95% con -dence intervals concerning differences in accident in-volvement per person kilometres. These calculations
Table 2
have been used in the tests of the hypotheses de ned for the study (see the aim section above). The results support both hypotheses; a lowered accident involve-ment among those who have utilised the reform and, a positive general safety promoting effect of the reform.
In Fig. 3, the monthly development of accident in-volvement per 1000 licence holders is shown. As shown in Fig. 3, the 16 years group has a lower accident involvement all through the 2 years period. Still after 24 months there are clear differences between the 16 years group and the two control groups.
4.2. Gender differences
The relative distribution of accidents per 1000 licence holders for men and women is similar in the three comparison groups. In all groups men are involved in approximately 75% of the accidents. Accident risk, expressed as accidents per 10 million km, was found to be reduced after the reform among men as well as women, but the reduction was higher for women (Table 4).
Table 5 shows the IDR estimates for men and women separately. The same comparisons were made as for the whole groups in Table 3. The results support both hypotheses also when they are applied to each of the genders separately.
4.3. Confounding factors
The in uence of three additional possible confound-ing factors was estimated in this evaluation. These were socio-economic background, general accident trendand
The accident involvement the rst 2 years with a licence in the three comparison groups of the evaluation and before after the change Group Number of Number of Accidents per 1000 Mileage (km)a Accidents per 10 million kma
accidents drivers drivers
Old 17% years 2000 102 302 19.55 20 060 9.75 (before)
New 17% years 1665 89 507 18.60 19 140 9.72
16 years 527 52 014 10.13 19 240 5.27
New 17%+16 (after) 2192 141521 15.49 19180 8.07
a Mileage estimated from questionnaire data.
Table 3
Incidence density ratio (IDR) estimates and 95% confidence intervals concerning differences in accident involvement per person kilometres the rst 2 years with a licence
Compared groups IDR Con dence intervals Signi cance
Old_17% 16 years _ _ _ 0.541 0.500 0.588 P<0.05
New 17% 16 years 0.542 0.501 0.591 P<0.05
Old 17% years new 17% years 0.997 0.946 1.055 ns
0.788 0.872 ' P<0.05
N.P. Gregersen et al. / Accident Analysis and Prevention 32 (2000) 25 35 31 _. L CD .; CD _. L A _ _L M -- 16-years _ L - Old 171/2-years P oo .0 ou -New 171/2-years Ac ci de nt s pe r 1,00 0 li ce nc e ho ld er s yw = 1.2135e°-°°55" R2 = 0.7278 O O N & y" = 1.01859° °°7°' H2 = 0.7609 ! r' W ' y"5=o.9318e* -"*m R2=0.8969 O .
Months after licence
f
12 3 4 5 6 7 8 9101112131415161718192021222324
Fig. 3. Police reported accidents per 1000 licence holders during the rst 24 months with a licence in the three comparison groups.
_ Table 4
Accident involvement among men and women in the three comparison groups
Group Accidents per 1000 licence holders Mileagea Accidents per 10 million kma
Old 175 years, men _ 25.08 24 683 10.16 Old 175 years, women 11.88 14 673 8.09
New 17% years, men 24.48 24 424 10.02
New 17% years, women 10.95 13 071 8.38
16 years, men 13.92 24 780 5.62 16 years, women 5.32 12 916 4.12
a Mileage estimated from questionnaire data.
Table 5
Incidence density ratio (IDR) estimates and 95% con dence intervals concerning differences in accident involvement per person-kilometres the rst 2 years with a licence (men and women)
IDR Con dence intervals Signi cance
Compared groups, men
Old 175 years 16 years 0.553 0.498 0.621 P<0.05 New 175 years 16 years 0.561 0.504 0.632 P<0.05
Old 17% years new 17% years 0.986 0.917 1.067 ns
Old 175 years(before) new 175+16 (after) 0.827 0.773 0.889 P<0.05 Compared groups, women
Old 175 years 16 years 0.509 0.425 0.634 P<0.05
New 175 years 16 years 0.491 0.409 0.615 P <0.05
Old 175 years new 175 years 1.035 0.917 1.188 ns
Old 175 years(before) new 175 H6 (after) 0.841 0.751 0.957 P<0.05
licensing age. The aggregated results of these estima-tions are presented in Table 8.
4.4. Soda-economic preconditions
In the results of the questionnaire study (Gregersen, 1996b) it was found that the socio economic precondi-tions differ between the groups which in itself may
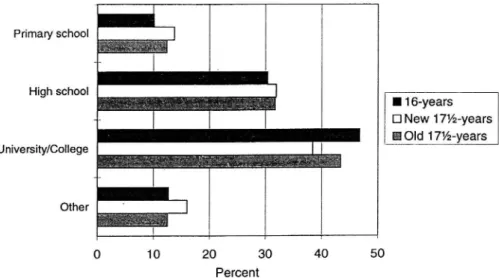
cause differences in accident involvement. The result of the question What is the highest education in your family? is presented in Fig. 4. The results show that a higher percentage of the 16 years group belongs to families with university education compared to the other groups. These results are representative for the distribution of other background data published earlier by Gregersen (1996b).
A generous interpretation of the in uence of these background preconditions was applied on the results of the present study in order to avoid overestimation of the effect of the reform. Based on the results shown in Fig. 4 the differences in socio-economic preconditions in the 16 years group was approximated to 7.8% com-pared to the old 175 years group and 21.9% comcom-pared to new 175 years group. With an extreme and generous assumption, that the over-represented share of the driv-ers with higher level of education in the family have no
accidents at all, the accident involvement of the 16
years group would be reduced with 7.8 and 21.9%, respectively in the comparison with each of the control groups. The calculations follow the formula
1 (a/(b x% of b)
where a is the lowest risk value and b is the highest as presented in Table 2. x is one of the 7.8 or 21.9, which were explained above.
4.5. General accident trend
A comparison of the accident involvement between the 16 years and the old 175 years groups may also, over and above any effect of the reform, suffer from effects of changes in the general year-to-year trend of accidents as data were obtained at different time peri-ods. In order to control for this, a trend analysis of
accident involvement was carried out among drivers 20 24 years of age during the period of the evaluation study. In Table 6 data from the national statistics of accident involvement show that the number of acci dents per 1000 licence holders was almost exactly the same over the entire evaluation period. There was a reduction from 1992 to 1993 which only in uences the very rst drivers of the old 175 years group itself since the follow-up period of the old 175 years drivers in cludes the years 1992 1995. The mean of accidents per 1000 licence holders over these years was 5.95. This can be compared to the mean level of 5.8 accidents per 1000 licence holders for the follow-up period of the 16 years and the new 17% years drivers, which include the period from 1994 to 1997. The difference and the trend related reduction is thus 1 (5.8/5.95) = 25%. For the calcula-tions of how these 2.5% in uences the difference be-tween the groups, x in the formula above has been replaced with 2.5 and b with the result of the previous calculation of (b x% of b) in the formula.
4. 6. Licensing age
In a comparison of licensure age it was found that the 16 years group was licensed approximately 1 month earlier than the new 17% years and almost at the same age as the old 17% years group (Table 7).
Primary school High school University/College . .. ..-... . .. . . . Other l16 years D New 17%-years Old 17%-years 0 10 20 Percent 30 40 50
Fig. 4. Distribution of highest education in family in the three comparison groups.
Table 6
Drivers 20 24 years old involved in accidents during the years 1993 1996 (1997 not available)
Year Accidents per 1000 licence holders Drivers involved in accidents Licence holders
1992 2925 452 000 6.5
1993 2488 439 000 5.7
1994 2523 433 000 5.8
1995 2444 422 000 5.8
N.P. Gregersen et al. / Accident Analysis and Prevention 32 (2000) 25 35 33 16 14 12 9,5 9,95 10 _ _ ___-__ ' 6,5 6,47 ' o w e 0 3 0 0 1990 1991 1992 1993 1994 1995 1996 1997 567 5,83 5,79 5,81 D 16-years A Old 17%-years --0 New 17%-years _ 18 19 years statistics - - '20-24-years statistics
Fig. 5. Accidents per 1000 drivers among young drivers in national Swedish statistics 1990 1997 compared with the evaluation results. Table 7
Mean of licensure age in the three comparison groups
Old 17% years New 17% years 16 years
Mean age 18.31 18.40 18.32
After compensating the new 17% years drivers for this one month lack of extra exposure, which is approxi-mately 4.2% of 24 months (used as x in the formula above), together with the estimated in uence of the other two confounding factors, the total effect of the extended learning period was estimated to approxi-mately 15% calculated as accidents per 10 million km. The resulting difference in accident risk for those who have utilised the lowered age limit was approximately 40% compared to old 17% years drivers and 24% com-pared to new l7% years drivers (Table 8). The reason why the difference between the risks of the 16 years group and the new 17% years group has decreased so much, from 45.8 to 23.9%, is mostly because the esti mated difference in socio-economic background is as large as 21.9%.
The initial differences before the compensation of confounding factors in Table 8 is based on register and exposure data solely and have been calculated with the formula
Table 8
1 - (a/b)
where a is the lowest risk value and b the highest as presented in Table 2.
Since the calculations are based on national gures, but on drivers with at least 2 years with a licence, the results should expectedly be visualised in the develop-ment of accident involvedevelop-ment in the general statistics on all novice drivers in the same age group, 18 19 years old. Fig. 5 shows the development of accidents per 1000 licence holders 1990 1997 and the corre-sponding results from Table 2, recalculated to give annual accident involvement gures. It is evident from Fig. 5 that the correspondence supports the validity of the evaluation results. When the rst drivers with a full 2-year training period have been licensed, which is in September 1995, the accident involvement is reduced with approximately 15%. The outcome is not exactly the same in the evaluation and in the national statistics, but that should not be expected since the groups in the evaluation and in the national statistics are not de ned in the same way.
5. Discussion
The results of this study show that a driver training reform implemented in Sweden in 1993, which implied
Estimated in uence of confounding factors on the comparisons performed in the evaluation
Differences based on register data Estimated differences after adjusting for confounding factors Accidents per 1000 Accidents per 10 million km Accidents per 1000 drivers Accidents per 10 million km
drivers (%) (%) (%) (%) 16 compared to 48.2 45.9 42.3 39.8 old 17% 16 compared to 45.5 45.8 27.1 23.9 new 17% After compared to 20.8 17.2 before 18.7 15.1
a prolonged driver training period, has had a general accident risk reducing effect on young novice drivers with approximately 15% during a follow-up period of 2 years. Drivers who actively engaged in the prolonged training were shown to bene t from the reform whereas those who did not use the longer driver training period did not bene t. Compared to a pre-reform period, the accident reduction after the reform was approximately 40% for those who utilised the extended training period.
The estimations of the effects of the reform have taken some confounding factors into account. The in uence of three confounding factors, over and above that of exposure, have been approximated. These are, however, crude approximations and there may still be other confounding factors not controlled for. There may for example be unmeasured motivational aspects that in uence the willingness to start practising early. It can, however, be concluded that the reform has given young drivers the opportunity to gain more experience. Some youngsters have utilised this opportunity and
others have not. The total effect of the reform,
includ-ing the existinclud-ing distribution of different motivation to participate, is shown in the results obtained in this evaluation. A deeper analysis of motivational factors would not have changed the results concerning the total reform effect but it may have helped to understand the causal relations between for example experience and accident risk better.
It would also, in order to increase this understanding, have been interesting to relate accident involvement
directly to socio-economic background, attitudes,
self-assessment, self reported driving style etc. in a
regres-sion analysis or in a chaid analysis. This has, however,
not been possible since data has been collected from different sources. Accident information was collected from national registers and all the other information comes from questionnaires among random samples of licence holders. Comparisons between these two sources were possible on an aggregated group level only.
One of the confoundings that was controlled for was the general accident trend among young drivers. In this trend analysis drivers between 20 24 years were used. The slightly older age group was chosen because in u-ence from the reform effect should be avoided. This difference in age may, however, result in an underesti-mation of the trend. The younger age groups may have been more sensitive to general trends in society such as economy and unemployment and therefore bias the trend estimate performed here. It is, however, not possi-ble to distinguish such trends from the trends caused by the l6-years reform among the youngest drivers since they apply to the same group.
Since the purpose of the reform was to give the learner driver an opportunity to acquire experience, the results must be interpreted in relation to the amount of
practice acquired. Just the possibility to start at an early age does not necessarily make all learner drivers
practice as much as possible. Earlier results (Gregersen,
l996b) have shown that the amount of practising was 2.5 3 times higher in the 16 years group compared to the control groups. It would have been of highest interest to do direct analyses of the correlation between amount of practising and accident involvement. This was, however, not possible since accident and exposure data were collected from different sources. Compari-sons were only possible at an aggregated level.
The ndings support the theory of skill acquisition (Rasmussen, 1984). Regarded in the perspective of Ras-mussen s theory, skill acquisition takes place purely as a development from conscious decision-making and re ection towards gradually increasing automation. In this process, systems of behavioural rules and mental models are created so that car driving, to a greater extent can take place with but occasional mental effort. Such sequences can be expected as a result of increased exposure to a variety of traf c situations in which the student builds up a bank of routine and recognition. Although the accident reduction in the 16 years group was approximately 40%, the general reform ef-fect was 15%. The obvious reason for this difference was apparently that only a part of the young learner drivers made use of the lowered age limit. If a larger part of the young learner driver population can be persuaded to start early and to practice more, the safety potential of the lowered age limit may be exploited even more. As shown in many different studies (e.g.
Gregersen, l996a; Simpson, 1996), there are, however,
also a large number of other factors that are related to driver behaviour and accident involvement of young, novice drivers. Many of these factors cannot be reached through increased experience solely.
With the results obtained, there is thus a sound basis
for continued development of driver training towards a higher safety or what in Sweden is proclaimed by the parliament as the Vision Zero, which is a strategy towards zero killed or severely injured road users. The main emphasis in the Vision Zero is on injury preven-tion through measures in the vehicle and in the road environment. A philosophy behind these efforts is that people normally make mistakes, also in traf c and also unintentionally. If such mistakes are made, for example among young, novice drivers, the environment should be forgiving in order to prevent serious consequences. Behaviourally oriented measures aiming at reducing
such mistakes are, however, also important in the
Vi-sion Zero, such as improvement of speed adjustment
and driver education. This means, in addition to other
types of road safety measures, for example further streamlining of the learning and experience-accumula-tion process. It is also a matter of reducing the number of accidents during driver training; individualising
N.P. Gregersen et al. / Accident Analysis and Prevention 32 (2000) 25 35 35
driver training in order to increase risk awareness; reducing young male s overestimation of their driving skill; conveying an insight about the in uence of group pressure, lifestyle and personality on driving style and accident involvement; and through all this, stimulate motivation to drive carefully and with greater safety margins. For many of these measures, the process of development has been going on for a long period of time in many countries. In Sweden, the government and the Swedish National Road Administration have de-cided to continue the development of driver education. By making use of the frontline of knowledge about young and novice drivers, a graduated education sys-tem is currently being developed. The most important aim of this work is to reduce accident involvement among novice drivers even further.
Acknowledgements
The evaluation study has been carried out on com-mission from the Swedish National Road Administration.
References
Beirness, P.J., Simpson, H.M., 1991. Predicting Young Driver Crush Involvement. The Role of Lifestyle Factors. International Sympo-sium New to the Road, Prevention Measures for Young and Novice Drivers. Halifax, Canada.
Berg, H.Y., 1994. Lifestyle, Traf c and Young Drivers An Inter-view Study. VTI Report 389A. Swedish Road and Transport Research Institute, Linköping, Sweden.
Boase, P., Tasca, L., 1998. Graduated licensing system evaluation. Interim report 198. Safety Policy Branch, Ministry of Transporta-tion of Ontario, Canada.
Cavallo, A., Triggs, T.J., 1996. Young Driver Research Strategy. Report No. 85. Monash University, Clayton, Victoria.
Cooper, P.J., Pinili, M., Chen, W., 1995. An examination of the crash involvement rates of novice drivers aged 16 to 55. Accid. Anal. Prev. 27, 89 104.
Drummond, A.E., Triggs, T.J, Macdonald, A.W., Bowland, L., 1993. Young Driver Research Program: Overview Report. Report No. CR 121. Monash University, Clayton, Victoria.
Fafet, H., 1990. Experiences from the 16-years age limit in France. Presentation organised by the Committee for Driver s Licence 2000. Stockholm, Sweden.
Gregersen, N.P., 1996a. Young Car Drivers. Why Are They Over-Represented in Traf c Accidents? How Can Driver Training Improve Their Situation? VTI Report 409A. Swedish Road and Transport Research Institute, Link'o'ping, Sweden.
Gregersen, N.P., l996b. Evaluation of 16-Years Age Limit For
Driver Training First Report. VTI Report 418A. Swedish Road and Transport Research Institute, Linköping, Sweden.
Gregersen, N.P., 1997. Practising from the age of 16, some evaluation results from Swedish driver training. In: Rothengatter, T., Car-bonell Vaya, E. (Eds.), Traf c and Transport Psychology, Theory and Application. Pergamon, Amsterdam, pp. 423 430.
Haworth, N., 1994. Young driver research program: evaluation of Australian Graduated Licensing Scheme. Report CR136. Federal Of ce of Road Safety, Canberra, Australia.
Jessor, R., 1988. Risky driving and adolescent problem behavior: an extension of the problem-behavior theory. Alcohol Drugs Driv. 3, 3 4.
Langley, J.D., Wagenaar, A.C., Begg, D.J., 1996. An evaluation of the New Zealand graduated driver licensing system. Accid. Anal. Prev. 28, 139 146.
Levy, D.T., 1990. Youth and traf c safety: the effects of driving age, experience, and education. Accid. Anal. Prev. 22, 327 334. Lynam, D., Twisk, D., 1995. Car Driver Training and Licensing
Systems in Europe. TRL Report No. 147. Transport Research Laboratory, Crowthorne, UK.
McNeil, D., 1996. Epidemiological Research Methods. Wiley, Chichester, UK.
Maycock, G., Lockwood, C.R. and Lester, J.F., 1991. The Accident Liability of Car Drivers. TRL Research Report 315. Transport Research Laboratory, Crowthorne, UK.
Mayhew, D.R., Simpson, H.M., 1996. Effectiveness and Role of Driver Education and Training in a Graduated Licensing System. The Traf c Injury Research Foundation of Canada, Ottawa, Canada.
Moe, D., 1992. Foreropplaering klasse B for 16 årillger. (Driver Education for 16-Years Old Learner Drivers). SINTEF Rapport STF63 A92002. SINTEF Samferselsteknikk, Trondheim, Norway. (In Norwegian.)
Murray, A., 1998. The home and school background of young drivers involved in traf c accidents. Accid. Anal. Prev. 30, 169 182. Page, Y., 1995. Jeunes conducteurs, apprentissage anticipé de la
conduite et accidents de la route. Cah. Obs. 2, 15 55.
Pelz, D.C., Schuman, S.H., 1971. Drinking, Hostility and Alienation in Driving Of Young Men. Paper presented at the 3rd Annual Alcohol Conference, Washington, DC.
Rasmussen, J., 1984. Information Processing and Human Machine Interaction. An Approach to Cognitive Engineering. North-Hol-land, New York.
Simpson, H. (Ed.), 1996. New to the Road. Reducing the Risks for Young Motorists. Youth Enhancement Service, University of California, LA.
Smith, M.F., 1994. Research Agenda for an Improved Novice Driver Education Program. Report to the Congress. NHTSA Report DOT HS 808 161. National Highway Traf c Safety Administra-tion, Washington DC.
Spolander, K., 1983. Bilforares olycksrisker. En modell testad pa man och kvinnor. (Accident risks among drivers. A model tested on men and women). VTI Report 268. Swedish National Road and Transport Research Institute, Linköping, Sweden. (In Swedish.) TRB, 1996. Graduated Licensing: Past Experience and Future Status.
Transportation Research Circular 458. Transportation Research Board, Washington, DC.