Evaluation of 16-years
age limit for driver training
First report
Nils Petter Gregersen
N
m
m
H
<
00
Pl
q II-l ha
a.
a.
co
h_
of jOVNIN SBIL
lUVNINGSKURNING *
l
Swedish National Road and
VTI rapport 418A- 1997
Evaluation of 16-years
age limit for driver training
First report
Nils Petter Gregersen
§We ieir
me?
Publisher: Publication:
VTI rapport 418
Published: Project code:
Swedish National Road and
1997
20192
'Transport Research Institute
S 581 95 Linkoping Sweden Project:
Evaluation of 16-years age limit for driver training
Author: Sponsor:
Nils Petter Gregersen Swedish National Road Administration
Title:
Evaluation of 16 years age limit for driver training - first report
Abstract (background, aims, methods, results) max 200 words:
VTI has performed an evaluation of lowering the age limit for practising to 16 years. The evaluation includes several substudies such as analysing how the new system is used and what effects it has on attitudes, driving behaviour and accident involvement. The change was introduced in September 1993 and up to now the effects during the first year after licensing have been analysed.
The main idea behind the lowered age limit was to enable the learner drivers to practice more and thus to increase their experience behind the wheel before they are left alone as drivers. The expectation was that this increased experience would also lead to a reduction in accident involvement.
The results show that approximately 45 50% of the population in this age group have received a learner permit at an age younger than 171/2 years which was the limit in the old system. To some extent the group which makes use of the lowered age limit is special. The results show that 5-10% are from a better social background.
The learner drivers who start earlier increase their hours of practising by 2.5 to 3 times to 118 hours. This is to be compared with an average of47 hours in the old system and 41 among those in the new system who are not making use of the lowered age limit.
The youngest (16 - 171/2 years) were not involved in more accidents during practising than the older ones (171/2 - 18 years), calculated as accidents per driver or as accidents per hours of practising.
Those who start practising earlier have 40% lower accident risk (accidents per kilometre) after licensing compared with the control groups. Part of this difference is due to social differences but a reduction of 35% is evaluated as an effect of the lowered age limit and the increased experience.
ISSN: Language: No. of pages:
Foreword
This is the first report on the evaluation of the 16 year age limit for driver training. The results apply only to certain sub studies and effects limited to a brief period, the first year after having taken the driving licence. A final account of the age limit s effects will be presented in 1999.
The evaluation of the 16-year age limit has continued for a long period of time. Since the project intends to follow a sufficiently large group over a sufficiently long time in order to be able to draw statistically precise conclusions about the effects, at least 5 years are needed after implementation of the system. The new limit was imposed on 1 September 1993. Those who took advantage of this opportunity were ready on 1 September 1995 at the very earliest. In addition, the groups must be sufficiently large so that we are not restricted to only those who took their driver s licences on this date. It is necessary to include an entire year s batch of driver s licence holders. The last of these will take their licences on 31 August 1996, and will be followed up for 2 years until 31 August 1998. Only on this date will all the relevant accident data be collected. To this is added a final trend analysis which is carried out as a questionnaire in spring 1999. If we include the time required to process and analyse the data and write the final reports, the project is calculated to be concluded in its entirety in 1999, fully in accordance with the original project plan.
The Ministry of Transport has requested a report which can form the basis for a decision 5 years after implementation of the reform, i.e. on 1 September 1998. This will be presented on the basis of the data which by then has been collated and processed. The evaluation is carried out on behalf of the Swedish National Road Administration (SNRA). The project manager is Nils Petter Gregersen, and the original supervisor from
the Swedish National Road Administration was Hans Laurell, a post which was
subsequently taken over by Per Olof Grummas Granstrom. The project managers for the various sub-projects at VTI are Hans-Yngve Berg, Sven Dahlstedt, Inger Engstrom, Sixten Nole n and Birger Nygaard. At the Ytongbanan skid pan, a sub-project was carried out under the leadership of the personnel there. Many other persons have been involved in a variety of ways in the evaluation process. This applies to all the students and instructors, various contact persons and those involved from Swedish National Road Administration, research colleagues and other representatives from various organisations who have participated in discussions, planning and the implementation of the project thus far. Without naming each and every one by name (and thus avoiding the risk of accidentally excluding any names!) I would like to offer my sincere thanks to everyone for their immense efforts and for the huge variety of their opinions which helped ensure that this evaluation could be carried out properly. Ann Sofie Senneberg at VTI was responsible for printing and layout of the report. The report has been translated into English by Ilya Meyer, Transtext AB. My heartfelt thanks to all concerned.
The planning group consisted of:
Hans Laurell Swedish National Road Administration Christer Drangel Swedish National Road Administration Ingemar Seger STR (driving school association)
Bjarne Grahn STR (driving school association)
Ake Ahsblom TR (driving school association) Sixten Nolén VTI
Nils Petter Gregersen VTI
The reference group consisted/consists of the following representatives who have participated during various phases:
Hans Laurell Swedish National Road Administration Per Olov Grummas Granstrom Swedish National Road Administration Christer Drangel Swedish National Road Administration Hans Mattsson Swedish National Road Administration Erik Hakansson Swedish National Road Administration
Hakan Ostlin
Swedish National Road Administration
Krister Spolander Statistics Sweden Sixten Nolen VTI
Hans-Yngve Berg VTI Inger Engstrom VTI Nils Petter Gregersen VTI
Bj arne Grahn STR (driving school association)
Goran Bryding Department of Statistics, Uppsala University/STR PA Rimmo Department of Psychology, Uppsala University
Ake Ahsblom TR (driving school association) Ake Larsson TR (driving school association)
Hakan Ardemark Orebro County road safety association Alf Johnsson Ytongbanan skid pan
NOTE!
Several sub-studies have not been implemented.
This report refers to the rst batch of
driving-licence students and their rst year with their
licences. Several sub-studies, among them a
longer-term follow-up, remain to be done. The
evaluation will be presented in its nal form in
1999.
Contents
_ L _ L _ L _ L _ \ A C D N I I-3.1
3.2
3.2.1
3.2.2
3.2.3
3.2.4
3.3
3.3.1
3.3.2
4.1 4.1.1 4.1.2 4.1.3 4.1.4 4.2 4.2.1 4.2.25
6
7
SummaryIntroduction
About experienceLowered age limit for driver training
Trial operations which were not implemented
Training from the age of 16, the structure of the Swedish
system
Purpose of the study
Methods
General design discussion
Methods of the process analysis
Questionnaire to students immediately after they received
their licences
Diary notes during driver training
Analysis of register data from driving licence register
Analysis of accidents during driver training
Methods of the effect evaluation
Questionnaire to drivers 1 and 2 years after licensing
Analysis of accidents after licensing
Results
Results of the process analysis
Participation
Amount of driver training
Driver training, contents and structure
Accidents during driver training
Results of the effect evaluation
Accident involvement
Attitudes and self-assessment
Timetable for continued work Discussion and conclusions References
Appendix 1 Attitude-related questions in the questionnaire
VTI rapport 418A
Page
11
11
14
16
17 182O
2O
21
21 22 25 25 26 26 273O
3O
3O
32
39
43
45
45
54
59
6O
62
Evaluation of 16-years age limit for driver training - First report
by Nils Petter Gregersen
Swedish National Road and Transport Research Institute (VTI)
S-581 95 LINKOPING
Summary
VTI has performed an evaluation of lowering the age limit for practising to 16 years. The evaluation includes several substudies such as analysing how the new system is used and what effects it has on attitudes, driving behaviour and accident involvement. The change was introduced in September 1993 and up to now the effects during the first year after licensing have been analysed.
The main idea behind the lowered age limit was to enable the learner drivers to practice more and thus to increase their experience behind the wheel before they are left alone as drivers. The expectation was that this increased experience would also lead to a reduction in accident involvement.
Different methods have been used in the evaluation. The process evaluation includes diaries from learner drivers, questionnaires from randomly drawn samples of the learner driver population and analysis of police reported accidents during practising. The effect evaluation is performed by analysing police reported accidents after licensing and questionnaires to the learner drivers one year and two years after licensing.
The general design of the evaluation has been to compare three groups. One of the groups includes those learner drivers who have made use of the new system and the other two groups are control groups, one from the old system before the change and one from after the change but with learner drivers who have not used the new age limit.
In this first presentation of results one should be aware of the fact that it is only the first group of learner drivers in the new system that has been analysed. This group may be special and the effects may not be the same when a larger group has been followed during a longer period. The results from such a longer follow up period will be presented later. A final report is planned to be published during 1999.
The results show that approximately 172 000 youngsters have received a learner permit at an age younger than 171/2 years which was the limit in the old system. This is 45 50% of the population in this age group. To some extent the group which makes use of the lowered age limit is special. The results show that 5 10% are from a better social background.
The learner drivers who start earlier increase their hours of practising by 2.5 to 3 times to 118 hours. This is to be compared with an average of 47 hours in the old system and 41 among those in the new system who are not making use of the lowered age limit. It is the private training that has increased. The professional training at the driving schools is about the same as before, on average about 11 hours. The difference is that the 16 year olds tend to wait with their driving school training until the end of the training period which is different from the old system where the driving school training was evenly distributed.
There was a worry at the time the system was introduced that the young learner drivers would be involved in more accidents during practising. This has not been found to be the case. During the first 3 years there were 85 accidents reported by the police where the learner driver was younger than 18. The youngest (l6 - 171/2 years) were not VTI rapport 418A I
involved in more such accidents than the older ones (171/2 18 years), calculated as accidents per driver or as accidents per hours ofpractising.
Those who start practising earlier have 40% lower accident risk (accidents per kilometre) compared with the control groups. Part of this difference is due to social differences but a reduction of 35% is evaluated as an effect of the lowered age limit and the increased experience. These results also seem to be traced in the national accident statistics. Accident involvement (accidents per licence holder) among young drivers decreased during the period 1990 to 1993 when the trend turned upwards and the accidents increased up to 1995. This upward trend stopped again during 1996.
Attitudes towards traffic rules, speeding behaviour, drunk driving etc. have not changed as an effect of the increased experience.
The main conclusion of this first part of the evaluation is that the system with lowered age limit has contributed to a higher level of experience and a lower accident risk. Through this approach is has been possible to reach one of the main problems of young drivers, their lack of experience. This system may thus serve as a basis for further development in order to reach other problems that contribute to young drivers high accident risk.
Such further development includes measures for even more efficient increase of experience and knowledge but also for increased risk awareness, reduction of overestimation among young men, increased insight about the in uence of life style, peer groups etc. on driving behaviour and accident risk. One important further challenge is to make the young driver more motivated to drive safely.
1 Introduction
Several recently published analyses of youngsters accident-involvement have drawn attention to the fact that the largest contributory factor is their lack of experience. Over a long period of time, there has been considerable discussion as to which factors were the most important, age-related or experience related factors. There is nowadays a reasonable degree of agreement that experience is responsible for the largest proportion ' of accident reduction during the first years (see Gregersen 1996 for an overview).
Age-related factors relate normally to parameters such as lifestyle, maturity, social circles, parameters which are related to the liberation process and development process which young adults undergo, etc. Experience-related factors relate to things such as learning to drive a car, building up routine and the ability to handle the car, assess risks
CtC .
1.1 About experience
The fact that one requires experience in order to be a good and safe car driver is self-evident. In the traditionally presented age distribution pattern relating to accidents and accident risks, however, it is difficult to see if young drivers successive accident reduction stems from the fact that the drivers become more experienced or because they become older, since the two follow each other closely. Various studies have been implemented to differentiate between the two factors explanatory value and some studies have shown that those who drive more have fewer accidents per kilometre (Spolander 1983, Pelz and Schuman 1971).
In an English study (Maycock et al 1991) a large number of new drivers who had taken their driving licences at various ages were followed up. Here one found that the initial risk was high in all age groups and that the risk dropped with increased age and experience. However, risks associated with new drivers were far higher among the youngest new drivers and decreased gradually the older they were when they first received their driving licences (Figure 1). In statistical terms, accidents which occurred during the first eight years were reduced by 59% owing to experience and by 31% owing to age.
, Similar results were also shown in a Canadian investigation of accident involvement among new drivers aged 16 55 (Cooper et a1 1995). Here too it was seen that all age groups had a high accident rate with new drivers. The youngest drivers, the 16-year
olds, turned out to have the highest accident involvement.
These levels have varied in various investigations. If we weigh together the various results from the different surveys, we can see that age related factors are expected to account for about 30-50% of the accident reduction while experience accounts for 50-70%.
A common model for explaining why experience lowers the accident risk is that new drivers go through several phases where they have to learn to handle the large number of assignments which are included in driving a car. The new driver is faced with many new situations and tasks, all of which require mental resources. The perceptual situation is new and imposes special requirements on visual search skills, and interpretation of what is happening around him/her. The new driver cannot handle situations as well as the experienced one. The mechanical handling of the car itself also requires a certain mental capacity involving a number of controls, levers, stalks and warning devices which must be used and co-ordinated in a complex pattern. The entire traffic
environment with its rules, regulations and requirements for certain specific behaviour patterns also increases this mental workload.
0.8 MILEAGE: 7500 m/vr. 1:(U EXPERIENCE (Years): E A A Age - 17 g 0.6 \ B Age ZO g \ C Age 25 '8 D Age 36 E E - Age 50 > U C 3 D 0.4 '-2 EO) .12 8 (U E 0.2 -U s O. 0 l l l l l 10 20 30 4o 50 60 70
Age (experience) (years)
Figure 1 Predicted e ect of age and driving experience on accident risks (Maycock et al 1991)
Over a period of time, however, more and more of these tasks will become
automated and the mental workload will reduce. This assumption is supported not just by studies of visual search patterns (Mourant and Rockwell 1972) but also by studies of extended reaction times (Quimby and Watts 1981).
One way of describing this development is presented by Rasmussen (1984). He is of the opinion that in the process of developing skills one goes through three levels of
behavioural control. He describes the knowledge based, the rule based and the skill
based levels. At the knowledge based level new behaviour takes place when one does not have already-worked-out solutions. This behaviour is controlled by reasoning and by knowledge whichone obtains both from previous experiences from other situations and also by means of help from others. As one's own and others' know how and experience are gradually integrated into one's own set of rules or mental models, so too does this behaviour gradually change to become controlled by the rule based level. With increased experience this rule based behaviour is gradually automated and in its most developed form can be carried out without conscious attention and control. At this stage one has reached the skill based level. As skills are utilised and developed so too more and more tasks are linked together until they finally form a complete behavioural complex which is executed without conscious attention so long as no unexpected deviations occur. As soon as a deviation does occur one switches either to the rule based behavioural control if one has ready-made rules to fall back on, or to the know-how based level if one must solve this problem from the very beginning. In a complicated
assignment such as driving a car, one therefore switches between the various levels
depending on which particular task one has to solve at any given moment in time.
If this theory is applied to car driving, one can regard the formal rules and instructions which are formulated by the various authorities and which are passed on by the driving school instructor as a typical example of the first stage of learning to drive
(Brown et al 1987). One s own experiences from other traffic roles are also examples of
parameters which are used to build up one s know-how, thus creating a set of usable rules governing how one should behave in various traffic situations. Gradually, as one is confronted with increasing numbers of traffic situations and since increasing numbers of driving tasks are integrated with each other and are automated, attention can be turned towards interaction with other road users. At this development stage behaviour will, however, to begin with, continue to be extremely rule based. Over a period of time the formal rules and control skills will become increasingly integrated and impressions and experiences from traffic itself and from interaction with other road users will take on an increasingly dominant role in driving behaviour. At this stage it is easier to carry out several tasks at the same time since they do not impose a considerable mental workload.
In practice this also means that a novice car driver does not have so many ready-made rules to fall back on from previous situations, but must instead use what is on offer, namely the formal rules, those which are described in legal texts and in instructions. However, the fact is that the formal system of rules is really only an attempt to control traffic in certain specific situations. These rules are not all-encompassing. It means that traffic is of course controlled by rules and regulations, but that the ow of traffic cannot be described with the help of these same rules. There is so much else which takes place which is determined by such factors as our feelings, our moods, our motives and social norms. Our driving behaviour is also largely determined by "informal common sense based" rules which do not always match the formal rules very closely, and which from a road safety view point, may be either beneficial or disadvantageous. These informal rules about how one should behave take increasing amounts of our attention over a period of time as one frees oneself mentally from the physical task of manoeuvring the car and from attention to the formal rules and regulations. Examples of informal rules are allowing other road users the right of way even if one formally has right of way oneself, to drive slightly above the speed limit because "everybody else" does so, to warn other road users of police speed checks, not bothering to use turn indicators, to realise that the right of way rule is seldom applied in practice, and to realise that many other road users are unpredictable and often ignore traffic rules and that this therefore requires extra caution etc.
Although many studies have shown or discussed mental workloads in the driving task, the specific implications for young novice drivers are unclear. Several studies have shown that experienced drivers observe risk situations more quickly than novice drivers (Soliday and Allen 1972, Ahopalo et a1 1987, Quimby and Watts 1981, Finn and Bragg 1986) which supports the theory of automation and mental workloads.
Those studies which Mourant and Rockwell (1972) undertook indicate that young
drivers shortcomings in visual search skills are linked to their high mental workload behind the wheel. A comparison between novice drivers and experienced drivers showed that novice drivers looked more often at the front of the car and more to the right, looked more seldom in the rear view mirror and moved their focus more frequently. They were also not as skilled at exploiting their peripheral vision as the more experienced drivers.
Much research has been conducted into visual search skills and attention (see for example Wickens 1992), but not very much has dealt with its application in relation to young novice drivers. In a review of literature Aberg (1981) shows that there are certain VTI rapport 418A 13
processes which are linked to experience. He describes so-called "predictive head movements", which means that the head is moved before eye movements begin, when one searches after an object which appears in one s peripheral field of vision. Mourant
and Grimson (1977) found that experienced drivers use more predictive head
movements than new drivers, which is interpreted as new drivers not using their peripheral vision as effectively as experienced drivers. Aberg also reviews literature about the perceptual automation process which is probably closely related to the automation process for driving behaviour as described above. Perceptual automation is explained as a process whereby repeated experience of specific stimuli leads to automatic discovery. In environments where stimuli are not changed a lot, a car driver may switch to automatic perception and thus lose his conscious searching for critical events such as wild animals by the roadside. This is entirely in line with Aberg s result, that when attention is directed towards oncoming traffic the driver may in fact miss noticing an animal at the side of the road even though he is looking straight at it. This process was also shown in an experiment (Aberg 1981) in which drivers who were instructed to look for an elk at the roadside discovered the elk more often than those who drove normally without having had this specific instruction.
1.2 Lowered age limit for driver training
It was previously felt that this problem of lack of experience was difficult to solve. Obtaining experience meant that one was required to accumulate hours behind the wheel, specifically during the period of one's driving career when one was most prone to accidents, that is to say the first years after having taken one's licence. It was in order to get around this paradox that the question of lowering the age limit was taken up in Sweden. The purpose of the 16 year age limit was therefore to focus discussion on the lack of experience among novice drivers and to develop a possibility for increased driver training. The fact that it was possible to use driver training for this purpose was realised in Sweden already earlier when we lowered the age limit to 17 years and 9 months and later when it was lowered in a further stage to 171/2 years. However, these changes have not been evaluated.
During the 1980s France was something of a trend setter when in 1984 the French lowered their limit for driver training to 16 years but retained the limit of 18 years for holding a driving licence. The French training system also includes compulsory training in a driving school, recurrent meetings within the driving school environment etc. It began in a limited area of France, two counties, which in 1986 was expanded to include 20 counties. In 1988 the model was implemented throughout the country. In 1990 there were reports of considerable success from France and in the same year the relevant representatives from the French Ministry of Transport were invited to Sweden to present a detailed account of their experiences. Figures such as a 70% accident reduction rate were mentioned as a result of the lowered age limit and there were reports that the traditional high accident involvement among young novice drivers had simply evaporated among those who had utilised the new system (Fafet 1990). This helped spur discussion in countries such as Sweden. Interest in a lowered age limit was considerable in Sweden and in several other European countries. Changes to the age limit were implemented in Sweden on the 1st of September 1993. It turned out eventually that there was no scientific backing for the claims regarding huge accident reductions which had been reported from France. Subsequently another two smaller surveys were carried out. The first by the University of Toulouse which showed a smaller effect than that which had been reported previously, approximately 30%. The second survey, carried 14 VTI rapport 418A
out at INRETS, could not show any effect at all. Both these studies are subject to major methodological problems since they are small and took place after the event and do not use comparable groups.
100 80 ~
g 60 ~
2g 40
20 ~ 0Design 1 Design 2 Design 3
Proportion of 16 year olds
100
Ea) £3a)
0.
Design 1
Design 2
Design 3
Proportion of parents
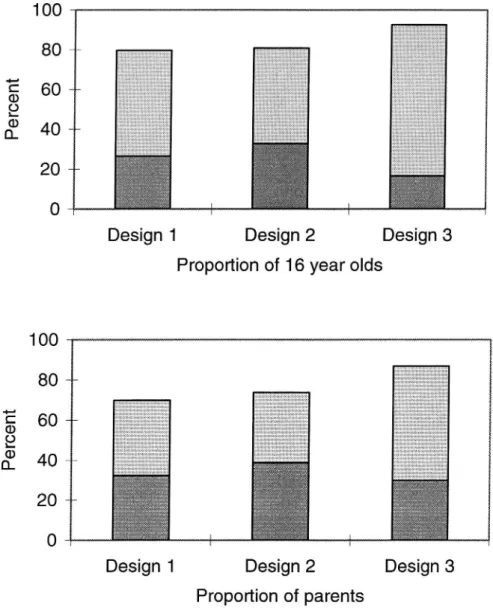
Figure 2 Results om the survey of interest among youngsters and parents when planning for a lowered age limit (dark grey=most probable;
lightgrey=absolutely)
One problem in the French application was that the focus on compulsory elements meant that relatively few youngsters chose to take advantage of the new opportunity. About 5 10% are said to have participated whereas the rest preferred to wait until they had turned 18 when they were able to choose their own particular training form more freely. As also the Toulouse study showed, there were probably major differences between those who participated and those who chose to wait. A similar concern was also apparent in Sweden, that only a small proportion of the eligible students would take the trouble to begin earlier. In order to determine just how the relevant groups would react to the proposed changes, VTI undertook a survey among youngsters and parents
(Nolén and Gregersen 1990) which showed that interest was considerable. The level of
interest varied somewhat depending on whether they could expect any compulsory elements or a voluntary system, but in both cases the interest was very high (see Figure 2).
1.3 Trial operations which were not implemented
The change in Sweden was implemented after a relatively long period of discussion and planning which dealt with how the system was to be structured and how it was to be evaluated. Following a request from the Swedish Road Safety Office(which later was incorporated in Swedish National Road Administration), to the Ministry of Transport to be allowed to implement a trial operation, the Ministry instructed the Road Safety Office to discuss with VTI and STR (one of two organisations of Swedish driving schools) to structure a limited trial operation. The planning group which the Road Safety Office appointed carried out these discussions which resulted in a number of different proposals and eventually lead to three alternative designs to chose between.
The first was training including a compulsory driving school element which in its initial period resembled the training undergone by those who went to driving school at that time. After this initial period the students would be allowed to continue to accumulate hours behind the wheel by driving privately until the date of their test which would be carried out as normal.
The second variant was based largely on the French model but was modified considerably. Here too one would begin with a driving school element but the driving school theory would be integrated with practical driving on a private basis. The private driving instructor or supervisor was also required to take part in the professional training. After this period was concluded the student would sit a theory test in the driving school and would then be allowed to drive for a long period of time under driving-school auspices or to drive privately with a supervisor. During this period the student was required to return to the driving school three times to check on his progress and to benefit from any advice which the instructors would provide for future driving practice. This training would also include skid pan driving as before, and would be concluded with a practical test under the auspices of Swedish National Road Administration.
The third model which was discussed was to also include a group which was trained according to the model which was in force at the time, namely to choose freely towhat extent they wanted to use a driving school or to learn to drive privately.
During an initial period there was also a proposal for a combination with senior high school education but this was never put through.
Discussion in the working group led to a proposal in which all these three models would be compared , after which one could take a decision as to which was best. The proposal was discussed in detail during a special methodology seminar which was attended by about 25 persons from various parts of the road safety area. At this time there was no political will at the Ministry of Transport to include compulsory elements if it was not proven that they did actually improve safety. However, there was no such proof in the scientific literature of the time, which was the most important purpose of including the free group; that is to say, to be able to scientifically compare a group relying on traditional driving school training with another group combining driving school and private tuition as well as a traditional training involving free choice. The planned comparative study would also include two control groups with training from 171/2 years. In this way it would be possible to use various comparisons to highlight the
effect of the two variants of compulsory driving school training and the effect of increased experience.
Since there was considerable lack of unity among the representatives of the planning group, particularly as regards whether or not the free group should be included in the evaluation, no uniform proposal could be submitted to the Ministry of Transport. The planned comparative study was never implemented. Discussions continued for several years (1990-1993), not least in the form of debates in the mass media and eventually the government decided in 1993 not to include any new compulsory elements but to allow the traditional principle of free choice to apply also for the 16-year olds. In 1993 VTI was charged with evaluating the reform instead of implementing the planned experimental comparison.
The ongoing evaluation process has been assisted by a reference group consisting of
representatives from Swedish National Road Administration, VTI, the two driving
school associations TR and STR, the Department of Psychology, Uppsala University and Ytongbanan skid pan (which is undertaking a sub-project).
1.4 Training from the age of 16, the structure of the Swedish
system
There are now two possibilities in the Swedish system for driving licence training. One is to begin early with practical driving and the other is to wait until one has turned 171/2. If one chooses to begin early one has to apply for and receive a learner's permit, and one has to be linked to one or more personal supervisors. In order to be accepted as a supervisor one has to have had a driving licence continuously for the past 5 years, that is to say without it having been recalled by the authorities and one must be at least 24 years old. If one waits until after one has turned 171/2 no certificate for the supervisor is necessary. Anyone who meets the age and driving licence requirements may act as an instructor or supervisor. If one chooses to learn to drive privately, here too the student must have a learner's permit but if he chooses to go through his entire training at a driving school then registration with the school itself is sufficient. In both systems the 16 year and the 171/2 year the choice is free to which degree one wants to go through the training in a driving school or privately. Skid pan training lasting about half a day is compulsory for both groups.
2 Purpose of the study
The assignment which was granted to VTI for the study related to "an evaluation and follow-up of lowering the age limit for driving practice to 16 years". This has been developed by the reference group which was linked to the project to relate to a) a follow-up of how the new system functioned and was used, that is to say a process
analysis and b) an evaluation of the training s effect on attitudes, self assessment,
exposure, driving behaviour and accident involvement/accident risk. Table 1 describes brie y the purpose of each and every one of the studies which are included. The studies are presented in greater detail in the following sections. The table also shows brie y the assumptions regarding effects which form the basis for the structure of the studies. Table I Subsections in the evaluation of the 16 year age limitfor driver training
(*=covered in this report)
Sub-studies Aim Hypothesis
Process analysis
1. Questionnaire to students Collection of data about driving No hypothesis immediately after licensing* practice and accidents during
training
2. Diary notes during driver Collection of detailed data No hypothesis
training* about driver training patterns
3. Questions of exposure after Collection of exposure data for No hypothesis
theory test driving practice
4. Analysis of register data Collection of data on No hypothesis
from driver licence register* participation among students
and supervisors
5. Analysis of accident data Collection of information about No hypothesis
from SCB* and SNRA police reported accidents
during practising
Effect evaluation
6. Questionnaire to students Collection of data about self 16-year olds show different
immediately after licensing* assessment and attitudes answer patterns compared
to control groups
7a.Questionnaire to students 1 Collection of data about self 16-year olds show different
year after licensing* assessment and attitudes, answer patterns, driving
driving habits, exposure, errors, behaviour and lower
accidents etc. accident involvement
compared to the control
groups
7b.Questionnaire to students 2 Collection of data about self 16-year olds show different
years after licensing assessment and attitudes, answer patterns, driving
driving habits, exposure, errors, behaviour and lower
accidents etc. accident involvement
compared to the control
groups
8. Travel habit survey Collection of data about travel Background data for
habits, exposure etc. analysis
9. Analysis of accident data from SCB*
Collection of data about police reported accidents involving
personal injuries, both to
evaluate effects and to analyse
trends in accident development
among young drivers
16-year olds show lower
accident involvement
compared to the control
groups
10.Analysis of accident data
from SNRA
Collection of data about police reported accidents involving personal injuries or damage to
property
16-year olds show lower accident involvement
compared to the control
groups 11.Annual questionnaire to
young drivers during 5 years
Collection of data to analyse
trends in attitudes etc. among
young drivers
No hypothesis
12.Questionnaire to students in
the city of Crebro Evaluation of special courseinvolving 3 days of training at
the Ytongbanan skid pan
Specially trained 16 year olds show different driving
habits and lower accident involvement compared to the control groups
13.Behavioural study, mental workload
Experiment to measure the effects of experience on mental workload
16-year olds show less
mental workload during
driving than the control
group
14.Behavioural study, eye movements
Experiment to measure the
effects of experience on visual
search patterns
16-year olds show more
highly developed visual
search patterns than the control group
15.Behavioural study, choice of safety margins
Experiment to measure the effects of experience on choice of safety margins
16-year olds drive with
greater safety margins than the control group
Apart from the subsections financed by Swedish National Road Administration
which are shown in Table 1, a further two papers have been written by the Institute of
Pedagogy and Psychology at the University of Linkoping. One deals with how the driver training pattern is in uenced by lifestyle (Eliasson, Palmqvist and Berg 1996) and the other deals with how the driver training quantity in uences one's ability to reason one's way through various traffic situations (Hjelm 1996). A special study is also made of drivers' errors based on data from the questionnaires in the project. This is carried out at the Department of Psychology at Uppsala University. The introductory section also mentions the survey to chart potential interest which was carried out by VTI early on in the planning discussion (Nolén and Gregersen 1990).
The purpose of this report is firstly to present an account of the experiences relating to how the new opportunities have been exploited and secondly to present the partial results from a first follow-up of certain effects one year after the students took their driving licences according to the new training model.
3 Methods
A number of different measurement methods and a sample of trial persons were used and will be used in the various studies. For example in questionnaires, samples from the driving licence register have beenused while in accident analyses we have used the entire population of drivers. In the forthcoming sections the methods used for each individual study will be detailed. The presentation will be limited to those studies whose results will be accounted for in this report. For the other subsections we refer you to the relevant author or to forthcoming publications on this project. Initially however, we will present a brief presentation of the design discussion which took place before the project started.
3.1 General design discussion
The planning discussion took a very long time and was dominated entirely by the structure of a controlled trial operation. Since this did not materialise and the rules for the age limit were implemented generally, there was still a relatively limited period of discussion around the final evaluation design. Since the assignment related to an evaluation of a reform which was implemented at the same time throughout the country it was not possible to structure an experimental design and define a control group which was entirely similar to the so-called trial group, that is to say those youngsters who took advantage of the possibility to begin their driver training earlier.
Two possibilities were available. Firstly a design whereby we compare those who take advantage of the lowered age limit with those who choose to wait until they have turned 171/2, and secondly where we compare the trial group with students from the time before the age limit was changed. Both of these have obvious disadvantages. The comparison between the trial group and those who choose to wait means that we obtain a built-in differential between the group, namely those background variables which persuade the control group to wait. There is uncertainty as to which factors these may be and it is therefore difficult to maintain adequate control over them. With such a design there may be uncertainty as to what proportion of the measured effects should be allocated to the changed age limit or the differences which in any case are in evidence between the groups.
In the before and-after comparison we have a different problem, namely the risk that youngsters' attitudes to car driving or their accident involvement may change over a period of time for entirely different reasons than the changed age limit. We can imagine changes in youngsters' values over a period of time, for example trends relating to car driving and the environment, changed rules relating to traffic, climate changes, society's economy, unemployment etc. A measured difference between the before-and after change may thus be allocated both to the new age limit and to other changes in society. Neither of the two designs can thus offer complete accuracy in terms of the analysis or the conclusions to which they lead.
In order to reduce these problems as much as possible, a decision was taken that both the designs would be combined by choosing two control groups. One from before the change and one consisting of students who wait until they are 171/2. With this two-way comparison, it is possible to draw more accurate conclusions regarding the effects. In order to obtain control over the social trends which may in uence youngsters' behaviour as car drivers, so-called trend analyses were to be implemented over a 5-year period, from the start of the project until the follow-up is concluded. The trend survey covers both a series of 5 surveys involving young drivers and also an analysis of developments 20 VTI rapport 418A
from accidents reported by the police in general and for young drivers in particular during this period. A schematic description of the evaluation design is shown in Fig. 3.
Start + 2 years + 4 years
wears;
om 171/2-years:
|
n...
E
=evaluation
Figure 3 Design ofthe e ect evaluation
The complete model was used in those studies where this was possible, that is to say, questionnaires and accident analysis. For the other studies, special samples were drawn.
In the rest of this paper the trial group will be designated the "l6-years" group, the control group from before the measurement will be referred to as the "old 171/2-years group and the control group which waited will be referred to as the "new 171/2-years group.
3.2 Methods of the process analysis
The process analysis includes studies to measure both how many people take advantage of the new possibilities and the way in which this is done.
3.2.1 Questionnaire to students immediately after they
received their licences
Design and sample
The samples drawn for this survey follows the general design, that is to say that it consists of youngsters from the three groups aged 16, the old 171/2 and the new 171/2. The samples was drawn randomly from the driving licence register.
Since the driving licence register does not contain information about the date of the learner driver permit for students in the 171/2 year groups who carried out their training only in driving schools, the division into groups has taken place partly on the basis of the questionnaire responses.
The samples consists of 1,000 people from the old 171/2 year group, and 2,000 from the 16-year and new 171/2-year groups together. The samples were drawn in two batches. For the old 171/2-year group it was necessary to make the measurement before they were "mixedin" too much with the new system. The samples were therefore drawn among them who had taken their licences during September 1994. There was a certain risk of mixture with the new students since those who had begun their driver training at the age of 17 in September 1993 when the age limit was lowered might have taken their VTI rapport 418A 21
licences in September 1994 when the samples were drawn. However, this proportion turned out to be very small indeed and was removed from the sample on the basis of the questionnaire responses.
For the new 171/2-year group and for the 16-year group the samples were drawn from
among those who took their licences in September 1995, that is to say, they had had the
possibility of taking part in the two-year training period to the very full. Since it was not possible to see from the driving licence register when the new 171/2-year group began its training, a sample of 2,000 were drawn and subsequently divided on the basis of the questionnaire responses. Table 2 shows the sampling process and the response percentage. The response percentage is 73% and 78% respectively. No dropout analysis has been performed.
Mail shot
The questionnaires were sent by mail. The envelopes included the questionnaire, a follow-up letter and a freepost reply envelope. Two reminders were sent. In the first it was only a reminder and in the second the reminder was accompanied by a new questionnaire and a new freepost envelope.
Table 2 Sample size and response percentage for the questionnaire immediately after licensing
Group Sample size Number of Response
answers percentage
16-year 2,000 862 73%
New 171/2-year 595
Old 171/2-year 1,000 782 78%
Contents of the questionnaire
In addition to a number of background questions about sex, education, living accommodation etc., the questionnaire also included questions designed to highlight how the training was implemented, how the students had assessed their training, how they regard themselves as car drivers, attitudes and self-reported accidents which occurred during driver training. Some information from the questionnaires about such things as attitudes and self assessments are utilised only in the effect evaluation (section 3.3.1).
Statistical analyses
Comparative tests were performed using the chi2 analysis or t-test where the significance level was set at 5%.
3.2.2 Diary notes during driver training Design and sample
The design of the diary survey follows the general design for the evaluation, that is to say three groups are used, 16 year olds and the new and old 171/2-year olds.
The purpose of the diary notes was to collect detailed information about how the driver training was implemented. This also includes studying how driver training changed during the training period and whether there are any differences between the groups. In order to make this possible a large number of sub samples were drawn, each of which represented a special point in time during the training course, after two or four 22 VTI rapport 418A
months etc., until the final phase of the training. The presentation period for each sub-sample was one week. Each sub-sub-sample consisted of 150 or 200 people drawn from the driving licence register.
16-years Driving Measure week
A permit +2 mth. +6 mth. I +10 mth. I +14 mth. I +18 mth. I +22 mth. I +26 mth. I +30 mth. +34 mth. 1 o x 2 o x I 3 o x I 4 o X I 5 o x I 6 o x I 7 o x I 8 o x I 9 o x New Driving Measure week
171/2-years permit +2 mth. +4 mth. I +6 mth. I +8 mth. I +10 mth. I +12 mth. 1 o x 2 o x I 3 o x I 4 o x I 5 o x I 6 o x
16-years Driving permit Measure
B -26 mth. -22 mth. I -18 mth. I -14 mth. I -12 mth. I -8 mth. -4 mth. week 1 o x 2 I o x 3 I o x 4 I o x 5 I o x 6 o x 7 o x Old Driving permit Measure
171/2-years -10 mth. I -8 mth. I -6 mth. I -4 mth. -2 mth. week 1 o x 2 I o x 3 I o x 4 o X 5 o x
Figure 4 The design of the diary notes during driver training. 0=date of driving permit; x=date of measurement
The layout variedsomewhat between the groups. For the old 171/2 year group it was necessary to make a retroactive study. Here five sub-samples were drawn, based on
those who had done their training for different periods of time, making a total of 750
people. All these people were required to fill in their diaries at the same time in week 5, 1995 (section 4 in Figure 4).
For the new 171/2 year olds a larger sample were drawn (1,200) consisting of students who had started their training in September 1994. They were divided into six sub-samples which were then used every second month for a period of a year (section 2 in Figure 4).
For the 16-year group the same principle was used, a larger group (1,800) of 16 year olds was selected at the end of 1994 and divided up into 9 sub-groups each of 200 students (section 1 in Figure 4). Since the training period was estimated to last about two years the measurements were set at every fourth month. The measurements began in February 1995. The last measurement will be made in October 1997, so those results which are presented here do not include all the subgroups. For the 16-year group a supplement was therefore made. An extra group of 1,050 16-year olds was selected according to the same retroactive principle as for the old 171/2-year group. It consisted of 7 subgroups who had been undergoing their driver training for different periods of time
(section 3 in Figure 4).
Mail shot
The form together with the follow up letter and a freepost reply envelope was sent by mail. The students received this on the Monday after the week of measurement. The reason for waiting until afterthis week was that the request to register the driver training was assumed to in uence the willingness to practice driving. A prospective account, that is to say, to receive the form in advance, could be assumed to result in a better quality account, for example owing to less forgetfulness, but in the balance between the advantages and disadvantages between the two alternatives the retroactive registration approach was adopted.
The response percentage varied between the various subgroups between 62 and 94%. The average reply percentage in each group is shown in Table 3. No dropout analysis is
done.
Table 3 Sample size and response percentage for diary survey during driver
training
Group Sample Response Min. - max. in
size percentjge subgroups
16-year 1,800 + 1,050 = 2,850 83% 62-94%
New 171/2-year 6 x 200 = 1,200 74% 67-79%
Old 171/2-year 5 x 150 = 750 68% 65-73%
Contents of the questionnaire
The diary consisted of a form with boxes to be filled in with a cross or with the number of minutes for the various types of driver training every day of the week in different street environments, in daylight and at night. The distribution between driving school and private training was also to be specified. For those who had not driven at all during the week there were also a number of follow-up questions regarding why, and a request to specify if there were any plans for forthcoming driving practice etc.
Statistical analyses
Comparisons were tested using chi2 analysis and the t-test. The significance level has
been set at 5%.
3.2.3 Analysis of register data from driving licence register Design and sample
One of the main questions was how large a proportion of youngsters chose to take advantage of the lowered age limit. This is measured with the help of information from the national driving licence register. Since the new system requires a learner driver permit for everyone it is possible to obtain this information for the 16 year group directly from the driving licence register.
For the 171/2-year olds, however, this was not possible since there is no information about driving licence permits for those who carry out their training only under the auspices of a driving school. A correct comparison between participants in the 16-year group and the 171/2 year groups is thus not possible. However, the proportion of 16-year olds will be compared with an approximation of the 171/2 year old groups, based on later years' driving licence statistics and population sizes.
No samples were drawn but the analysis is based on total figures from the driving licence register and population statistics during the first 21/2 years of this system, that is to say from the lst of September 1993 to the lst of March 1996.
Statistical analyses
The proportions are compared with the help of the t test. The significance level is set to 5%.
3.2.4 Analysis of accidents during driver training Design and sample
These accident analyses refer to accidents during driver training. The comparison does not follow the general design since available data does not permit this. A comparison is instead made between driver training accidents which have occurred with drivers aged
16-17% years and drivers from 171/2-18.
Data collection
Accidents during driver training are registered by the police. The report form contains a special box to be filled in if an accident occurred during driver training. Collection of accident related data has been carried out gradually by collecting the report forms. A significant part of the follow-up process was to be able to stop the new system if it turned outthat the 16-year olds together with their supervisors were involved in too many serious accidents.
NOTE! It has not been a purpose of this evaluation to make a general comparison between driver training accidents in private and driving school environments. The accidents are analysed in order to see the e ects of the lowered age limit and the comparisons are therefore limited to driver training between 16 and 18 years. Driver training accidents with students who are 20 years old, for example, are thus not analysed in this evaluation. Other surveys, however, have shown that accidents do occur during driver training. Ifall the ages are included then statistics show that a total of 259 accidents were reported by the police involving driver training in the period
om September 1993 to August 1996.
The results in this report are based on information from SCB (Statistics Sweden) and therefore contain only accidents involving personal injuries according to the rules for the police reports. The intention is to utilise the opportunities in the Swedish National Road Administration s registration, which also includes accidents reported by the police involving damage to property. This analysis has not yet been carried out.
The use of accidents reported by the police also brings with it certain problems since registration ofsuch accidents is linked with certain shortcomings. Several studies have shown that there is a signi cant grey area, that is to say, a large number of accidents which are not reported although they meet the criteria for reporting. This grey area is most marked in accidents involving single vehicles and unprotected road users, for example cyclists, and it is lowest when fatalities are involved. In a comparative study we have to assess whether this grey area is different in those groups which are to be compared Only ifwe arrive at the conclusion that willingness to report varies, will a comparison be problematic. In this study the assessment is that the willingness to report accidents should not be affected so the grey area for the groups is the same. If this is true, then a comparison is also correct. However, this precondition is based on an assumption which cannot be veri ed, so the result must therefore be evaluated on the basis ofsuch a reservation.
Contents of the report form
Every accident report contains an amount of information about the accident. In addition to personal information about the driver and injured passengers, there is information about the severity of the injury and damage, the time, place, and conditions at the time of the accident, among them the condition of the road, the parties involved and whether there is any suspicion of alcohol being involved.
In this report we only account for the number of accidents on the basis of private/driving school training, subsequent injuries and age group. Other details about accidents during driver training are shown in subsequent publications.
Statistical analyses
Comparisons in accident involvement are analysed by calculating two risk indexes,
firstly the number of accidents per student (health risk) and secondly the number of
accidents per hour behind the wheel (accident risk). The first is calculated with the help of the number of students who have taken advantage of the new age limit (see section 3.2.3) and the second with the help of the exposure data from the questionnaire (see
section 3.2.1).
The comparisons are analysed with the t-test and by calculating the quotient of the 95% confidence interval for the risks in each respective group.
3.3 Methods of the effect evaluation
Several of the studies in the effect evaluation follow the general design. This applies for example to the surveys and parts of the accident analysis. Here too certain sub studies have not yet been carried out or concluded.
3.3.1 Questionnaire to drivers 1 and 2 years after licensing Design and sample
The design entirely follows the general principle and the samples were drawn from the driving licence register according to the same principles as for the surveys directly after
the driving licence (see section 3.2.1). Here too the samples consist of 1,000 plus 2,000 persons, but here they have held their driving licences for 1 and 2 years respectively. For the old 171/2-year old group, here too the survey was sent to them one year before the other groups. Subdivision of the later group into 16-year olds and new 171/2-year olds is also made later with the help of the responses in the surveys.
This report shows the result from the l-year-survey. Certain data from the survey directly after taking the driving licence is also used in the effect analysis (see section 3.2.1).
The same method as for the survey directly after the driving licence was used (see section 3.2.1). Group sizes and response percentages are shown in Table 4.
Table 4 Group sizes and response percentages for survey 1 year after licensing
Group Sample Number of Response
size responses percentage
16-years 2,000 846 77%
New 171/2 years 690
Old 171/2 years 1,000 892 89%
Contents of the questionnaire
The two surveys 1 and 2 years after the driving licence are identical. In addition to background questions about housing, education etc., they contain questions about exposure, driving habits, driving behaviour, motivation for car driving, self-assessment of driving ability, mistakes and errors in traffic, attitudes and self-reported accidents.
Results detailing errors and mistakes in traffic will be presented in a separate report. Statistical analyses
Comparative test were made using the chi2-analysis or the t test, where the significance
level is set at 5%.
3.3.2 Analysis of accidents after licensing Design and sample
The effects of the lowered age limit are evaluated also with regard to accident involvement. For this purpose statistics relating to accidents reported by the police are used, both from Statistics Sweden as regards accidents involving personal injury and from Swedish National Road Administration, as regards accidents involving personal injury or damage to property. This latter analysis has not been implemented.
The design is based on the general design principle, that is to say with comparisons of three groups. A database covering all accidents reported by the police which were reported to the Statistics Sweden involving young drivers, age 18-21 from August 1993 to August 1996, was used as the starting point. From this, those accidents are selected which can be related to any of the three groups. In order for this to be possible, a comparison with the driving licence register has been made.
For the 16 year group this has not involved any problems since all can be identified in the driving licence register, from which it is also possible to identify the date of the driving permit and the driving licence.
For the 171/2 year olds however, there are certain problems, here as in several other sub studies, because the date of the driving permit is not available for students who get
all their training in a driving school. In the direct link-up it is therefore only possible to identify 171/2 year olds who also act as private students. For the group of old 171/2-year olds this can be handled since they previously could not begin driver training earlier than at the age of 171/2. All those who had taken the driving licences before the end of December 1993 belong per definition to this group. For the new 171/2-year old group the problem is difficult to solve. It has not been possible to calculate exactly what proportion received its driving permit and how many have only have only driven in a driving school. For the new 171/2-year old group the accident risks are therefore based only on those students who received a driving permit, that is to say, those who had either a mixture of driving school and private training or only drove privately.
Those who re- Those who
cieved a driving have had a
permit after 1/9 9999999 driving licence = 16-year group
1993 younger for 1 year
7| than 171/2
Those who
took their Those who Those who
driving licence took a driving ) have had a = Old 171/2-year
< 6 months licence before driving licence group
after turning 18 7| 1/1 1994 for1 year
N Those who do not have a driving permit or who have received their permit when aged 171/2-18
N Those who Those who
took a driving -> have had a = New 171/2-year licence after driving licence group
31/8 1994 for 1 year
Figure 5 Criteria for de ning the groups in the licence register and accident databasefor comparison ofaccident involvement and accident risk In total these criteria limit the size of the groups. The final group sizes were as follows: 33,618 in the 16 year old group, 39,676 in the old 171/2 year group and 8,243 in the new 171/2 year group.
Contents of the report form
Every accident report contains a number of details about the accident. In addition to personal data about the driver and injured passengers it also includes information about the seriousness of the injury, the date and time, place and conditions at the time of the accident, among them road conditions, parties involved and whether there is any reason to suspect the presence of alcohol.
Statistical analyses
The comparisons relating to accident involvement are analysed by calculating two risk
indexes. First the number of accidents per driver (healthrisk) and secondly the number of accidents per driven distance (accident risk). The first is calculated with the help of
the number of licence holders who are included in each group (according to information about licence holders obtained from the driving licence register, see Figure 5 above), and the second with the help of exposure data from the survey (see section 3.3.1).
This account is based on accidents occurring in the first year in strictly defined groups of new drivers. The relatively small number of persons and accidents which these strict criteria involve mean that it is seldom possible to prove any significant differences when one categorises the accidents, for example as regards type of injuries, road conditions or speed. However, the possibility of defining any differences between the groups will increase significantly in later presentations since a broader-based accident data bank will be analysed. The accident follow-up of the evaluation will be concluded at the start of 1999.
The comparisons are analysed with the t-test and by calculating the quotient of the 95-percentage confidence interval for the risks in each respective group.
4 Results
The presentation of the results will not follow the structure of the sub studies presented during the sections dealing with the purpose and method. Instead, this chapter is divided according to the various statistics and information collected. In several sub studies the
structure of driver training, for instance, has been taken up. All such results are shown
here in one and the same section. The same principle applies, 6.g. for accident involvement in which accidents registered with the police and accidents reported by the drivers are covered under the same heading.
This presentation is divided into two main sections, one for process analysis and one
for effect evaluation.
4.1 Results of the process analysis
4.1.1 Participation
Information about participation has been obtained from the driving licence register. For those who utilise the 16-year age limit this permit is obligatory and information about this is found in the register. Apart from the student himself the person or personas acting as supervisors for the student are also registered. During the first 21/2 years with the new regulations just over 172,000 permits were authorised for younger drivers, which roughly corresponds to about half the population. These students were assisted by just over 320,000 supervisors which means that every student has an average of 1.9 supervisors. As regards the number of students who began after they had turned 171/2 there is no reliable information. The total population in the age interval 171/2-18 can be estimated at about 120,000 during this same 21/2 year period.
Table 6 Learner drivers who began driver trainingat the age of]6-] 71/2
Age group
16-17 /:: 17 /z-<18
Number of students 172,108 <120,000
Proportion of population 45 - 50% Unknown
Number of supervisors 319,831 Unknown
With the help of the questions put forward in the survey immediately after taking the driving licence, participation has been analysed with regard to certain background factors. Since the survey's selection is random, this allocation per background factor should also show the spread throughout the population which has taken advantage of the opportunity for an earlier start.
Table 7 Gender distribution among learner drivers in the 3 comparison groups (p<0.05)
Gender 16-years Old 171/2-years New 171/2-years Total
Women 44.8% 40.4% 50.1% 44.7%
Men 55.2% 59.6% 49.9% 55.3%
Total 100.0% 100.0% 100.0% 100.0%
As regards the proportion between the sexes, the differences are small compared with the old system, but compared with those who wait, that is to say, the new 171/2-year group, there are fewer women who begin early. Taken together, the results indicate that interest in taking advantage of the new regulations is greatest among young men (Table 7).
One can also discern a certain degree of difference as regards social background. This has been analysed with the help of questions regarding living accommodation, education etc. Among those who have utilised the 16-year age limit there is a greater proportion of students living in villas than among those who wait (Table 8). It is also somewhat more common that they live at home with their parents (Table 9). As a consequence of this the l6-year age group can also be seen to have parents with higher educational levels. Table 10 shows the distribution of highest level education in the family and it shows, among other things, that parents of the 16 year olds have university education to a slightly higher extent.
Table 8 Allocation per type ofhousing (1K0. 05)
House, family 16-year Old 171/2-years New 171/2-years Total Detached or 79.6% 74.4% 70.3% 75.4% semi-detached villa Terraced house 11.9% 15.0% 15.5% 13.9% Apartment 8.5% 10.5% 14.2% 10.7% Total 100.0% 100.0% 100.0% 100.0%
Table 9 Proportion ofstudents who live at home with their parents (p<0. 05)
Living at home 16-years Old 171/2-years New 171/2-years Total
No 5.1% 8.3% 9.8% 7.5%
Yes 94.9% 91.7% 90.2% 92.5% Total 100.0% 100.0% 100.0% 100.0%
Table 10 Distribution ofhighest education in the family (p<0. 05)
Education, 16-years Old 171/2-years New 171/2-years Total
family Primary school 10.1% 12.4% 13.7% 11.9% High school 30.4% 31.7% 31.9% 31.3% Adult School. 1.1% 1.7% 2.1% 1.6% primary school Adult School. 5.7% 5.2% 6.0% 5.6% other University or 46.8% 43.4% 38.4% 43.4% college Other 5.8% 5.5% 8.1% 6.3% Total 100.0% 100.0% 100.0% 100.0%