Västerås, Sweden
DVA502
Thesis for the Degree of Master of Science in Engineering - Robotics
30.0 credits
Body Area Network with
Gait Symmetry Analyses
Lennie Carlén Eriksson
lcn10001@student.mdh.se
Jonatan Scharff Willners
jsf10002@student.mdh.se
Examiner: Mikael Ekström
Mälardalen University, Västerås, Sweden
Supervisors: Martin Ekström
Acronyms
BAN - Body Area Network WSN - Wireless Sensor Network
GSA - Gait Symmetry Analyses GUI - Graphical User Interface
DOF - Degrees Of Freedom IMU - Inertial Measurement Unit MEMS - Micro-electro-mechanical Systems
BSN - Body Sensor Network MCU - Microcontroller unit
RF - Radio frequency
RBS - Reference Broadcast Synchronization TPSN - Timing-Sync Protocol for Sensor Network DMTS - Delay Measurement Time Synchronization
FTSP - Flooding Time Synchronization Protocol TDP - Time Diffusion Synchronization Protocol
MAC - Media Access Control ECG - Electrocardiography
SotA - State of the Art BLE - Bluetooth Low Energy
USB - Universal Serial Bus CID - Channel Identifiers HCI - Human Command Interface ADC - Analog to Digital Converter
Abstract
Smart portable devices is increasing in popularity in many fields. In motion tracking many devices have been created in the last years as a help in motivation and observation for training. Most of them is for tracking distance moved, heart-rate and some more basic functions. For deeper analyses in motion tracking a more advanced system is needed. The system needs to be small and light to not influence the movement of the subject in a negative way. It should preferably be cheap. Two other factors is that the system needs to be easy to use, both in the interface and deployment.
Symmetry in motion is an key-element to effective use of energy. Measuring the symmetry in gait should then help to improve motion. This could be used as a tool for more efficient training or to faster recover from an injury. For a stroke-patient this could perhaps decrease the time of rehabilitation and remind the patient to move one leg. To create this, a reliable communication between a data sink and sensor nodes has been developed. The sensor nodes is gathering nine dimensions IMU data, accelerometer, gyroscopes and magnetometer, each in three dimensions. The data is saved to a database where it can be extracted for further analyses.
Testing of the script language for Bluetooth devices, BGScript for time synchronisation has been done to see if it is able to use for frequencies high enough for a system to measure movement.
Table of Contents
1 Hypothesis 5
2 Problem formulation 6
3 Introduction 7
3.1 Wireless Sensor Network . . . 7
3.1.1 Body Area Networks . . . 7
3.1.2 Bluetooth . . . 7
3.1.3 Sensor node . . . 8
3.1.4 Data sink . . . 8
3.2 Gait symmetry . . . 8
3.3 Gait symmetry Analyses . . . 8
3.4 Graphical User Interface . . . 8
4 Background 9 4.1 Synchronization in wireless networks . . . 9
4.2 Robotic hinge joint vs. human body . . . 11
4.3 Filtration for orientation estimation . . . 12
4.4 Gait symmetry analyses . . . 12
4.5 Hardware for body sensor networks . . . 12
5 Method 13 5.1 State of process and time plan . . . 13
5.1.1 Important dates . . . 13
5.1.2 Weekly initial plans . . . 14
5.1.3 Weekly achievements . . . 15
5.2 Hardware . . . 16
5.2.1 Computational unit and communication . . . 16
5.2.2 Embedded sensors . . . 17
5.2.3 Power . . . 17
5.2.4 External sensor interface . . . 17
5.2.5 Wired communication . . . 17
5.3 Middleware . . . 18
5.3.1 BGScript . . . 18
5.3.2 C-SDK with IAR workbench . . . 18
5.3.3 Bluegiga API . . . 18
5.3.4 Bluegiga Library . . . 18
5.3.5 Generic Attribute Profile . . . 19
5.3.6 Preparation for time synchronization . . . 20
5.4 Bluetooth low energy layers . . . 22
5.5 L2CAP - Logical Link Control And Adaption Protocol . . . 23
5.6 Graphical user interface . . . 24
5.6.1 Data sink . . . 24
5.6.2 Start up and initialisation . . . 24
5.6.3 Main control . . . 25
5.6.4 Receiving message event . . . 26
5.6.5 Time synchronisation . . . 28
5.6.6 Database . . . 28
5.7 Graph plotting and analyses . . . 29
5.9.1 Command package . . . 32 5.9.2 Event . . . 32 6 Implementation 33 6.1 Hardware . . . 33 6.2 middleware . . . 33 6.3 Software . . . 34 7 Results 35 7.1 Hardware . . . 35 7.2 Middleware . . . 37 7.2.1 Execution speed . . . 37 7.2.2 Time synchronisation . . . 37 7.3 Software . . . 38 7.3.1 Communication . . . 38
7.3.2 Graphical user interface . . . 39
8 Discussion 40 8.1 Hardware . . . 40
8.2 Program languages . . . 40
8.3 HCI commands . . . 40
8.4 Time synchronisation . . . 40
8.5 Robotics program influence . . . 40
9 Conclusion 42 9.1 Future work . . . 42 9.1.1 Hardware . . . 42 9.1.2 Middleware . . . 43 9.1.3 Software . . . 43 References 45
1
Hypothesis
The hypothesis for this master thesis is the following:
"By collecting data from a time synchronized BAN with multiple IMUs, it should help in performing gait symmetry analyses. The analysed data could help in training or rehabilitating of a subject in observation."
With this in mind the objectives that needs to be completed has been derived, these can be found in the problem formulation found at chapter 2.
The focus of this thesis is to create an pre-study in the field, with reliable data gathering from a fully working sensor node.
2
Problem formulation
By successfully measuring motion symmetry in multiple points on the body without restricting the movement of the subject of observation in an reliable and robust manner the data gathered could be used for rehabilitation and prevention of injuries.
A state of the art study will be made to determine a good way of developing a body area network for gait symmetry analyses. First the hardware for the communication and data gathering will be researched so that the project will have a good base for doing testing. Research will be done about how to set up a well synchronized Bluetooth network of multiple micro-controllers. These will then be gathering force, speed data and doing time measurements. The study will also consist of research about which method or methodologies is best used to handle the data gathered and how to present the results to the user. Calibration, comparison and analysis of the data will be researched and shown how it can improve training and or rehab for the user, and what could be possible in the future.
Q1. Hardware
A small and light chip should be developed that can control a accelerometer, gyroscope and can communicate with other chips using Bluetooth.
Q2. Firmware/Middleware
Middleware and firmware for the Bluetooth network should be developed that offers reliable and predictable communication.
Q3. Software
• Graphical user interface to reduce the complexity for the user to analyze data. • Filtering of data to reduce noise etc.
• Calibration between the different units to achieve a more correct system. • Comparison and analysis of the data for the different units.
Q4. Testing
The above described systems should be combined into a single working system. This system should then undergo serious testing to decipher the functionality and determine the quality of the results.
3
Introduction
This project offers a way to help patients recover and athletes to improve their way of moving. The project focuses on developing a tool to measure and see a persons movement pattern in real time, by researching a multi-sensor system where a sensor will be placed on each joint of a person. The sensors will then have a Body area network(BAN) connecting them and a master processing unit to conduct sensor fusion and signal analyses algorithms on the provided data. From this data a movement pattern can be interpreted and provided for analyses through a easy to understand user interface.
3.1
Wireless Sensor Network
Sensors providing data is used in a lot of different environments. These sensors can sometimes be placed in harsh environments, which also means that it might be hard to have a wired communication between the sensor node and the data sink. As an example, If a sensor is placed inside a rotating shaft it might be hard to find a trustworthy and long lasting technology to be able to send information. If a wireless communication were to be implemented this would not be a problem.
Wireless sensor networks(WSN) is also better in regards to modularity, a sensor node can easily be moved and cables does not have to be rerouted.
3.1.1 Body Area Networks
BAN is a network of nodes that can be located inside the body as a implant, on the body or in proximity to the body. A BAN is usually a wireless network but it can also be wired. A wireless network in the area of the body can have a lot of benefits. It does not need to transmit information long distances, this means that the power requirements are lower and that a small and low powered device can be implemented to transmit or/and receive signals. Since a device can be low powered the device can be used for longer periods of time before being forced to change batteries or to charge the device.
3.1.2 Bluetooth
There several communication standards in wireless networks. These standards describe how a signal is to be produced and handled. This thesis work will be investigating the possibilitys of using Bluetooth for the proposed application.
Bluetooth was initially created by Ericsson [9] in 1994, but are now managed by Bluetooth special interest group [3]. The standard was initially created to to replace cables with wireless technology. Bluetooths network topology is a piconet. It means that each net can contain up to 7 different slaves and one master. Each slave can in turn be a master and have 7 slaves of its own. Thereby creating a scatternet formation network. Bluetooth sends information using a GFSK modulated signal as well as a FHSS scheme. This means that Bluetooth transmits over 79 channels divided into 625 ms time slots in the 2.4 to 2.485 GHz Industrial, Scientific and Medical(ISM) band.
Bluetooth have three different classes of output power. They are the following. • Class 1
This class has the highest output power of 100 mW and can send information up to around 100m. This class is mostly used with systems that does not run on batteries.
• Class 2
The second class of Bluetooth prducts has an power output of 2.5 mW. This means that the signal can reach up to around 10m. This class of Bluetooth products is commonly used in mobile devices such as cell phones.
• Class 3
This is the lowest power class of Bluetooth. Its power output is 1 mW and has a reach up to 1m. The Bluetooth 4.0 core specification have included a Low Energy feature creating Bluetooth Low Energy(BLE) technology. This means it will be more power efficient when used with a small battery powered system. This is the version of Bluetooth that will be focused upon in this thesis.
3.1.3 Sensor node
The sensor node [26] in a WSN is the part where the sensor is fitted together with a transmitter/re-ceiver. A processing unit will collect sensor data and then transmit the data over a network. A sensor node can as an example be fitted with a temperature sensor together with a Bluetooth transmitter to send the information wireless to a data sink. A sensor node can come in different sizes and processing power. The ones focused in this thesis will be small and battery powered sensor nodes.
3.1.4 Data sink
A data sink is a device that collects all the data the sensor nodes provides it with. This mean energy consumption on the sensor nodes will decrease when demanding calculations can be done on the data sink [34]. In this thesis the data sink will be a goal for the data to reach in a wireless and mobile system. It also does some computing of collected data.
3.2
Gait symmetry
Gait symmetry is said to be defined, by Heydar Sadeghi et al [50], as a perfect correlation between the observed limbs. By checking for asymmetry in the gait, analysis can be done to enhance the performance and training or rehab of the subject observed. This can in cases such as stroke patients rehabilitation training reduce the time needed to regain its mobility. For professional athletes this could be used to optimise training. As in a study made on North Queensland Toyota Cowboys [20], gait symmetry analysis shows when an injured player is ready to play again or to see if the rehabilitation is progressing in the right direction.
3.3
Gait symmetry Analyses
Useful data can be obtained by comparing the gait from two corresponding limbs. Data such as period time for the same motion on the different limbs, also if they move equal distance and with equal forces. The difference in these measurements will vary a lot between a professional athlete and for example a stroke patient. How to train and exercise to get better movement for athletes can be acquired by analysing this data. For stroke patients this could reduce the time supervised rehabilitation is needed [55].
3.4
Graphical User Interface
A graphical user interface allows the user to interact with the program by icons and menues etc. to simplify the use and not having to know how to execute commands by calling them with text. A GUI will show tracking of the limbs orientation in real-time to verify that the calibrations of sensors has been done correct. As well to display real-time gait symmetry analysis with different settings and options. The possibility to save test runs and to be able to load them for training the system and to verify it offline.
4
Background
In work done by Kashif Kifayat et al. [38] a system was built that could record a subjects movement with the help of a WSN equipped with accelerometers. The goal of this project was to create a way to have physiotherapy exercises at patients homes so patients did not have to visit a doctor every time a examination was needed. The collected data could then be analysed by a doctor. Adam T. Barth et al. [28] also created a body sensor network(BSN) to measure the motion of a subject. The collected data was translated into a visual 3D model and the results was confirmed using a optical motion analyses system. A commercially available BSN exists named Shimmer [22]. Some research have been done with this system as a base. Djamel Benferhat et al. [29] developed a Electrocardiography (ECG) system using the Shimmer system. It observed the ECG values on marathon runners. It was was meant to be used in an marathon instead of inside laboratory environments as a many other similar systems is located. The Shimmer equipment has also been used to measure joint angles [44]. A 2D joint angle assessment could be archived but it could be further developed into 3D.
4.1
Synchronization in wireless networks
Some work has been done with synchronisation between units in an wireless network. In work pre-sented by Marcus Bergblomma et al. [30] a wireless ECG network using Bluetooth devices was built. The conclusion from this project was that itťs possible to build a reliable time synchronised network of Bluetooth devices.
A comparison between different time synchronization protocols for WSN have been done by Ill-Keun Rhee et al. [48]. Where some characteristics in synchronization protocols is brought up:
Master-slave or peer-to-peer: • Master-slave
The use of one master node and the other nodes set as slaves. The slaves will try to synchronize towards the masters local clock. Examples can be found in [43] [47].
• Peer-to-peer
Without a master node, the risk of failure in communication due to master node crashing is eliminated. With these protocols, flexibility comes with the price of being more uncontrollable. Internal or external synchronization:
• Internal synchronization
Applies local time to the nodes, focusing on minimizing the the maximum difference between the different nodes clocks.
• External synchronization
The nodes try to synchronize to a standard time, as Universal Time Controller, and use this as reference time. Network Time Protocol applies this method [42].
Probabilistic or deterministic synchronization: • Probabilistic synchronization
Giving a probabilistic guarantee on the maximum clock offset. The probability of failure can be bounded or determined. If energy is limited this could be expensive.
• Deterministic synchronization
Deterministic synchronization is defined by K. Arvind [27] as to guarantee an upper bound of the offset of the clock. This approach in protocols is generally more used than Probabilistic synchronization.
Sender-to-receiver, receiver-to-receiver or receiver-only synchronization: • Sender-to-receiver
Periodically the sender sends its local time stamp, which the receiver will synchronizes towards. • Receiver-to-receiver
Based on the assumption that, if two nodes receives the same message in a single-hop transmis-sion, they will receive it at approximately the same time, then the two nodes exchange the time they received the message and compute their offset.
• Receiver-only
A group of nodes synchronizes simultaneously by only listening to the exchange of messages between a pair of nodes.
Clock correction or untethered clocks • Clock correction
Local clocks are corrected instantaneously or continually to keep the entire network synchronized. • Untethered clocks
By using a time-translation table related to the own nodes clock the node can compare local time stamps to its own unchanged clock. A global timescale is maintained this way.
Pairwise versus network-wide synchronization • Pairwise synchronization
Focused on synchronizing pair of nodes, but can usually be extended to a group of nodes. • Network-wide synchronization
Protocols using this is mainly designed to synchronize networks with a large number of nodes. Single-hop or multi-hop networks
• Single-hop networks
The node can directly communicate with any other node in the network. • Multi-hop networks
Nodes in different networks communicate with each other by an intermediate node in both networks. Can also be pair-wise communication in a chain of adjacent nodes.
Stationary or mobile networks • Stationary networks
When the nodes do not change networks it simplifies the overall implementation at the cost of flexibility.
• Mobile networks
If a node can move, it will need the possibility to connect to other nodes when entering their area. Re-syncing a re-computing of the node-cluster is often a problem if this is used.
Following is some time synchronizing protocols using parts of above mentioned characteristics. • Reference Broadcast Synchronization
Reference Broadcast Synchronization(RBS) [32] [48] is based on receiver-receiver synchronization. The fundamental part of RBS is that a broadcast message is sent only to synchronize a set of
advantage in LAN where these are most often the largest contributors to non-determinism in latency. The broadcast always uses relative time frame reference, never absolute time values. This eliminates error caused by transmission time and access time since each receiver synchronizes to a reference package which was put into the physical channel at the same instant.
• Timing-Sync Protocol for Sensor Networks
Timing-Sync Protocol for Sensor Networks (TPSN) [33] [48] relies on two way message exchange in an sender-receiver synchronization. By time-stamping packages the time they are sent at the MAC layer Ganeriwal et al. argues that this approach is better suited for synchronizing sensor networks than a set of receivers [54]. TPSN builds on a hierarchical topology where each node is assigned a level in this structure. Each node can communicate with at least one node on a higher level, the highest level is called root node and can only have one node. When the network is started a level discovery phase is initiated, where the hierarchy is set up. After that a synchronization phase start where a handshake between two nodes along the hierarchical edges. This type of network is scalable indefinitely but is not good for mobile nodes due the the hierarchical structure.
• Delay Measurement Time Synchronization for Wireless Sensor Networks
Delay Measurement Time Synchronization for Wireless Sensor Networks (DMTS) [47] is based on master-slave, sender-receiver synchronization and clock-correction. This protocol synchronizes the sender with multiple receivers at the same time which saves the amount of messages needed. DMTS is built for scalability and flexibility, and is adaptive and insensitive to changes in the network. It uses an leader as time master whom broadcasts its time. Precision in time is sacrificed for low computational cost and good energy efficiency.
• Flooding Time Synchronization Protocol
Flooding Time Synchronization Protocol (FTPS) [41] [48] aims to synchronize the local clocks of the nodes in the network by multi-hop synchronization. With a single time-stamped message at both sender and receiver FTPS synchronizes the time of the sender to possible multiple receivers. A single root node is used to keep track of the global time which all other nodes synchronizes against. This is done with an ad hoc structure, where the root sends the time to all other nodes, therefore saving the initial time of structure tree or other hierarchical structures.
• Probabilistic clock synchronization service in sensor networks
Probabilistic clock synchronization service in sensor networks [45] [48] is an extension of RBS that will provide a probabilistic clock synchronization instead. Probabilistic protocols can provide a decent clock synchronization with lower computational complexity and power and smaller overhead than deterministic protocols.
• Time Diffusion Synchronization Protocol
Time Diffusion Synchronization Protocol (TDP) [53] [48] enables all nodes in the network to have a local time that is within a small bounded time deviation from the equilibrium time of the network. It uses a lot of algorithms and procedures to autonomously synchronize nodes and remove clocks deviating from the neighbours.
4.2
Robotic hinge joint vs. human body
From recent work [51] on motion and gait analysis on the human body, a big challenge have been that the mechanical characteristics of a robotic arm is more static and related to a local coordinate system. Humans limbs differs meaning, it is not easy to mount the sensors so that the local coordinate axis of the sensors align with the physiologically meaningful axis [51]. Therefore a main challenges for the system is to be able to calibrate its axis in relation to the limbs automatically.
When it comes to ambulatory measurement and analysis of lower limb 3D gait, it was shown in [30] that the use of virtual sensors for knee and hip joints is simpler, more practical and effective than fixing physical sensors at these joints.
4.3
Filtration for orientation estimation
Kalman filter is computational demanding due to its complexity, which may not be suitable for all systems. This filter however is, as written by Lefferts et al. [39], easy to use when it comes to combining and fusing different sensor data compared to other filters.
Fuzzy logic for attitude estimation is an alternative to computational heavy filters used by Sung Kyung Hong [36], which gives good damp error in drifting and with well tuned rules can give a high accuracy attitude estimation on low-cost and low-performance systems.
Complementary filters such as explicit complementary filter, by Mahony et al. [39] and gradient descent based orientation filter, by Madgwick et al. [40] is compared in the paper, A Comparative Analysis of Orientation Estimation Filters using MEMS based IMU [39]. Both simple algorithms, with small computationally cost, but giving equally or close to equally as good results as the more demanding algorithms.
4.4
Gait symmetry analyses
Kara K. Patterson et al. [46] made a study that compared different methods made to determine stroke patients gait symmetry . This is done to try and determine a method that can be proposed for standardization. The conclusion was that a method for standardization could not be found that was better than then the others, but it was determined that the ratio method was the easiest in regards for interpretation. The study also determined that the most important parameters when calculating gait symmetry is step length, swing time and stance time.
Symmetry in gait can be measured with the ratio method 1, as used in [49], [31], [50], [52] by SI = 2.0∗ (Xright− Xlef t)
Xright+ Xlef t
∗ 100.0 (1)
where SI is the symmetry index in percentage of the two arbitrary limbs Xright and Xleft measured
for same movement. Most work using this formula is done by checking pressure towards the ground from the feet.
4.5
Hardware for body sensor networks
A BSN made for gait analyses can be built as Yundong Xuan et al. [56] did, by putting wireless sensor nodes in a subjects shoes. An IMU [16] was used to collect data which was connected to a MCU with a RF function. The components was powered by a battery. A board was also designed for these components. The master unit is also built by a MCU with a RF function. This is then powered by a USB cable connected to a computer. The master unit also transfers the data from the wireless network into the computer through the USB cable. Another example of BSN design is by Shimmer [22] which is named Shimmer3 [23]. The system is equipped with a MSP430 MCU that communicates with other units with the help of Bluetooth 2.0 wireless network. Each MCU has the possibility to measure low noise and wide range acceleration, angle velocity, pressure and magnetic fields. These values are measured by a LSM303DLHC and KXRB5-2042 accelerometer, MPU9150 gyroscope, BMP180 pressure sensor and an LSM303DLHC magnet sensor. Each node in the system has a dimension of 51x34x14mm. It has the possibility to save gathered data on a microSD card.
5
Method
The following sections describe what the outcome is and what is needed to archive it. It also describes the important parts of the system and their functionality.
5.1
State of process and time plan
One can not fully test middleware without hardware etc. Therefore quite a strict priority of what parts of the project needs to be done has to be followed. Some later parts, as parts of the GUI, can be done with simulated values to prepare for when real values are available.
• Hardware To even begin gathering data, working hardware is needed.
There is a current prototype that still needs testing, this will be used if it works.
• middleware middleware to gather the sensor data and to be able to send and receive packages over Bluetooth.
• Clock synchronization When data gathering and communication is running, there is need for a time synchronized network. In the background section, different approaches is mentioned, more deep comparison and tests of these and possibly new protocols will be performed to find the most suitable protocol.
• Filtration Filtration could either be done in the nodes or when the data is to be used, to save time or energy efficiency.
The plan is to evaluate different filters such as those mentioned in the background section. • Database Save test data to a database to be able to perform analyses and training offline.
If this will be a real database or saving to a local file is yet to be decided, depending on time and size of tests etc.
• Graphical user interface An GUI to easily observe and change how and what the user wants to observe. This will be ongoing through the whole project and new implementations will be done when new functions is available.
• 3D representation/simulation Showing visual representation of the motions in real-time to verify correctness.
Show graphs of the different sensor data, to manually be able to analyse it.
• Gait symmetry analysis Analyses of the data to show interesting and or helpful information. Match the different graphs periods for two corresponding sensors.
Perform different digital signal analyses on the values such as frequency domain, period times, force in different directions etc. All to prepare for a easier decision on how to inform the user. • Improved hardware for cloud preparation If the main part is finished and time is left then
implement a connection to a online server. This can be done by using a 3G or 4G connection or any other similar technology.
• Port to cloud If time, port the system to the cloud to prepare for future development.
5.1.1 Important dates
Table 1 shows the predetermined dates the different parts of the thesis should be done, submitted and finished.
Table1: Important dates
Date objective
2015-01-19 Course start
2015-02-08 Status and planning report submitted 2015-02-11 Status and planning seminar done 2015-02-12 Start implementation work 2015-05-20 Final report submitted 2015-06-03 Seminar finished
5.1.2 Weekly initial plans
To prepare for the work required a schedule was planned in the beginning of the thesis. The schedule is presented in table 2.
Table2: Weekly initial plan
week objective
4 Robotics project override
5 SotA and report
6 SotA and report
7 Seminar and preparation of implementation 8 Developing hardware, middleware and GUI 9 Developing hardware, middleware and GUI 10 Developing hardware, middleware and GUI
11 Developing hardware, middleware and Clock synchronisation 12 Clock synchronisation and data filtration
13 data filtration and GUI 14 Gait symmetry analyses and GUI 15 Gait symmetry analyses and GUI 16 Gait symmetry analyses and GUI 17 Gait symmetry analyses and GUI 18 Gait symmetry analyses and GUI 19 Report and finishing leftovers 20 Report and finishing leftovers
21 Presentation
22 Presentation
5.1.3 Weekly achievements
The following table3 describes the achievement of the project on a weekly basis. Table3: Weekly achievements
week summary
4 Robotics project override
5 SotA and report
6 SotA and report
7 Developing version 1 hardware and researching/installing software 8 Started developing Middleware in BGScript and visual representation in Matlab 9 Redesigned hardware and built version 2. GUI in Matlab
10 Developing BGScript middleware and visual representation in python 11 Redesigned and built version 3 of hardware, Developed BGScript and C# GUI 12 Version 3.1 working and version 4 designed. Testing IMU / C# GUI
13 Data sent from IMU to GUI
14 time testing in Middleware / C# GUI
15 Searching for BLE113 csdk and trying to contact Bluegiga / C# offline software for signal analyses 16 Received csdk for IAR workbench. Planning database/ C# offline software for signal analyses 17 Database implemented to C# GUI. Testing signal strength and range of sensor nodes
18 Report
19 Report
20 Report
5.2
Hardware
The hardware is a Printed circuit board(PCB) equipped with a sensor and computational unit. It has the physical measurements of 36mm long and 26mm wide. The PCB together with components has the height of 4mm. A JTAG contact can be included for making debugging and reprogramming of the PCB easier. The JTAG contact comes with a drawback, it makes the PCB 2.5mm higher than without it. The PCB is used together with a power source and inserted into a case. The case can be strapped to one of the subjects limbs for measuring motion. A circuit, power source and case is what build up a sensor node. The general functionality of a sensor nodes circuit is described in figure 1.
Figure1: System description and data flow of a sensor node
5.2.1 Computational unit and communication
The computational unit used is the BLE113 [1] module from Bluegiga. The module has a cc2541 system on chip(SOC) solution for Bluetooth low energy(BLE) integrated and other supporting circuits for operating the cc2541 SOC. The cc2541 SOC is a MCU and 8 KB ram integrated with a RF transceiver. This means that all the necessary parts for BLE communication and computa-tional power is offered in a single module. The module also offers a variety of hardware features. It has SPI, I2C, PWM, UART and GPIO peripheral interfaces needed for communication with
5.2.2 Embedded sensors
Sensors is needed to record the movement of a subjects limb. To record and recognize movement it is possible to use accelerometers combined with a gyroscopes. Since each sensor node requires to record the movement in three dimensions one pair of gyroscope and accelerometer is needed in each dimension. To make calibration of the sensors easier a three axis magnetometer is preferred. The sensor used is a 9 axis IMU named MPU9150 [17]. This sensor fulfills all the requirements and is small and low powered. It communicates with the BLE113 module with the help of a I2C-bus.
5.2.3 Power
The power system used offers various ways of powering a sensor node. the main power source is a single cell 50mAh Lithium Polymer battery [21]. It is also possible to connect the sensor node to an usb interface and power it. When the sensor node is powered through an usb interface it will also recharge the battery with the help of a USB-Powered LI+ charger [14]. This power system then delivers the power to an LDO Voltage regulator [24] that in turn offers a stable 3.3V supply of power to components requiring it.
5.2.4 External sensor interface
Each sensor node offers the possibility of connecting five external sensors and can provide a 3.3V supply to them. The input to the sensor node is connected to 12 bit ADCs. The hardware interface to the external sensors is described in figure 2. The sensor interface is primarily designed to work together with force sensing resistors as proposed in [35].
Figure2: Pin layout of a external sensor interface when looking at a sensor node.
5.2.5 Wired communication
For debugging purposes a wired communication between a computer and the BLE113 module was implemented. By connecting a usb cable to the sensor node it is possible to communicate with UART from the BLE113 module to a connected source. The UART to USB bridge [8] translates the messages from the usb bus and the UART interface of the BLE113 module so that they can transfer data between them.
5.3
Middleware
Middleware is the software running on the sensor nodes. Different middleware for the sensor nodes in the system was evaluated to see if they can support what the system demands. Easy to use, execution speed and amount of documentation was some of the parameters that were taken into high regard.
5.3.1 BGScript
An event driven programming language named BGScript was evaluated for use with the BLE113 modules. BGScript is a scripting language created by Bluegiga and offers a easy way of tak-ing control of the reasonably powerful micro controller cc2541 [6] inside the BLE113 modules without having to use custom c programming together with a IAR workbench [10] license. The BGScript language does not expose the internal BLE stack to the user. It only exposes the user to commands and events that is easy to understand and use. BGScript have a limited documen-tation. The language has one major drawback. It has a big overhead, meaning it executes slowly.
5.3.2 C-SDK with IAR workbench
Usually the only option for writing code to the BLE113 module is by writing it it with the help of BGScript. The other option is to mount a MCU and connect it with a UART interface to the BLE113 module. It is then possible to program the MCU with the help of BGLIB which is a ANSI C representation of the BGAPI Protocol. By using a external MCU the overhead disappears but the physical size and power requirements increase. A solution that does not require a external MCU is to program the cc2541 controller with the help of IAR Workbench. When combined with C-SDK for the BLE113 modules this can provide a solution which lowers the overhead and at the same time keeps the small size of the physical board and the low power requirements.
5.3.3 Bluegiga API
Bluegiga API(BGAPI) is a binary protocol used on an external application to control an Bluegiga dongle or module. It is only a protocol specification.
5.3.4 Bluegiga Library
Bluegiga Library(BGLIB) is a reference to implementation for BGAPI’s binary protocol. The suggested implementation is written in ANSI C, but can be converted to any language, in this used with C# and Matlab. The use of this is to control a dongle or module from a computer or and external micro controller over UART. The code for this in Matlab is written created specifically for this project with an restricted amount of functions. The code for C# is based on Jeff Rowbergs library [12], with external additions made for this project with more specific design for this application. The functions in the library will return binary string/byte string customized after the settings passed as parameters.
5.3.5 Generic Attribute Profile
The Bluetooth 4.0 smart connection on the sensor nodes offers a profile with services and char-acteristics when acting as slaves in the connection. The charchar-acteristics offered is described in table 4.
Table4: Generic Attribute Profile(GATT) characteristics
Characteristics UUID Type
Device Name 0x2A00 Read
Manufacturer name 0x2A29 Read
Model number 0x2A24 Read
Device adress 0x2A23 Read
IMU adress dbe02d60-ea76-11e4-8162-0002a5d5c51b Read Magnetometer adress fe5ff6e0-ea76-11e4-87d5-0002a5d5c51b Read IMU input 08ab2840-ea77-11e4-bcb7-0002a5d5c51b Write
IMU output 122e75c0-ea77-11e4-8497-0002a5d5c51b Read & notify LED control 1a0069c0-ea77-11e4-8ffa-0002a5d5c51b Write
ADC data 20bb2160-ea77-11e4-8d7c-0002a5d5c51b Read & notify Activate ADC 27ccd2a0-ea77-11e4-91ba-0002a5d5c51b Write
The 2 byte universally unique identifier(UUID) showed in table 4 is general pre-defined charac-teristics where is is possible to get general information about the system.
The custom made characteristics has a UUID of 128 bytes. From these the master node can read the address of the accelerometer combined with gyroscope or the magnetometer address on the I2C-bus. It is possible for the master node to send messages on a slave node’s I2C-bus
to communicate with the IMU to change configuration and/or settings. The master can send a message to turn on or off the different colors on the Red, Green and Yellow(RGY) Led mounted on each sensor node. The master node can subscribe to the IMU output characteristic. This mean that each time new data is available, a notification message will be sent from the slave to notify the master about it. Since the ADC service is not regularly used it is disabled, but it can be activated through Bluetooth making it possible for the master to subscribe to the ADC-data characteristic.
To activate functions or to get data from the sensor node a master has to send data to the sensor node. It also needs to send data to receive data. What data to send is presented in the following list and refers to table 4.
• IMU input
To send data to the sensors on the I2C-bus through Bluetooth there are certain limitations.
To know which commands to send and to write to the I2C-bus it is best to check the register
map [18] for the MPU9150. The message sent needs to be 4 bytes long. the first 2 bytes will represent the register for which to send information. This needs to be in 7 bit addressing mode. the last 2 bytes represents the settings for that register.
• IMU output
To be able to read data there are two ways of doing it. Either to request data or by asking for notifications. To start getting notifications the master needs to send a 1 in the form of 2 bytes or 0 to stop the notifications. These two bytes is sent to the handle plus one that represents the UUID of the IMU output characteristic. The data packet received from the sensor node is a packet of 18 bytes. what each byte represent is shown in figure 3.
Figure3: visual representation of a 18 bytes IMU data package.
• LED control
To activate or deactivate the different colors of the RGY led on the sensor node the master needs to send a command. This command is sent needs to be a 1, 2 or 3 represented by 2 bytes. This will then toggle the LED on the slave node.
• Activate ADC
Since most sensor nodes will only need to use data provided by the integrated sensors this option is regularly switched off. The ADC only measures the data provided by the external sensors connected to an sensor node. To activate this option the master needs to send a data package of 2 bytes. The option will be activated if a 1 is sent or deactivate if a 0 is sent. The bytes should be sent to the UUID connected to the LED control characteristic. • ADC data
This characteristic is from where the master can choose to request data or start a notification service. If the master wants to start a notification service it has to send a 1 in the form of 2 bytes to the handle plus one represented by the UUID of the ADC data. When the service has started the master will get a notification each time new data is added to the outgoing ADC data buffer. The data package has the size of 12 bytes. What each byte represent is shown in figure 4.
Figure4: visual representation of a 12 bytes ADC data package.
5.3.6 Preparation for time synchronization
Tests to see if it is possible to create a time synchronised system have been done. BGScript by itself does not give any options to read the internal time, so by using interrupt every specified period-time one has to increase an value for keeping track of time. This is done as shown in figure 5. To get a clock on a slave synchronized with the master, the master sends its current time to the slave which in its case assign the time variable to the same as specified in the message from the master.
Figure5: Flowchart for time measurement with BGScript on BLE113, x in this case has been set to either 1/128 or 1/256.
The need for a reliable clock when it comes to measure signals is of most importance. Nyquist theorem tells that the sampling frequency needs to be at least two times greater than the signal being measured frequency. The same principle needs to be applied here, else two measurements can be seen in the same time-frame. The clock in BLE113 has a resolution of max 32768 Hz with BGScript. Some test to see how reliable the clock is was performed on two different resolutions, a clock of 128Hz and 256Hz. The results can be seen in section time synchronisation in results in section 7.2.2 in figures: 22a, 22b, 23a and 23b.
Figure6: Flowchart for reading the sensor values, increase the time and sending the sensor data.
In figure 6 it shows the test for reading the sensors over the I2C-bus and updating the time. When doing this with the same times as in figure 5 a frequency of 20Hz was reached. Showing that it almost takes 50ms to read the sensor data. More detailed explanation of the result can be found in equation 4.
5.4
Bluetooth low energy layers
The Bluetooth low energy version 4.0-4.2 layers seen in 7 is built upon six layers. Bluetooth version 2 and 3 is built upon the layer configuration seen in 8.
Figure7: The layers the Bluetooth low energy v4.0-4.2 is built upon. Application is in this case the GUI 10.
With direct access to the HCI layer in BLE compared to BT version 2 and 3 it is possible to create an application where the host is deciding how to gather the data fromt he GATT.
5.5
L2CAP - Logical Link Control And Adaption Protocol
L2CAP [13] is used to pass packets to either HCI or directly to the Link Manager on a host-less system. The functions in this layer includes multiplexing data between higher layer protocols, segmentation and reassembly of packets, managing one-way packets of multi-cast data to a group of BT devices and quality of service management for higher layers. The functionality is shown in figure 9.
Figure9: How the Channel Identifiers(CID) is used in communication between different devices. The CID is the local name of a logical channel endpoint, Picture from [13].
5.6
Graphical user interface
The graphical user interface(GUI), the layout is shown in figure 10, is used to simplify tests and end use of the system for the user. It is written in C# with consideration for reliability and stability. One aim for the GUI is to be as simple as possible for the end user, to notify if something is done wrong and how to do it in the correct way. All of this due to simulate a real product that could be of use for people not involved in the development of the application.
Figure10: The user interface for communication with nodes and dongle/modules
5.6.1 Data sink
The data sink is the part of the main application that receives all the incoming data. It does the parsing of the messages to the correct form and sends it to the data base and delegates what actions to take depending on the information in the message. It can log all the messages, transmitted and received for observation and debugging purposes. More detailed description will be found in section 5.6.4.
5.6.2 Start up and initialisation
First the program scans the COM-ports for available devices to use, showing these to the user to select which to connect to. Setting up the serial connection with specified settings, the standard settings can be seen in table 5. After the setup is completed, a received data handler event is activated and a interface for controlling what actions to perform is available.
Table5: The standard settings of the serial connection, can be changed if desired. Setting Value
Handshake Request to send Baudrate 115200
Databits 8 Parity None
Figure11: Flowchart for initialisation of COM-port, GUI and event handler.
When connected to the device on a COM-port of the users choice, an event-handler for incoming messages is started. With an active COM-port the user is able to send commands over the serial port to the connected device.
5.6.3 Main control
The main control, design seen in figure 10, of the interface makes it able to control what actions to take. Such as scanning for devices, connect/disconnect to these devices, read from the GATT, subscribe to when the GATT is updated and more. These actions is possible to do after the connection to a COM-port is made, as seen in figure 11. It also contains some graphics to show one simple graph. Flowchart for this is depicted in figure 12.
Figure12: Flowchart for the main user interface after the initialisation and start of the reading thread is done.
5.6.4 Receiving message event
All messages that comes in to the application needs to be parsed in to the correct form, message-types and actions depending on type can be seen in figure 13 and more detailed description in table 6. There is a possibility that that more then one message comes as one packet on the serial communication. These needs to be divided in to the correct messages, a new message will start will the following hexadecimal sequence 0x04FF, and following information about that message data length is used to get the whole message. If there is more bytes remaining in the buffer, then there is most likely another message to parse, so this procedure is repeated until all messages in the buffer is handled in a correct way.
Table6: The most common packages received and the only ones needed to perform the tasks wanted.
event code name action
0x0106 GAP_DiscoveryDone Scan for devices completed, add all found to found devices. 0x0D06 GAP_DeviceInformation Device found, print name of
de-vice and add to found dede-vices. 0x1B05 ATT_HandleValueNotification Received data from streaming
node. Add data to database, data log and show in graph. 0x0506 GATT_LinkEstablished Device is successfully connected,
add to connected devices. 0x0905 ATT_ReadByTypeRsp Response from manually reading
from GATT
0x7F06 GAP_HCI_ExtentionCommandStatus If byte 6 to 8 is 0x11 0x09 0xfe then the Establish connection re-quest is denied due to target de-vice is already performing a task
Figure13: Flowchart for the recived message event for handling a received message and what actions to take depending on message type.
5.6.5 Time synchronisation
With no reliable way to measure time internal on the slave nodes with BGScript, all the time synchronisation has been dedicated to the master, the GUI. By adding the time of the master to each message received and adding it to the database, a non-reliable time for each message is achieved. With the possibility to measure the time over an amount of messages an averaged time between each message can be calculated and used for time stamp instead.
5.6.6 Database
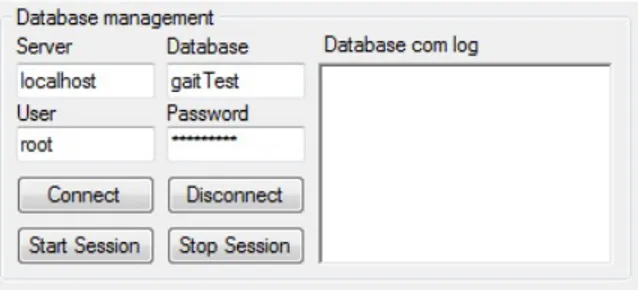
The GUI in figure 10 offers the user the option to save all data gathered to a database. The database management control from the GUI is displayed in figure 12. Through the interface it is possible to connect to a database and save the data gathered by the sensor nodes.
Figure14: Database management control interface.
To connect to the database a MySQL [19] server with an existing database is needed. For each new sessions started a new table will be created, the table will have the name of the time the sessions started in the form of month_day_year_hour_minute_second for easy tracking of a certain session. Each table will in turn have ID of an entry, the data saved from all 9 axis, name of a sensor node and the time when data was gathered. Each new set of data gathered from a sensor node creates a package that is saved into a new column in the table of the database. Figure 13 describes the data types used for the data inserted.
5.7
Graph plotting and analyses
The main program for plotting and execute analyses and filtration is written in C#. It gives the possibility to load data from a database, select what sensor values to show and to perform analyses on the data set.
Figure16: The user interface for loading values from a database and to analyse the data of chosen sensors with selected mode of filtration
– Unfiltered/raw values
Raw values from the sensor when converted to roll pitch and yaw as well as rotation around these axis.
– Complementary Filter
A complementary filter [7] as seen in equation 2 is an easy to implement, noise reducing filter that is good at eliminating external forces. In short term it uses data from the gyroscope and long term from the accelerometer. Complementary filter for is used for roll pitch and yaw.
angle = g∗ (angle ∗ gyroData ∗ deltaT ime) + (1.0 − g) ∗ accelerometerData (2) The constant g in equation 2, can be any value from 0.0 to 1.0 depending on how the internal low-pass filter in the filter should act. The suggested value for g is about 0.98.
– Symmetry analyses
The ratio between the limbs computed with the formula for symmetry ratio seen in equation 3.
SI = 2.0∗ (Xright− Xlef t)
X + X
5.8
Visual representation
The visual representation, as seen in figure 17, is developed to simulate the movement offline or in real-time. Written to be used in either Matlab and Python. It shows the seven limbs, left and right foot, lower leg, upper leg and torso, that will be measured. This could be used to simplify analyses for humans and verify that the values from the sensors is correct.
5.9
Human command interface
To externally control an Texas Instrument Bluetooth low energy unit such as BLE113, an Human Command Interface (HCI) is needed. HCI is a standard interface in BLE for sending commands, receiving events and read/write data. Most common is to use this by sending packages over serial port to an USB device, such as a dongle (this project using the CC2540Dongle), which then converts the message and takes the action required, example, sending data to a device.
Figure18: The HCI is shared between the Host and the controller giving an simple approach to controlling the Bluetooth chip externally.
The HCI layers is shared, as shown in figure 18, between the host and the controller, which makes it possible to create events and actions in a controller from the host.
The HCI contains 4 different types of packages as can be seen in table 7. Table7: The different type of packets in the Bluetooth protocol
Package Type
Command 1
Asynchronous Data 2 Synchronous Data 3
Event 4
5.9.1 Command package
Command packet is as its name implies a package to execute commands, such as write or read from the device. Can also be used to set parameters etc. It is performed on request by the user.
5.9.2 Event
All incoming packages that is not requested is of the event type. It is primarily used when the GATT database is changed on the controller to notify the host with the new values.
Each packet in Bluetooth is built upon an basic standard, this information is hard to get hold of without special access to the HCI datasheet [37]. By the start of this project the information was unavailable, so by sending messages of different types and manually analysing the outgoing and incoming packages in BTool [5] all the useful messages was able to be parsed to correct message types. This is a time demanding work and in the end, if one is able to get hold of the data sheet for the messages, unnecessary. When the project obtained this data all the necessary information from the important messages was already gathered. The typical messages is built with the standard information seen in table 8:
Table8: Order and description of the first bytes in each package. Name Description
Type command, event, asynchronous data or synchronous data EventCode Code for event
Data Length Number of bytes in the message
After this, there can be other settings depending on the following two bytes which describes what type of event the message, the most common used in this project is described in table 9
Table9: Event types needed and used in this application. Event Description
0x0106 GAP Device Discovery 0x1b05 ATT_HandleValueNotication 0x0506 GAP Link Established 0x0905 ATT_ReadByTypeRsp 0x0d06 GAP Device Information 0x7F06 CommandStatus
6
Implementation
The following parts describes the flow in the work and how the work was done. The decisions that were taken that lead to the final form of the project.
6.1
Hardware
The PCB of the sensor nodes has undergone improvements and changes during the work. The different versions and their problems is described in the follwing list.
• Version 1
Version 1 was built and evaluated but it was not possible to get contact between the CC debugger [25] and the BLE113 module. This lead to that no middleware could be tested. After some troubleshooting it was discovered that the JTAG contact was not correctly connected. Since the card were to be redesigned the IMU was also changed because it was determined that a magnetometer could help in calibrating the system. So the MPU6050 [11] was exchanged for a MPU9150 [17]. The battery charging circuit was not working in this version but it was discovered that the battery charging circuit was not correctly connected. This was changed and version 2 was ready to be developed.
• Version 2
Most of the circuit worked on this version. It was possible to charge the battery and also program the BLE113 module. By using this module Bluetooth transmission could be implemented and time synchronization could be tested. But it was not possible to get a connection on the I2C-bus between the BLE113 module and the MPU9150. It was
discovered that some components and circuit lanes was missing for the MPU9150 to work. The circuit was then redesigned becoming a new version of the PCB.
• Version 3
This version was tested to see if it was possible to get contact between the MPU9150 and the BLE113 module with the help of the I2C-bus. It was discovered that this version also had some problems with how the MPU9150 was connected. A mistake was made for the pin layout of the MPU9150. The layout used was the same as for the MPU6000 [15], which was thought to have the same pin layout. But it was discovered that the pin for digital voltage supply was not connected and that meant the I2C-bus could not work. The sensor
node was redesigned and changed based upon this mistake and a new version was created. • Version 3.1
With some patchwork it was possible to use the PCB made for version 3. This version has worked flawless so far but it took a long time to build because of the the difficulties in patching the circuit. All components seems to be working properly and no faults has been discovered. Due to the difficulties building it a new version was designed.
• Version 4
This design is based on version 3.1 which mean all of the circuit works. The difference is that no patchwork is needed and the time and difficulties to build a circuit decreases.
6.2
middleware
Programming languages to use for the sensor nodes was evaluated and tested. Different difficulties became apparent when using them.
to be a good choice to use as a language. All early programs were short and not demanding meaning the issue of the overhead of BGScript did not become obvious until it was possible to communicate with the IMU. When it was realised that BGScript had to much overhead to operate in frequencies above 100Hz when reading data from the I2-bus, a different solution
was researched. • C
It was discovered it was possible to program the BLE113 modules with the help of c-code. Work was started in developing middleware but time was an issue and working middleware using c-code could not be completed.
6.3
Software
The development for the software was all the time adapted after how the project changed its course. From the start focusing mainly on being able to process the data, but when issues with amount of messages per second started to matter it had to be changed to more focus on solving this problem.
• Matlab
The first application was written in Matlab, for the reason to get a program running early and for Matlabs strength in plotting graphs and do calculations easy. Fully functional code for this purpose was done, but with Matlab comes to issue of speed. The frequency the program could send and receive messages was not fast enough. One problem for this could be the iterative structure of Matlab, were threading is not possible. Also the limited possibilities to make a graphical user interface would cause a problem later on. But for the basic purpose, to test that communication was working, Matlab was a fast and easy way. • Python
When it comes to develop applications fast, with good support for graphical implemen-tation and mathematical functionality, Python seemed like a great choice of language to work with. And it almost was, except the lack of experience to work in python for the members of the group. Close to everything was developed that was needed, a functioning user interface, graph-plotting, 3d simulation and some communication was working, but the lack of knowledge in how to work in Python to string together all modules was to great of a challenge for the amount of time available. But it gave knowledge of how the program should be structured and designed to increase efficiency and simplicity. This experience was used for the next generation of the application.
• C#
Third time’s a charm. With the knowledge gathered from the development of the Matlab and Python systems, a detailed understanding on how to reach a working GUI was ob-tained. With experience in non-graphical programming in C,C++ and some in C#, one of these languages seemed like the correct approach. For graphical programming a high level language is to prefer, and since C# is the highest level of the languages mentioned, this is why it was chosen to use for the application. In C# it is easy to create a graphical user interface, to communicate with serial ports, save data to a data base, create threads and much more, so the choice to go with this language was appeared to be a good one.
7
Results
A functioning system was developed during the course of the thesis work. A group of sensor nodes equipped with accelerometer, gyroscopes and magnetometer can be mounted to a subjects limbs to measure the movement of the specified limb. These sensor nodes can communicate with a Master node with the help of a wireless BLE communication. The master node collects all values measured and stores them into a database. The database has the possibility to be run on a web-server. Data analyses program can then be used to make gait analyses on the data gathered.
7.1
Hardware
Working hardware for the Sensor node was developed. The final version had more functions than planned from the start since a 3 axis magnetometer was added as a sensor. This mean that Q1 proved to be possible. The hardware can perform all work required of it. The circuit board together with battery is displayed in figure 19. This is a picture of the final hardware.
Figure19: Final PCB with battery.
The PCB and battery shown in figure 19 can be inserted into a case as seen in in figure20. The case can then be attached to the limb of a subject that needs to be measured.
Figure20: 3D printed case for the PCB with patched on/off button. The battery is mounted under the PCB.
The system displayed in figure 21 shows the suggested, but not necessary, placement of the sensor nodes. The whole communication in the system works and all the parts has been proved to work together. This mean that Q4 in chapter 2 has been answered.
Figure21: Overview of the all planned parts of the system, and suggested placements of the sensor nodes.
7.2
Middleware
Middleware for the sensor nodes was developed. It reads the data from the sensors through the I2C-bus and can then send it the the master node using Bluetooth. It is also possible to read the external sensors attached to the ADC. This data can also be sent to the master node with Bluetooth. The only drawback is the slow update frequency presented when programming the sensor nodes with BGScript.
7.2.1 Execution speed
When performing execution tests on the sensor nodes one could see that reading and writing to the I2C-bus took a long time. A test was performed to see the speed depending on the amount of code in a interrupt driven event. First, simple instructions was used that only wrote a message to UART. The messages could be sent at a frequency of 440Hz. But when reading the sensor data from the I2C-bus and then sending the collected values through UART the frequency of messages could only reach 20Hz. This meant that the update frequency of the sensor values was highly influenced by the amount of code. Since the base code took approximately 1/440 seconds to execute. Two read and two write operations is required to get data from a single axis on the IMU. To read all nine axis this would require 18 read and 18 write operations on the I2C-bus.
With a update speed of 20Hz this would mean that is takes approximately 5.3ms to read the data from one axis of the IMU when using BGScript calculated as in 4 or 2.65ms to read one byte from a register.
1 20− 1 440 9 = 5.3ms (4) 7.2.2 Time synchronisation
The tests for see if using a clock like the one described in figure 5 gave the following results. • 128 Hz clock
An error of approximately 2.45%.
• 256 Hz clock
An error of approximately 4.27%.
(a) Error difference for 256 resolution clock (b) Error in percent for 256 resolution clock
As seen in the figures 22a, 22b, 23a and 23b the difference between the sensor node and the computers time increases continuously over time. This is when using a software implemented clock since there is no access to the internal time och the MCU with BGScript. This shows that it is not possible to build a effective time synchronisation with BGScript, since the time of the software implemented clock can not be seen as reliable. This could be solved by using an external MCU or by perhaps by replacing BGScript with C.
As seen in figure 6 and read in section 5.3.6, while trying to read the sensor and increasing the clock at 128 or 256 Hz, it only does the sending of this data at an average of 20 Hz. This gives the conclusion that the reading I2C-bus with BGScript is a slow procedure, since the I2C-bus on BLE113 has the standard-speed of up to 100kbps and fast-speed of up to 400 kbps [2].
7.3
Software
Software is split in two parts. The first part is the communication which is sharing a the HCI layer with the middleware. The second part is the graphical user interface, with the handling and analyses of data after it has been received from the sensor nodes and saved to the data base.
7.3.1 Communication
Two different languages have been tested for communication, Matlab and C#, where Matlab was to slow to use for handling an incoming stream of packages.
With C#, a working and reliable interface for gathering sensor data and saving it to a data base have been constructed. The most important HCI commands for the applications purpose is included in the interface, for sending and parsing incoming messages.
With the problem for time synchronisation internal, an averaged time between messages is used instead as is described in the time synchronisation section 5.6.5. This completes as good as was able to be done under current circumstances, the reliability part in middleware Q2 in the problem formulation.
7.3.2 Graphical user interface
A functionally GUI, as seen in figure 10, for communicating with Bluetooth devices, saving values to a data base and some basic plotting in real-time is completed. The real-time plotting for the accelerometers x values while walking can be seen in 24. An interface for analysing data from the database is partially ready, but still needs some work. Since this is not completed Q3 in the problem formulation can not be completely fulfilled, but however is well prepared to be. An interface for simulating movements, as seen in figure 17, is almost complete, only needs to be integrated with the data base for offline simulation or with a real-time value stream.
8
Discussion
The following part describes how the work could have been done faster and how the given education from the robotics program have influenced the outcome. Some guidelines for other researchers in the field of Bluetooth body area network with Bluegigas products can also be found. The time spent on the project have been about an average of 40 hours a week. To get the result aimed for a great amount of more time would have been needed.
8.1
Hardware
If the hardware would have worked sooner and if the deliveries of the new PCBs would have gone faster a lot more work would have been archived in this thesis. A lot of the software was created early but there were no way of testing it because no data existed to perform any operations on. The middleware development could have gone a lot faster if an external MCU controlling the BLE113 module was added for the sensor nodes.
8.2
Program languages
With five different languages used, C, C#, Matlab, Python and BGScript, a lot of choices had to be made. For the BLE113 modules the choice to use C instead of BGScript came to late because it was difficult and took a long time to contact Bluegiga and receive the C-SDK for the modules. The C-SDK barely has no documentation meaning it is time demanding to develop a program, but it is necessary if higher speeds are to be archived. BGScript made it possible to start testing the hardware and communication early even if it did not provide enough execution speed. For the software running on the computer, Matlab was used to be able to prove the concept within a reasonable time, but it was then changed to C# for optimisation towards execution time and the frequency of messages as well as a better way to create a user friendly GUI.
8.3
HCI commands
The amount of time dedicated to reverse-engineering the messages of the Bluetooth protocol made a big delay in the time for starting the data analysing software. But the time put in to this has been necessary to be able to gather data from the sensor nodes. The access to the data-sheet for this information has been given, but to late to be of any use in this project. If this was handed from the beginning two to three weeks more could be put in to the other parts.
8.4
Time synchronisation
With the knowledge presented in section 7.2.2, a decision to not implement a internal time synchronisation protocol on the sensor node was taken, at least not with BGScript. The late access to the C-SDK resulted in to little time to try to implement it with C code instead.
8.5
Robotics program influence
The knowledge obtained before starting the thesis during the four and a half year in the robotics program has been of outermost importance. Without the background and knowl-edge on how to build, design, debug and troubleshooting hardware that is obtained during
when being introduced to new areas. The mathematical courses preparing for implementing filters, analyses and other mathematical methods show how necessary math is as a tool for engineers.