IN
DEGREE PROJECT CHEMICAL SCIENCE AND ENGINEERING, SECOND CYCLE, 30 CREDITS
,
STOCKHOLM SWEDEN 2019
Experimental Study of
High-Pressure Fluidized Bed
Gasification of Biomass at Pilot
Scale: A Proof of Concept
AYUSH AGARWAL
KTH ROYAL INSTITUTE OF TECHNOLOGY
SCHOOL OF ENGINEERING SCIENCES IN CHEMISTRY, BIOTECHNOLOGY AND HEALTH
Experimental Study of High-Pressure
Fluidized Bed Gasification of Biomass at
Pilot Scale: A Proof of Concept
Ayush Agarwal
Supervisor & Examiner:
Professor Klas Engvall, KTH Royal Institute of Technology
School of Engineering Sciences in Chemistry,
Biotechnology and Health
DEGREE PROJECT IN CHEMICAL SCIENCE AND ENGINEERING,
SECOND CYCLE, 30 CREDITS
i
ii
Abstract
Climate change is real. Rising world population and increasing energy demands are taking a toll on the planet. Moving towards a greener, cooler and sustainable future, there is a need for cleaner, efficient, and reliable sources of energy, and biomass is one of them. This thesis work performed at KTH Royal Institute of Technology attempts to contribute to this pressing need. High-pressure biomass gasification technology is an important process intensification step. However, it is not well investigated yet. This work attempts to understand the performance and pave the pathway for future studies.
Experiments were performed using olivine, magnesite, and silica sand as bed material. Grot and birch were tested as fuel. The experiments were carried out in a 75 KWfuel bubbling fluidized bed
gasifier at 20 bar, using Steam/Oxygen as a gasifying agent. Produced gas composition, tar production, and carbon conversion efficiency were examined. Olivine and magnesite showed good resistance against attrition and agglomeration. Stable bed temperature with no signs of defluidization or sintering were observed during the experiments. Silica sand cannot be used as a bed material with grot due to its high ash content. However, mild agglomeration was also observed with the birch feedstock. Carbon dioxide in the produced gas increased with increase in pressure, whereas, carbon monoxide decreased with increase in pressure. Olivine showed excellent reduction properties for tars lighter than naphthalene, whereas, magnesite performed best for overall tar reduction for grot. It was observed that fuel feeding is a big challenge for running operation at high pressure.
These tests at 20 bar were an intermediate step to validate BFB biomass gasification at 40 bar. It would be interesting to study the changes in gas composition, tar, and char formation to evaluate the performance related to carbon conversion efficiency, produced gas composition, and tar production for different bed material at 40 bar.
iii
Acknowledgments
Firstly, I would like to extend my heartfelt thanks to my mentor and supervisor,
Professor Klas Engvall at KTH Royal Institute of Technology, who gave me the
opportunity to work on this pioneering project. He is a person who leads by
example and is always there when you need him.
I would love to thank Christer Rosén, Lars-Peter Viktorsson, and Efthymios
Kantarelis, who, along with Klas, were part of this project. It was a pleasure working
with you, staying back late to run the experiments, fixing things when they didn’t
work.
I thank Hans-Erik Hansson, Mykhailo Okhrimenko from Phoenix BioPower, who got
me started with this project by helping me prepare the fuel at their facility. I also
thank Iraj Bavarian from Verdant Chemical Technologies, who always provided
quick and accurate analysis of the tar samples we collected for analyzing.
Last but not least, I would like to thank my parents, who always supported me in
every possible way.
iv
List of Figures & Tables
FIGURE 1PICTURE COURTESY:PHOENIX BIOPOWER,WORLD TOTAL PRIMARY ENERGY SUPPLY ... 1
FIGURE 2SCHEMATIC DIAGRAM OF BTC ... 3
FIGURE 3MAIN BIOMASS CONVERSION ROUTES ... 5
FIGURE 4INTERACTION BETWEEN DIFFERENT STEPS OF GASIFICATION ... 7
FIGURE 5SCALE OF OPERATIONS FOR DIFFERENT KINDS OF GASIFIER ... 9
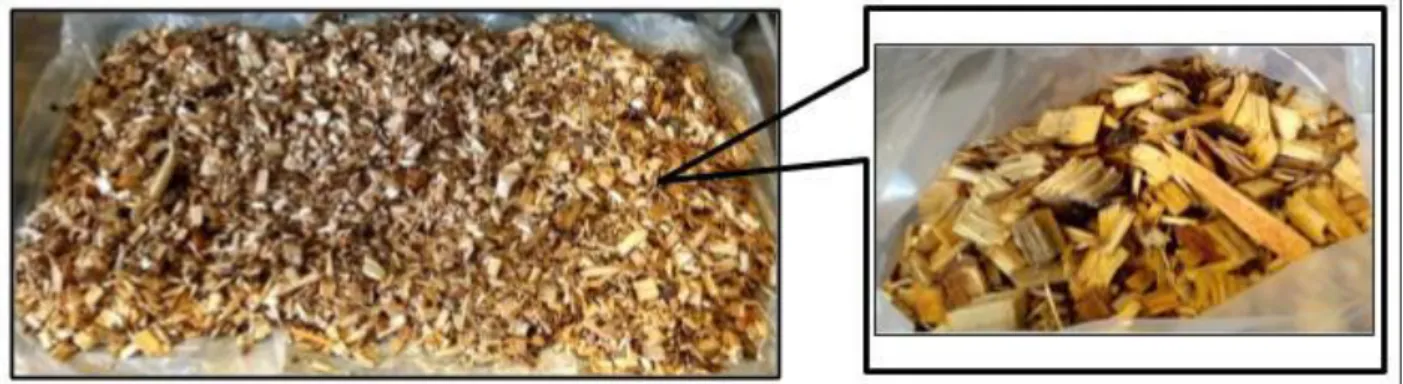
FIGURE 6GROT, AS RECEIVED ... 13
FIGURE 7PREPARED FUEL UNDER AN OPTICAL MICROSCOPE; LEFT:GROT, RIGHT: BIRCH ... 14
FIGURE 8SCHEMATIC OF PILOT-SCALE PRESSURIZED GASIFICATION UNIT AT KTH ... 15
FIGURE 9SIMPLIFIED SKETCH OF THE REACTOR SHOWING THE DIMENSIONS IN [MM](LEFT) AND THE POSITION OF THERMOCOUPLES AND PRESSURE PIPES (RIGHT) ... 16
FIGURE 10SIMPLIFIED SKETCH OF LDU WITH SAMPLING POINTS ... 17
FIGURE 11INTERIORS OF THE FUEL FEEDER SHOWING THE STIRRER AND REMAINING FEED DURING ONE OF THE CALIBRATION EXERCISES ... 19
FIGURE 12CONTROL PANEL ON THE MASTER COMPUTER... 20
FIGURE 13OLIVINE, BEFORE(LEFT) AND AFTER(RIGHT) GASIFICATION... 25
FIGURE 14PRODUCED GAS COMPOSITION (N2 FREE) OF OLIVINE TEST... 26
FIGURE 15REACTOR TEMPERATURE PROFILE OF THE OLIVINE TEST ... 26
FIGURE 16MAGNESITE, BEFORE(LEFT) AND AFTER(RIGHT) GASIFICATION ... 27
FIGURE 17REACTOR TEMPERATURE PROFILE OF MAGNESITE TEST ... 27
FIGURE 18PRODUCED GAS COMPOSITION (N2 FREE) OF MAGNESITE TEST ... 27
FIGURE 19SILICA SAND, BEFORE(LEFT) AND AFTER(RIGHT) GASIFICATION ... 28
FIGURE 20REACTOR TEMPERATURE PROFILE OF SILICA SAND TEST ... 29
FIGURE 21NITROGEN FREE GAS COMPOSITIONS FOR THE 20 BAR TESTS ... 29
FIGURE 22MAJOR GAS YIELD AS A FUNCTION OF PRESSURE FOR OLIVINE AS A BED MATERIAL ... 30
FIGURE 23TAR PRODUCTION AS A FUNCTION OF PRESSURE FOR OLIVINE AND SILICA SAND ... 32
TABLE 1MAJOR CHEMICAL REACTIONS OF BIOMASS GASIFICATION ... 6
TABLE 2PROPERTIES OF BED MATERIAL USED IN TESTS ... 13
TABLE 3PROPERTIES OF THE FUEL ... 14
TABLE 4SUMMARY OF ALL TESTS RUN ... 24
TABLE 5SUMMARY OF OPERATING CONDITIONS AND KEY PROCESS PARAMETERS ... 24
v
Table of Contents
1. INTRODUCTION ... 1
GENERAL BACKGROUND ... 1
BIOMASS-FIRED TOP CYCLE (BTC) ... 2
AIMS &OBJECTIVES ... 3
LIMITATIONS ... 4
2. LITERATURE REVIEW ... 5
BIOMASS AS AN ENERGY RESOURCE ... 5
THEORY OF GASIFICATION ... 6
TYPES OF GASIFIER ... 8
IMPORTANCE OF BED MATERIAL ... 10
EFFECT OF PRESSURE AND TEMPERATURE ... 11
3. MATERIALS AND METHODS ... 13
BED MATERIAL ... 13
FUEL ... 13
EXPERIMENTAL SETUP ... 14
SAMPLING AND MEASUREMENT ... 17
EXPERIMENTAL PROCEDURE... 18
4. RESULTS AND DISCUSSION ... 24
TEST 2 ... 25 TEST 3 ... 26 TEST 8 ... 28 GAS COMPOSITION ... 29 TAR ... 30 5. CONCLUSIONS ... 33 6. OUTLOOK ... 34 7. REFERENCES ... 35
1
1.
Introduction
By 2050, the world population is expected to increase to 10 billion, and with improving standards of living, global energy demand is expected to double. Today, more than 80% of the world energy demand is met by fossil fuels. [1] This poses two significant concerns: depleting fossil fuel reserves, and global warming due to carbon emission. Actions at a global scale need to be taken urgently for using the available energy and finite natural resources in a sustainable manner to mitigate the effects of climate change. [2]
Figure 1 Picture Courtesy: Phoenix BioPower, World Total Primary Energy Supply
General Background
Fossil fuel will remain the primary source of energy until 2040 due to falling production costs of oil and gas. Coal-fired power plants dominate electricity production and are expected to peak in the mid-2020s. Nevertheless, fossil fuels pollute our environment and is responsible for the majority of greenhouse gas (GHG) emissions in the energy sector. [2] According to the Intergovernmental Panel on Climate Change (IPCC) report, global temperature rise must be restricted to less than two degrees Celsius above pre-industrial levels to avoid irreversible change to the global climate. [3] A shift towards a climate-resilient source of energy is needed to reduce the global greenhouse gas emission and keep the global average temperature to well below 2 °C above pre-industrial levels. [4] Biomass is a great alternative to reduce our dependence on these polluting sources of energy as it is renewable, sustainable, and count for eco-friendly fuels. Biomass refers to living or recently dead biological material that can be used as fuel or for industrial production of chemicals. Biomass can be anything from energy crops to forest waste or agricultural residue and municipal wastes. Although biomass releases more CO2 per unit energy than fossil fuel like coal, it is still better than burning fossil fuels.
This is because burning fossil fuel releases the carbon that was sequestered underground for millions of years, compared to the carbon emission from biomass, which is already a part of the biogenic carbon cycle. [5] Today, biomass contributes to about 14% to global energy
2
utilization, making it the fourth-largest source of energy after the fossil trio of coal, oil, and natural gas. Biomass is the only renewable energy resource that can be converted to solid, liquid, and gaseous products through various conversion processes. [6] [7]
In the present project, we are primarily interested in residual streams from forest and agricultural industries. It can be wood chips, tree branches, straw, corn cobs, husks, and shells, etc. The objective is to replace coal with these industrial wastes as a renewable resource. A major advantage of biomass compared to other renewable sources of energy, such as solar and wind energy, is that it is not dependent on the weather. Bioenergy can complement the intermittent wind and solar power, supplying dependable, plannable, renewable power 24 hours a day, 365 days a year.
Over 68% of Sweden’s area is covered by forest. [8] Despite having under 1% of the world’s commercial forest reserves, Sweden is the world’s 3rd largest exporter of pulp, paper, and
sawn timber, providing 10% of the global supply. [9] The standing volume of the Swedish forest reserves is around 3 billion cubic meters and is growing at the rate of 120 million cubic meters each year. Only about 85 million cubic meters of this forest is harvested every year. Approximately 45% of the harvest goes into making timber, around 40-45% is used by the pulp and paper industry. The remaining 10-15%, mainly consisting of tops and branches, are of no use to any of these industries and are currently used as biofuel providing heat and electricity. [10]
Biomass-fired Top Cycle (BTC)
Phoenix BioPower AB is developing high-efficiency biomass-fired power generation systems. The Biomass-fired Top Cycle (BTC) is a high-pressure, integrated plant to convert biomass to heat and power. Biomass is gasified at high pressure integrated with a steam injected gas turbine. The idea is to gasify the biomass, feed the produced gas to a gas turbine, and drive the generator to produce electricity. Initially, the focus will be on wood chips, and later, the possibility of including a broad spectrum of available biomass will be explored. There are three key principles of BTC technology. Firstly, the biomass is treated using high-pressure steam and gasified. Secondly, the produced gas, along with the steam, is then combusted in a gas turbine for power generation. Thirdly, the heat integration of the entire system is optimized to achieve high conversion efficiencies. According to an EU funded project report, the average electrical efficiency of biomass-fired Combined Heat and Power (CHP) Plant in the EU is around 22%, and that of biomass-fired power plants is 32%. [11] On the contrary, the BTC process can achieve electrical efficiency of up to 60%. Depending on the location of the plant, the waste heat from the BTC process can be also be utilized to supply district heating, giving overall combined heat and power efficiency of around 110%. Thereby, further reducing the dependency on fossil fuel for industrial and district heating.
3
Figure 2 Schematic Diagram of BTC
BTC uses high-pressure steam for pre-treating the biomass to obtain biocoal, which is subsequently gasified at high pressure, as shown in Figure 2. After cleanup, the steam and produced gas mixture is combusted at 60+ bar powering the gas turbine. Steam helps in controlling the temperature and moderating the process. The resultant steam-hot gas mixture drives the turbine expander to provide power to the generator. Steam is the heat carrier and the working media in the entire plant as it can recover energy from both the turbine exhaust and the gasification process. The utilized steam and water content in the exhaust gas condensed and reused, making the process water sufficient. The heat recovered from condensing this exhaust can be used for district heating and biomass drying.
Aims & Objectives
The objective of the present study is to study gasification at pressures of interests for the BTC process. Gasification of biomass feedstock at high pressures in fluidized bed gasifier is not well investigated. The kinetics of char gasification and tar formation at very high pressures, i.e., 20-70 bar is relatively unknown. The main aim is to demonstrate the proof of concept of fluidized bed gasification at 40 bar, including tests at 20 bar. In these tests, we aim at evaluating the performance related to carbon conversion, produced gas composition, and tar production for different bed material. Finally, we aim at comparing and understand how the gas composition, tar production is affected by pressure.
4
Limitations
The experiments carried out as a part of this Master thesis is limited to tests conducted at 20 bar only. Since the tests aimed at demonstrating the proof of concept of high-pressure gasification, the tests with each bed material were not repeated after a successful run. In order to understand the effect of high pressure on gasification, pressure was the same for all the tests.
5
2.
Literature Review
Biomass as an energy resource
According to The European Commission, "Biomass means the biodegradable fraction of products, waste, and residues from biological origin from agriculture (including vegetal and animal substances), forestry and related industries including fisheries and aquaculture, as well as the biodegradable fraction of industrial and municipal waste.” [12] Biomass is considered renewable and sustainable because plants naturally capture carbon dioxide from the atmosphere during the photosynthesis process, which is released back into the atmosphere when used to generate energy. Thus, ideally, biomass is a CO2 neutral source of energy as it
does not result in any net CO2 emission into the atmosphere. However, in real cases, when
the emissions during transportation, storage, and drying of biomass are considered, its carbon neutrality may change; therefore, careful Life Cycle Analysis (LCA) needs to be done.
A typical composition of biomass comprises cellulose, hemicelluloses, lignin, extractives, lipids, proteins, simple sugars, starches, water, inorganics (ash), and other compounds. The cellulose and hemicellulose are the fiber of the biomass, whereas lignin acts as the glue of these fibers. Different biomass has different parameters, such as chemical composition, moisture content, ash, and inorganic substance content. The elemental composition of biomass mainly includes carbon, oxygen, hydrogen, nitrogen, calcium, potassium, silicon, magnesium, aluminum, sulfur, iron, chlorine, sodium, etc. [13] [14] Biomass has a relatively lower energy per unit mass, compared to natural gas. Therefore, biomass needs to be valorized in order to be used effectively.
Figure 3 Main Biomass Conversion Routes
Combustion
Heat Electricity Fuels
Gasification Pyrolysis Liquefaction HTU Extraction ) oilseeds ( Thermochemical conversion Biochemical conversion
Digestion Fermentation Fuel cell Steam turbine Gas turbine, combined cycle, engine Methanol/ hydrocarbons/ hydrogen synthesis
Upgrading Distillation Esterification
Diesel Ethanol Bio-diesel
Steam Gas Gas Oil Charcoal Biogas
Gas engine
6
Figure 3 shows the main routes for the conversion of the biomass into different forms of energy. The two main types of conversion routes are thermochemical conversion and biochemical conversion. In both types, absence or presence of oxygen makes the difference. For example, in thermochemical conversion, the presence of excess air results in combustion, and the absence of it results in pyrolysis. The thermochemical conversion is faster than the biochemical alternative. The thermochemical conversion route takes only up to a few minutes to get usable energy from biomass. Whereas, the biochemical conversion route can take up to a few days. The thermochemical route is more flexibility in terms of the type of intermediate energy carrier produced and end-user energy application. The thermochemical conversion paves the pathway for heat, electricity, and synthetic fuel applications. In the present project, gasification is the chosen conversion route for heat and power applications, which will be discussed in detail in the following section. [15] The technology is a promising way to valorize biomass and use it with high efficiency in combined heat and power plants, but also as for production of second-generation biofuels, and other synthetic chemicals via Fischer–Tropsch synthesis. [16]
Theory of Gasification
Gasification is the thermochemical conversion of an organic fuel like biomass in the presence of a limited supply of oxygen into the permanent gaseous products mainly comprising of carbon monoxide (CO), carbon dioxide (CO2), hydrogen (H2) and methane (CH4). The gas from
the gasifier is called producer gas, which in addition to the main permanent gases, also includes higher hydrocarbons, tars, water vapor and even nitrogen, if air is used as the gasifying agent. Gasification is a partial oxidation process where the biomass undergoes a combination of drying, combustion, pyrolysis, and gasification reactions in a reactor called gasifier. [17] The oxygen supplied is only a fraction of the stoichiometric quantity needed for complete combustion. [6] If air is not used as a gasifying agent, the producer gas can be cleaned and conditioned to the desired composition of a synthesis gas, which mainly comprises of carbon monoxide and hydrogen. This synthesis gas can be used for the synthesis application for production of synfuels and chemicals.
Table 1 Major Chemical Reactions of Biomass Gasification
Reaction Name Equation ∆𝐻298𝐾 [𝑘𝐽 ∙ 𝑚𝑜𝑙−1]
1 Combustion 𝐶 + 𝑂2 → 𝐶𝑂2 -283
2 Partial oxidation 𝐶 + ½𝑂2→ 𝐶𝑂 -111
3 Water gas reaction 𝐶 + 𝐻2𝑂 ⇌ 𝐶𝑂 + 𝐻2 131
4 Boudouard reaction
(reverse)
𝐶 + 𝐶𝑂2⇌ 2𝐶𝑂 172
5 Methanation reaction 𝐶 + 2𝐻2 ⇌ CH4 -75
6 Steam reforming CH4+ 𝐻2𝑂 ⇌ 𝐶𝑂 + 3𝐻2 206
7 Water gas shift reaction 𝐶𝑂 + 𝐻2𝑂 ⇌ 𝐶𝑂2+ 𝐻2 -41
8 Pyrolysis 𝐹𝑢𝑒𝑙 ⇌ 𝐶𝑂 + 𝐶𝐻4+ 𝑡𝑎𝑟 + 𝑐ℎ𝑎𝑟 Endothermic
7
Table 1 lists all significant reactions that take place during gasification, and Figure 4 shows how the heat and reactants interact with each other inside the gasifier. [13] [18] When the fuel enters the hot reactor, the combustion and partial oxidation reactions (1 and 2) provides the necessary heat energy for the rest of the reactions. Drying, pyrolysis (reaction 8), and main gasification reactions (3 and 4) are highly endothermic reactions. The methanation reaction (5) is a mildly exothermic reaction, which also provides some heat. The steam reforming reaction (6) is also a highly endothermic reaction that consumes heat. Figure 4 also shows how these reactions run parallelly and in sequence at the same time. The product of one reaction acts as the reactant of another, leading to a very complex reaction system. Reactions 1 and 2 are fast reactions, while reactions 3-5 are the slower and, therefore, rate limiting reactions. [19]
Tars are mainly produced during the pyrolysis in reaction (8), which are undesirable in the gasification process. According to International Energy Agency (IEA) Bioenergy Agreement, the US Department of Energy (DOE), and the DGXVII of the European Commission, all organic components of the product gas, having molecular weight higher than benzene, i.e., 78 g/mol, are classified as tar. [20] Tars are mainly aromatic hydrocarbons with dew point starting from 350°C, making them highly condensable. Higher production of tar may lead to choking, blocking, and fouling of downstream equipment. [21] Produced tars can be removed in two ways. Firstly, it can be decomposed within the gasification unit by using appropriate catalysts, or by altering the process conditions that favors tar reduction. Alternately, tar can be reduced downstream in a separate catalytic cracker and separated from the produced gas stream. The gasifying agent has a significant impact on the produced gas composition, calorific value, and tar yield. Air, oxygen, steam, or a mixture of these are the most commonly used gasifying
8
agents. Gasification using air produces gas with lowest calorific value as much of the gas is diluted with nitrogen. Gasification using steam and/or oxygen produce gas with higher calorific value. The Lower Heating Value (LHV) of produced gas using air as gasifying agent is between 4.5-6.5 MJ/m3, and is between 12.5-13 MJ/m3 for using a mixture of steam and
oxygen. [22] These gasifying agents react with the carbon material and have a strong influence on the thermodynamics and kinetics of the reactions. In this study mixture of steam and oxygen is used as the gasifying agent. Equivalence ratio (𝜆) (Eq. 1) is the ratio between the actual oxygen supplied to the amount required for complete combustion. A complete combustion reaction has an 𝜆 equal to 1. The oxygen reacts in the partial oxidation reaction (2) and with the volatiles produced in the pyrolysis reaction (8), providing the heat for the rest of reactions (as shown in Figure 4) and simultaneously reducing the initial tar production significantly. [23]
𝜆 = 𝑂𝑠𝑢𝑝𝑝𝑙𝑦
𝐶𝑑𝑟𝑦 𝑓𝑢𝑒𝑙+ 0.5𝐻𝑑𝑟𝑦 𝑓𝑢𝑒𝑙− 𝑂𝑑𝑟𝑦 𝑓𝑢𝑒𝑙
[𝑚𝑜𝑙
𝑚𝑜𝑙] 𝑒𝑞. (1)
A higher equivalence ratio leads to higher yield of produced gas with lower tar production. [6] However, higher 𝜆 significantly reduces the calorific value of the produced gas due to increased production of CO2. Therefore, the optimum value of 𝜆 is between 0.2-0.4. [23] For
𝜆 below 0.2, the oxygen will not be sufficient for the oxidation reaction (2) to provide sufficient heat and pyrolysis reaction (8) will dominate, producing excess tar and higher hydrocarbons. If the produced gas is to be used without cooling for combustion or other energy applications, gasifier can be operated starting from 𝜆 = 0.2 as tar will not be a problem and the calorific value will be higher. However, when gas application demands lower tar concentration, 𝜆 can be increased depending on the operating temperature. If the gasifier is operated at temperature lower than 850°C, tar yield will be higher due to insufficient thermal cracking, then gasifier can be operated with 𝜆 between 0.3 - 0.4 to compensate for such effect. [7] [24]
Another essential process parameter is the steam to fuel ratio. It is simply the ratio between the steam supplied and the dry fuel feeding rate. Increasing the steam to biomass ratio leads to improved calorific value due to higher yield of hydrogen mainly because of reactions 3, 6 and 7. [7] However, the effect of increasing the steam at higher pressure is unknown because at higher pressure the reaction will tend to move towards the side producing lesser number of molecules.
Types of Gasifier
Different gasification technologies are available, depending on scale, feedstock properties, and end user application. Gasifiers are designed based on three criteria, namely – mode of contact between the fuel and gasifying agent, method and rate of heat transfer, and residence time of the fuel in the reactor zone. [13] These different designs come with their own set of advantages and disadvantages. There are mainly three types of commercial gasifiers – fixed bed, fluidized bed, and entrained flow gasifier.
9
Figure 5 Scale of operations for different kinds of gasifier
Updraft (counter-current) and downdraft (co-current) are the main designs based on fixed-bed reactor design. They have an excellent tolerance for coarse feed. In updraft gasifier, the gasifying agent is introduced from the bottom of the reactor and the fuel is fed from the top. There is a good contact between the solid material and the gasifying agent resulting in very high thermal efficiency. However, this leads to high tar content in the gas, because it passes through the low temperature pyrolysis and drying region at the top of reactor. This is a major disadvantage of this design as energy content of the tar is >20%, therefore, subsequent tar removal is needed. This problem is solved in the downdraft gasifier where both the gasifying agent and the fuel are fed from the top. Thus, all the gas, along with all the products from pyrolysis zone is forced to pass through the high temperature oxidation zone. This leads to thermal cracking of the volatiles, producing gas with much lower tar content. [25] However, as shown Figure 5, [26] downdraft gasifiers are only suitable for small scale applications. The entrained flow gasifier is on the other hand good for very large-scale applications with <high carbon conversion and very low tar concentration due to its high operating temperature of over 1200°C. However, it can take in only very fine fuel feed with less than 15% moisture and a constant composition. [27] [28]
The fluidized bed gasifier is the medium range gasifier with its own set of advantages and disadvantages. Here the bed material which is in granular form is fluidized by the gasifying agent, which is forced from the bottom of the reactor, while the fuel is fed from the top. This constant mixing provides uniform bed conditions ensuring proper heat and mass transfer between the solid and the gas. The main advantage over fixed bed gasifier is the enhanced mixing, resulting in nearly isothermal conditions. [29] The operating temperature is highly dependent on the sintering temperature of the bed material which is often less than 900°C. This temperature is relatively low for achieving stable gasification. The short residence time is one of the reasons for not achieving chemical equilibrium. Therefore, catalytic bed materials are needed to push the reaction towards equilibrium. [14] Bubbling fluidized bed (BFB) and circulating fluidized bed (CFB) are the two major types of fluidized bed gasifier. BFB is the simplest and one of the most cost-effective continuous feed gasifiers, which can handle a variety of biomass with various sizes. Although it provides a high rate of heat transfer and mixing between bed material and fuel, the slower diffusion rate of oxygen creates an oxidizing condition in the entire bed reducing the gasification efficiency. The CFC overcomes this limitation by providing longer residence time for the fuel, resulting in lower tar production. However, CFC operates at very high fluidization velocity making the process complex and relatively difficult to control. [7]
10
In the present study, bubbling fluidized bed (BFB) gasifier was used considering the scale of operation, lower footprint and ease of operation under pressurized conditions.
Importance of Bed Material
Mechanical properties, chemical properties, and the cost determines which bed material is to be used in fluidized bed gasification. [30] The bed material is mainly responsible for the proper distribution of heat in the reaction zone. The heat produced from the exothermic reactions gets accumulated in the bed material and gets transferred to endothermic processes like drying, pyrolysis, gasification reactions due to intense mixing. This prevents the temperature peaks in the reactor, and nearly uniform temperature distribution can be achieved in the bed zone. However, fluidization conditions can cause mass loss due to attrition, producing fines which may enter the downstream processes. Therefore, good mechanical strength is also needed. [31] In principle, the bed material is expected to remain inert during the process. But then, if it possesses some catalytic properties, the choice of bed material can largely influence the produced gas composition in terms of hydrogen yield and tar content. In the absence of catalysts, methane and heavier hydrocarbons, including tar, are present in the gas, because the slow gasification reactions are unable to reach equilibrium at the operating conditions. [14]
The bed material can be a mineral material, such as silica sand, olivine or limestone material, but can also be made of metal or metal-oxide on inert oxide support. This kind of structure only gives the desired mechanical stability but also provide the large surface area for catalytic activities. Commonly, mineral-based material is preferred due to its lower cost. The biggest challenge comes when fuel with high ash content is used. Ash sintering and bed particle agglomeration may occur due to alkali metals and chlorine content of the fuel. These compounds form low melting eutectics with silica in the sand or the ash itself, causing the stickiness of the particles, eventually forming lumps called agglomerates. These lumps affect the hydrodynamics of the reactor negatively, ultimately leading to defluidization of the bed. Consequently, resistance to agglomeration is essential. In addition to these desired mechanical and chemical properties, the availability and cost of the bed material dictate its suitability for the process. Thus, naturally abundant materials are highly preferred. Good disposability of the bed material is also desired as disposal of degraded materials according to the environmental protection laws involves additional cost. Thus ideally, the bed material should have good resistance against agglomeration, have high mechanical stability with catalytic tar cracking abilities and low cost. [32]
Silica sand has excellent mechanical properties and is the most economical bed material. It is chosen for the reference test for being inert and non-catalytic. However, it is most susceptible to agglomeration. The potassium salts in the ash react with the silica in the sand and the ash itself to form different potassium silicates, which have a low eutectic temperature of 700°C. This behavior has been extensively studied under atmospheric pressure gasification, but not under pressurized conditions. Thus, it will be interesting to observe its performance. [32] Olivine has excellent resistance to agglomeration. It is a natural, inexpensive and magnesium containing disposable mineral with a lower level of silica compared to silica with an empirical formula (𝑀𝑔𝑥𝐹𝑒1−𝑥)2𝑆𝑖𝑂4. Presence of iron in different oxidation states gives its catalytic
11
properties towards the tar removal and the Water-Gas-Shift reaction. [33] Magnesite, on the other hand, is a mineral containing much lower content of silica and a much higher level of magnesium compared to olivine. In previous studies, it has been used both as an additive and as bed material. In addition to its tar destructing catalytic properties, it has excellent resistance to attrition. Ca- and Mg- containing minerals have good resistance to agglomeration at high temperatures. This is because they have a higher affinity towards potassium and silica, forming compounds with melting temperatures as high as 1100°C. [34] In one of the studies comparing different bed materials, magnesite was reported to have higher activity than olivine. [35]
Effect of Pressure and Temperature
More energy is expended in compressing a large volume of gas downstream of the gasifier than in compressing the reactants (solid biomass and gasifying medium) upstream of the gasifier. Therefore, pressurized gasification is very attractive from the process intensification point of view. [36] However, there are many challenges associated with high-pressure gasification. This is one of the reasons there is a lack of research performed in this area. Gasification by itself is a process with a lot of complex reactions, adding the effects of pressure to the thermodynamics will further complicate the matter.
In literature, both increase and decrease in the tar formation is reported. [6] According to Le Chatelier’s principle, an increase in system pressure will lead to a shift in the equilibrium to fewer molecules. This is in the opposite direction of the reforming reactions (6 and 7) and tar decomposition reactions. As a result, one may expect higher tar formation. However, high pressure also hampers the release of tars in the pyrolysis reaction. Therefore, it is difficult to predict the effect of pressure on total tar production. [16] This might have to do with other things that change when the operating pressure is increased. With an increase in pressure, the quantity of both oxygen and gasifying agent is increased. So, in order to keep the same steam-fuel ratio and equivalence ratio, feeding needs to be increased proportionally. [16] The size of the reactor then becomes the issue. Alternatively, one can dilute the system by feeding inert species like nitrogen, but that will reduce the quality of produced gas. In one study, it was observed that at high pressure, with an increase in air supply, the H2 and CO
concentration decreased, while the level of CO2 and N2 increased. [37] In the present study,
we will be using nitrogen to pressurize the system. As a result, the quality of gas produced will be very low. However, all our analysis and reporting of data will be N2-free to be able to
compare to other studies.
The reactor temperature is one of the most important parameters of the gasification process. Based on thermodynamics and chemical kinetics, temperature influences the produced gas composition. While high temperatures favor the formation of products in an endothermic reaction, they shift the equilibrium to the reactant side in exothermic reactions. [7] Tar decomposition reactions are also strongly affected by the operating temperature. Higher temperature leads to better cracking and reforming of tars, resulting in improved gas yield. [16] In case of steam gasification, studies have shown increase in H2 production due to better
steam reforming. However, in case of air gasification, high temperature improves combustion of biomass, resulting in higher production of CO2 and N2. [6]
12
One of the most challenging aspect of high-pressure operations is continuous feeding into the reactor. Enough care should be taken not to have any leakage during the feeding. The air is more viscous when under pressure; thus, it changes the flowability of the fuel. Also, if the fuel particles are coarse and rough, they may get interlocked and stuck with each other under a pressurized atmosphere. This will lead to a problem in feeding, and the feeder calibrated under atmospheric conditions may not be feeding at the same rate under pressurized conditions.
13
3.
Materials and methods
All the experiments performed as a part of this thesis were conducted at KTH Royal Institute of Technology, Stockholm.
Bed Material
Olivine, Magnesite, and Silica sand are chosen for this study. The properties of these bed materials are listed in Table 2. Each of these bed materials was sieved, and 1.5 liters of the fraction between 200 – 250 μm was used in the experiments.
Table 2 Properties of Bed Material Used in Tests
Compound [wt-%] Olivine Magnesite Silica
SiO2 42.00 3.95 98.40 MgO 47.60 79.4 - FeO+Fe2O3 9.75 2.9 <0.25 CaO 0.13 7.49 - Al2O3 0.40 0.34 <2.00 MnO 0.13 0.16 - Density [kg/m3] 3300 2650 2800
Fuel
Branches and tops called grenar och (träd)toppar in Swedish, which is often abbreviated as Grot is the primary choice of fuel for the experiments in the present study.
Grot, as received (Figure 6), had very high moisture content. Therefore, it had to be dried before grinding. On an average, it was dried for 24 hours using hot air blowers at 80 °C to get rid of the free moisture. After grinding, the fuel was sieved, and the size fraction between 2-3 mm was used in the experiments. The prepared fuel was analyzed, and its properties were determined before running the tests. The determined fuel properties are listed in
Table 3. As we can see that Grot has relatively high ash content, and is also rich in alkali and chlorine. Hence, we expect a high tendency of agglomeration, especially with silica sand. Bark free birch chips is therefore used as standby fuel.
14
Table 3 Properties of the fuel
Property GROT Birch
Proximate Analysis
Moisture [%] 6.5 6
Volatile Matter [% dry] 86.4 85.6
Ash [% dry] 0.56 0.30
Fixed Carbon [% dry] 13.04 14.1
Ultimate Analysis Carbon [%] 50.6 49 Oxygen [%] 42.8 44.4 Hydrogen [%] 5.9 6 Nitrogen [%] <0.11 0.18 Chlorine [%] 0.024 0.01 Sulfur [%] 0.025 <0.012
Ash Analysis (Alkali and Silica)
SiO2 [% wt.-ash] 1.6 1.4
K2O [% wt.-ash] 28 18
Na2O [% wt.-ash] 0.42 0.5
Calorific Value As Received [MWh/ton] 5.123 5.104
Dry Basis [MWh/ton] 5.479 5.125
Upon inspection under an optical microscope (Figure 7), Grot has a very rough appearance, with many fibers protruding from the surface like splinters. We can also see some bark particles in the final fuel. Birch, on the other hand, has a very smooth and compact structure with no loose fiber in sight.
Experimental Setup
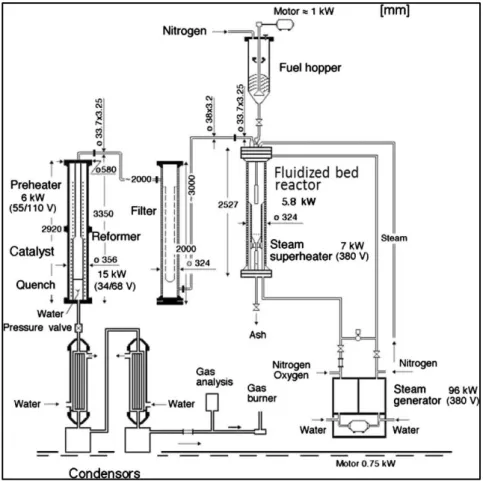
The experiments were performed in a pilot-scale testing rig called the Laboratory Development Unit (LDU), which consists of a top-fed bubbling fluidized bed reactor followed by high temperature filter and a secondary reforming unit. Figure 8 shows a detailed and informative process picture of the LDU. The pressurized fluidized bed (biomass) gasifier
(PFBG) has a working range of 10-75 kWth, with the current maximum operating pressure of
15
30 bar, and maximum operating temperature of 950°C. The fuel is fed from a stirred hopper with a storage capacity of 120 liters and a maximum feeding capacity of 15 kg/h. The filter and reformer have a maximum temperature of 550°C and 1100°C, respectively. All the flowmeters installed in the system are calibrated to give readings in Normal Temperature Pressure.
Figure 8 Schematic of pilot-scale pressurized gasification unit at KTH
The fuel hopper is pressurized using a stream of nitrogen and is maintained at a slight overpressure compared to the reactor. The stirring inside the hopper, along with the flow of nitrogen, transports the fuel through the feeder outlet. Here nitrogen acts as the carrier gas, which serves two main purposes. Firstly, it provides the required velocity to the fuel particle entering the pressurized reactor, thus preventing the hot gases from the reactor entering the feeder. And secondly, it does not let the fuel heat up before entering the reactor. The fuel falls freely through the feeder outlet and enters the reactor after passing through the fuel feeding measurement device. This feed then goes directly into the fluidized bed through the feeding pipe, which is insulated and externally cooled with nitrogen. Heating up of fuel prior to entering the bed is avoided to prevent pyrolysis, which may plug and choke the feeding system.
16
The reactor can be divided into two zones, namely the bed zone or the reaction zone in the bottom, and the freeboard zone at the top. The reactor zone has an inner diameter of 0.100 m and a height of 0.490 m. The freeboard measures 0.150 m in diameter and is 0.435 m in height.
The temperature and pressure drop inside the reactor is monitored using thermocouples and pressure pipes along the reactor. Figure 9 shows the placement of the nine thermocouples and three pressure pipes, along the length of the reactor. Dp1 gives an indication about the
bed density. When the density of the bed decreases, Dp1 also decreases, as with rarer bed,
the air has lesser resistance. Dp2 displays the pressure drop across the entire reactor,
indicating an overall increase or decrease in density when it increases or decreases respectively. The interior walls of the reactor and the perforated cone shaped bottom is made of Inconel Steel. The preheated gasifying agents like air, nitrogen, and steam pass through these perforations and fluidize the bed material.
The produced gas leaves from the top of the gasifier and is transported to the filter through a heated pipe. The high temperature filter consists of three 1 m long Inconel steel tube socks that trap the fly ash, char, etc. These tube socks are heated up to prevent the tar and volatiles from condensing. The filtered gas then goes to the secondary reactor or the reformer, where it is possible to thermally or catalytically reform the gas and crack the tar. However, this may be bypassed depending on the experiment. In the present study, the reformer was bypassed, and the gas from the filter was directly sent to water coolers where most of the tar and steam are condensed, and the remaining aerosols are trapped using two 5 μm filters. This cooled and cleaned gas is further dried before measuring its flow and analyzing its composition.
Figure 9 Simplified sketch of the reactor showing the dimensions in [mm] (left) and the position of thermocouples and pressure pipes (right)
17
Sampling and Measurement
The simplified schematic diagram of LDU (Figure 10) shows the two gas sampling points. The gas and tar produced are analyzed using the μGC and Solid Phase Adsorption (SPA) method, respectively. While μGC is an online method, the SPA method is offline and needs to be analyzed in a lab externally.
Figure 10 Simplified sketch of LDU with sampling points
The gas sampling point for tar analysis is located right next to the top of gasifier, where a by-pass tube with a septum is connected. At this sampling point, the gas temperature is above 300 °C. Gas sampling is done manually in a tube made of amino phase adsorbent media, connected to a 100 mL syringe. For each gasification test, three sets of three samples are collected during different phases of operation. Each sampling is done for one minute. Adsorbed tar components are later washed out in dichloromethane and analyzed using Varian CP3800 gas chromatograph by Verdant Chemical Technologies. A wide range of tar compounds are detected, including benzene, toluene, m/p-xylene, o-xylene, indan, indene, naphthalene, 2-methylnaphthalene, 1-methylnaphthalene, biphenyl, acenaphthylene, acenaphthene, fluorene, phenanthrene, anthracene, fluoranthene, pyrene. These quantities are reported in g/mL gas.
For permanent gas analysis using μGC, clean, cool, and dry gas is needed. Therefore, after passing through the filter, the gas is cooled in the condenser, and all its moisture is absorbed by passing it through a column of Phosphorous Pentoxide (P2O5) before the sampling point.
The gas composition is determined online, five minutes, using the Thermo Scientific™
C2V-SPA
18
200 4 channel micro GC. It can detect CO2, CO, CH4, H2, N2, C2H2, C2H4, C2H6, 1-butene, C6H6,
C7H8, and O2. Nitrogen is inert, measuring it allows us to verify the μGC results by matching
the shown amount with the total quantity of nitrogen fed into the system. All the results are reported in 𝑣𝑜𝑙 − % of the produced gas. These numbers may sometimes need normalization because they do not add up to 100%. After normalization, we can compute the relative composition of the gas, nitrogen-free basis. It is always interesting to know how much N2 free
gas we produced.
Experimental procedure
Running experiments at LDU consists of five stages, namely preparation, startup, feeding, steady state operation, and shut down. Due to the scale of operation, extra safety precautions need to be taken.
During the preparation stage, one of the most important things to do is to conduct a leak test of the entire system at 20 bar. It is done for two reasons. Firstly, the process generates CO, which is a highly toxic gas. So, to ensure the safety of everyone in and around the facility, we must ensure that there is no leakage in the system whatsoever. Secondly, leaks result in unaccounted loss of mass which may lead to inaccurate analysis. During the leak test, the system is pressurized by feeding nitrogen gas. Once the target pressure is reached, the nitrogen feeding is stopped. The decrease in pressure over time is monitored to determine the total leakage in the system. All the major joints and connections are observed using a soapy water solution as a preliminary test. Then helium is injected into the system, and all the potential leakage points are sniffed using helium sniffer. This is a more thorough and comprehensive way of identifying any leakage. If any leak is discovered, it is noted and fixed after depressurizing the system. The test is repeated until we have a leakproof system. All the calibrations are done during this stage. Major equipment that we calibrate are the steam generator, fuel feeder, and also the online gas analyzer, if necessary. It takes almost a day to calibrate the steam generator. The steam pipes are first heated up to 300 °C using electrical heaters to prevent any condensation inside the system. The steam boiler consists of two sides – the process side and the cooling side. Steam from the process side, called process steam, goes directly into the reactor, whereas steam from the cooling side, called the cooling steam is first made to pass over the outer surface of the freeboard to prevent overheating, before being fed into the reactor. The single motor speed, and the individual stoke rates and the opening of the steam valve for both process steam and cooling steam can be controlled to achieve the desired steam flow rate. The boiler feed water tank is weighed on a digital balance, which gives us the real rate of consumption of the water over time, which is linked to the rate of steam generated. This helps us fix the boiler settings during the operation.
Fuel feeder calibration is performed before each test. The physical properties – dryness, smoothness, shape, and size, of the fuel determine its flowability. The fuel hopper has a stirrer inside (Figure 11) that helps the fuel pass through the feeder. Different feeding rates can be obtained by adjusting the speed of the stirring shaft and by adjusting the opening at the feeder outlet. The feeding rate at any particular setting is the average of three measurements
19
taken during a ten-minute interval. When the desired feeding rate is achieved, the feeder settings are noted. Test fuel is then refilled into the hopper, which is now ready to use.
Figure 11 Interiors of the fuel feeder showing the stirrer and remaining feed during one of the calibration exercises
In addition to leak tests and calibrations during the preparation step, there are a number of routine checkups and tasks done. The availability of the gas used during the test – nitrogen, hydrogen, and oxygen is ensured before starting the experiments. The temperature of all heated parts in the plant, including reactors, filter, gas ducts, flanges, after burner, etc. is slowly increased from standby temperature of 180 °C up to 400 °C. Electrical signals from all the measurement and control equipment like pressure gauge, flow meters, thermocouples, etc. are checked. The feeding pipe and pressure pipes that go inside the reactor are cleaned. After this, the filled and calibrated feeder is carefully placed on top of the reactor in its operating position, and all the power cables and gas pipes are connected. On the day of the experiment, the connection between the process system and the online gas analysis system is established. The process and surveillance program are run, and communications with all side systems are ensured. Entire testing rig is controlled manually on the control panel, and the process parameters of temperatures, pressures, and flows need to be recorded. Thus, the process data logger is activated, and all the test data is recorded right from startup until shut down.
Before starting up, the last few checks need to be made. The reactor, filter, and gas ducts must have reached 400 °C. All the inlet gas pressures must be checked and adjusted if necessary. The water-cooling system for gas coolers must be turned on, and the ventilation in the lab must be increased by starting the exhaust system. LDU being high pressure, pilot-scale unit, needs a team of at least three personnel – two operators and one researcher to conduct sampling and analysis during the operation. Some of the most critical process
20
parameters that are carefully monitored during the operation are the absolute pressures, the thermocouple readings, the gas flows, and gas content & concentration. Figure 12 shows a screenshot of the process screen during one of the experiments.
Figure 12 Control panel on the master computer
During startup, the heaters for has sampling sites are turned on, and the main gas lines of N2,
O2, and H2 are open. Nitrogen gas is used for pressurizing the fuel hoper, purging the pressure
pipes, and for cooling of feeding pipe. The steam superheater at the bottom of the reactor is turned on. Nitrogen main valve is also opened a little before the bed material is poured into the reactor. The reactor is then sealed, and the nitrogen flow rate is increased. The reactor bottom (TC2-TC5) can be preheated up to 600 °C using electric preheaters. The remaining 100 °C to 350 °C increase in temperature is obtained and sustained by burning hydrogen with oxygen. Both the temperature and pressure are very closely monitored during this phase. Once the desired temperatures are reached, hydrogen supply and the electric preheaters are turned off before the fuel feeding begins.
Feeding is the most critical and challenging part of the entire operation! The pressure between the reactor and fuel hopper should be equalized first. Then the main feeding valve should be opened. Immediately after opening the valve, the flow of nitrogen into the feeder should be increased, and feeding should be started by switching on the stirrer simultaneously. The signal from the fuel feeding indicator should be monitored to ensure that the fuel is entering into the reactor. The oxygen supply into the reactor is adjusted according to the temperature inside the reactor. All the parameters, including temperature, pressure, all inlet gas flows of N2, O2, steam, feeding flow, product gas flow, and product gas composition (GC),
21
Steady-state conditions are reached when the reactor temperature, pressure, gas flow, and the gas composition become stable. The tar sampling is done during this stage. The overall carbon balance and other calculations are also done over this period of time. Given the limited supply of process gas, these experiments can run for a maximum of two to three hours, depending on the fuel feeding rate and bed material.
Once all the samplings are done, we can stop the fuel feeding and the oxygen supply simultaneously. The main feeding valve is closed, and the flow of nitrogen into the feeder is reduced. The inlet steam is replaced with nitrogen, and the superheater in the reactor bottom is turned off. All the electrical heaters are turned down and set to the standby temperature of 180 °C. The main pressure valve is then opened to release the pressure gently. The recording of the process data is stopped, and it is collected for analysis. The system is continuously purged with nitrogen and is allowed to cool down until the next day. After cooling down, the bed material is collected along with any leftover fuel/char from the reactor. The filter is also cleaned to collect fly-ash and/or soot particles, which also contribute to the carbon balance.
Carbon Conversion Efficiency
In principle, mass balance for the biomass gasification process can be performed over any element – carbon, oxygen, hydrogen, or even nitrogen. However, the reason carbon is used as our basis is because of two reasons: Firstly, carbon is our element of interest, as we want to know how much carbon from the fuel could get converted to produced gas. Secondly, it is about ease of calculation. It is difficult to balance hydrogen and oxygen because, in addition to being contained in the biomass, we supply it too by means of water (for both hydrogen and oxygen) and oxygen (as gasifying agent). Given that nitrogen being inert, makes it an attractive element for balancing. However, in this case, carrying out mass balance over carbon is in our interest. During these experiments, carbon balance will be done only over the period of stable operations. All the operating parameters like temperature, pressure, flow, gas composition, etc. will be averaged out during that interval of time will be reported here. For the sake of simplicity, char production, and filter buildup rate, if any, will be assumed to be constant in this study.
General mass balance equation says, what goes in must come out. The carbon balance aims to find the yield of carbon in different forms of products. Carbon goes into the reactor as a solid fuel. It can come out in any of the four forms, namely, gas, tar, char, & filter collect. Which gives us the overall equation:
𝐶𝑎𝑟𝑏𝑜𝑛 𝐶𝑜𝑛𝑣𝑒𝑟𝑠𝑖𝑜𝑛 𝐸𝑓𝑓𝑖𝑐𝑖𝑒𝑛𝑐𝑦, 𝐶𝐶𝑆 [%] =𝑚𝐶,𝑔𝑎𝑠+ 𝑚𝐶,𝑡𝑎𝑟+ 𝑚𝐶,𝑐ℎ𝑎𝑟+𝑓𝑖𝑙𝑡𝑒𝑟
𝑚𝐶,𝑓𝑢𝑒𝑙 (2)
Where, 𝑚𝐶,𝑓𝑢𝑒𝑙 is the amount of carbon in fuel given by
𝑚𝐶,𝑓𝑢𝑒𝑙[
𝑘𝑔 ℎ ] =
𝑡𝑜𝑡𝑎𝑙 𝑚𝑓𝑢𝑒𝑙,𝑑𝑟𝑦
𝑡𝑜𝑡𝑎𝑙 𝑓𝑒𝑒𝑑𝑖𝑛𝑔 𝑡𝑖𝑚𝑒∙ 𝐶𝑎𝑟𝑏𝑜𝑛 𝑓𝑟𝑎𝑐𝑡𝑖𝑜𝑛 𝑜𝑓 𝑡ℎ𝑒 𝑏𝑖𝑜𝑚𝑎𝑠𝑠 (3)
𝑚𝐶,𝑔𝑎𝑠 is the amount of carbon in produced gas; it is calculated from μGC analysis and the
22
taken from the logged data for that analysis period. Using this and the volume fraction of each
of the product gas (φgas,i) we can determine the volumetric flow of individual components
(𝑉̇𝑔𝑎𝑠,𝑖) using 𝑉̇𝑔𝑎𝑠,𝑖[ 𝐿 ℎ] = φgas,i∙ 𝑉̇𝑝𝑟𝑜𝑑 𝑔𝑎𝑠[ 𝐿 𝑚𝑖𝑛∙ 60 𝑚𝑖𝑛 1 ℎ ] (4)
Once we have 𝑉̇𝑔𝑎𝑠,𝑖, we can easily calculate the molar flow rate using Avogadro’s Law. Since
all the measurements are in NTP, we simply divide each 𝑉̇𝑔𝑎𝑠,𝑖 by 22.4 𝐿 ∙ 𝑚𝑜𝑙−1 to get the
molar flow rate. From the individual molar flow rates, we can calculate the mass flow rate by multiplying it by the no. of carbon atom each individual component has, 𝐶𝑖, and finally,
multiply it by the molecular weight of carbon to get the results.
𝑚𝐶,𝑔𝑎𝑠[ 𝑘𝑔 ℎ] = 12 [ 𝑘𝑔 1000 𝑚𝑜𝑙] ∙ ∑ ( 𝑉̇𝑔𝑎𝑠,𝑖 22.4 [ 𝑚𝑜𝑙 ℎ ] ∙ 𝐶𝑖) (5)
𝑚𝐶,𝑡𝑎𝑟 is the amount of carbon in the tar. From the SPA analysis, we know the quantity of individual tar per unit volume of produced gas, 𝑚𝑡𝑎𝑟𝑖. Multiplying it by the total volume of
produced gas, 𝑉̇𝑝𝑟𝑜𝑑 𝑔𝑎𝑠, we get the quantity of each tar produced per unit time. On these by
their own molecular weight, we can find the molar rate of production of these individual tars. Finally, if we multiply them by the no. of carbon atoms each individual tar has, we will obtain the molar rate of production of carbon from every single tar component. On adding them up and multiplying my molecular weight of carbon, we can get the amount of carbon in tar.
𝑚𝐶,𝑡𝑎𝑟[ 𝑘𝑔 ℎ ] = 12 [ 𝑘𝑔 103 𝑚𝑜𝑙] ∙ ∑ ( 𝑚𝑡𝑎𝑟𝑖[10𝜇𝑔2 𝑚𝐿∙1000 𝑚𝐿1 𝐿 ∙ 10−6𝑔 1𝜇𝑔 ] ∙ 𝑉̇𝑝𝑟𝑜𝑑 𝑔𝑎𝑠[𝑚𝑖𝑛 ∙𝐿 60 𝑚𝑖𝑛1 ℎ ] 𝑀𝑡𝑎𝑟,𝑖[𝑚𝑜𝑙]𝑔 ∙ 𝐶𝑖) (6)
Finally, 𝑚𝐶,𝑐ℎ𝑎𝑟+𝑓𝑖𝑙𝑡𝑒𝑟refers to the mass of carbon in char and filter collect. Since we assume
that its rate of production is constant, we define it as
𝑚𝐶,𝑐ℎ𝑎𝑟+𝑓𝑖𝑙𝑡𝑒𝑟[ 𝑘𝑔 ℎ] = 𝑡𝑜𝑡𝑎𝑙 𝑚𝑐ℎ𝑎𝑟+ 𝑡𝑜𝑡𝑎𝑙 𝑚𝑓𝑖𝑙𝑡𝑒𝑟 𝑡𝑜𝑡𝑎𝑙 𝑓𝑒𝑒𝑑𝑖𝑛𝑔 𝑡𝑖𝑚𝑒 (7) Tar Production
There are two popular ways of reporting tar. Firstly, it is reporting in terms of mass of tar per unit volume of produced gas. Secondly, is reporting in terms of the mass of tar per unit mass of dry fuel. Therefore, the total tar production is calculated as:
𝑚𝑡𝑎𝑟𝑡𝑜𝑡[ 𝜇𝑔 𝐿] = ∑ 𝑚𝑡𝑎𝑟𝑖[ 𝜇𝑔 100 𝑚𝐿∙ 1000 𝑚𝐿 1 𝐿 ] (8) 𝑚̇𝑡𝑎𝑟𝑖[ 𝑔 𝑘𝑔 𝑓𝑢𝑒𝑙𝑑𝑟𝑦] = 𝑚𝑡𝑎𝑟𝑡𝑜𝑡[ 𝜇𝑔 𝐿 ∙ 1𝑔 106𝜇𝑔] ∙ 𝑉̇𝑝𝑟𝑜𝑑 𝑔𝑎𝑠[ 𝐿 𝑚𝑖𝑛∙ 60 𝑚𝑖𝑛 1 ℎ ] ∙ 𝑚̇𝑓𝑢𝑒𝑙𝑑𝑟𝑦[ 𝑘𝑔 ℎ] (9)
Where, 𝑚𝑡𝑎𝑟𝑡𝑜𝑡 is the total tar produced, reported as
𝜇𝑔
𝐿, 𝑚𝑡𝑎𝑟𝑖 is the mas of individual tar components reported after the tests, 𝑚̇𝑡𝑎𝑟𝑖 is the total mass of tar produced reported in
23
𝑔
𝑘𝑔 𝑓𝑢𝑒𝑙𝑑𝑟𝑦 , 𝑉̇𝑝𝑟𝑜𝑑 𝑔𝑎𝑠 is the total produced gas (including nitrogen), and 𝑚̇𝑓𝑢𝑒𝑙𝑑𝑟𝑦is the dry fuel
feeding rate.
Gas Yield
The most common unit for reporting this is 𝑘𝑔 𝑓𝑢𝑒𝑙𝑁𝑚3
𝑑𝑟𝑦. So, using the μGC results, we can simply
multiply the vol-% of each gas (except nitrogen) to the total produced gas and then divide the same by the dry fuel feeding rate.
𝐺𝑎𝑠 𝑌𝑖𝑒𝑙𝑑 [ 𝑁𝑚 3 𝑘𝑔 𝑓𝑢𝑒𝑙𝑑𝑟𝑦 ] = ∑ φgas,i∙ 𝑉̇𝑝𝑟𝑜𝑑 𝑔𝑎𝑠 [𝑚𝑖𝑛 ∙𝐿 1 𝑁𝑚 3 1000 𝐿] 𝑚̇𝑓𝑢𝑒𝑙𝑑𝑟𝑦[ 𝑘𝑔 ℎ ∙ 1 ℎ 60 𝑚𝑖𝑛] (10)
24
4.
Results and discussion
In total, eight tests were performed, as summarized in Table 4, where all the tests are listed, including the failed and unsuccessful ones.
Table 4 Summary of all tests run
During test 1, we realized that the existing gas supply was not sufficient for delivering the required flow rate of nitrogen in the feeder during the operation. The gas supply was upgraded, and test 2 and test 3 were completed successfully. Test 4 and 5 failed because the reactor could not be fed. Test 6 failed due to the failure of the oxygen gas flow meter during the heat-up phase. Test 7 was able to run for some time, but the stable operating conditions were never reached because of ash sintering and agglomeration of the bed materials caused due to the high ash content of Grot. Finally, test 8 was run using birch as fuel. However, the produced gas composition could not be accurately analyzed due to unconditioned gas analyzer. The results of the tests 2, 3, and 8 are discussed in detail.
The feed, operating condition, and key process parameters of the experiments are summarized in Table 5.
Table 5 Summary of operating conditions and key process parameters
Test 2 Test 3 Test 8
Bed Material Olivine Magnesite Silica Sand
Fuel Grot Grot Birch
Feeding Rate (dry)
[kg/h] 2.27 4.32 2.41 4.96
Gasifying Agent Oxygen/Steam Oxygen/Steam Oxygen/Steam Oxygen/Steam
Bed Temperature [°C] 830 819 854 827 Pressure [bar] 19.78 19.86 19.45 19.60 Steam Feed [kg/h] 6.55 6.17 7.08 4.96 Oxygen Feed [L/min] 16.3 17.0 10 24.3 Nitrogen Feed (reactor) [L/min] 128.2 118.58 74.4 104.8 Nitrogen Feed (Feeder) [L/min] 119.9 119.64 116.6 143.7
Test 1 Test 2 Test 3 Test 4 Test 5 Test 6 Test 7 Test 8
Fuel Grot Grot Grot Grot Grot Grot Grot Birch
Bed
Material Olivine Olivine Magnesite Silica Silica Silica Silica Silica
Out-come Failed Success Success Failed Failed Failed Failed Unsuccessful
Note Feeder under-pressure - - Feeding issue Feeding issue Gas flow-meter failure Ash melting Un-conditioned μGC, unreliable reading
25 Steam to Biomass (dry) Ratio 2.88 1.43 2.93 1.39 Equivalence Ratio (λ) 0.44 0.24 0.25 0.31 Collection of Char + Filter [g] 0 0 132 22
Total Gas Produced (including N2) [L/min] 282.32 301.76 232.35 314.00 Gas Produced (N2 -free) [Nm3/kg dry fuel] 0.86 0.59 0.90 -
Tar Produced (sum aromatics) [µg/100mL gas] 580 893 572 683 Tar Produced [g/kg dry fuel] 43.22 37.39 33.05 26.17 Carbon Conversion Efficiency [%] 84.43 58.57 85.67 -
Test 2
Figure 13 Olivine, before(left) and after(right) gasification
Olivine shows a remarkable change in appearance after the test, as shown in Figure 13. This is due to the presence of segregated iron at the particle surface. At the operating temperature, olivine gets calcined, and a part of the iron from the olivine structure moves from the crystal structure to the surface of the particle as Fe(III). The MgO and Fe2O3 content
of the olivine imparts the tar reducing properties. [35] As reported in literature, olivine showed great resistance to attrition and agglomeration, due to the low tendencies of forming low melting binary and ternary mixtures. [33] As can be seen in Figure 13, the olivine particles size remained the same, they neither reduced nor grew in size, after gasification.
26
The overall test was run for a period of 108 minutes, and the carbon balance was done over two windows of the operation period, lasting 15 minutes each. Figure 14 and Figure 15 show the N2 free gas composition and the overall reactor temperature profile respectively. During
the first stable operating period, the dry fuel feeding rate was 2.27 kg/h, oxygen and steam feeding rate were 16.3 L/min and 6.55 kg/h, respectively. During this period, the bed temperature was 830°C, and the pressure was 19.78 bar. The fuel feeding rate was then increased to 4.32 kg/h during the second period, and the oxygen and steam feeding rate were changed to 17.00 L/min and 6.17kg/h, respectively. The observed average bed temperature was 819°C, and the reactor pressure was 19.86 bar.
The gasification performance for these two periods are quite different. Steam to Fuel (dry) ratio for both the periods were 2.88 and 1.43, respectively. The Equivalence Ratio (𝜆) changed from 0.44 in the first period to 0.24 in period two. In period one, the total gas production (N2
free) was 0.86 Nm3/kg dry fuel, and the total tar production was 43.22 g/kg dry fuel. For
period two, the total gas production was 0.59 Nm3/kg dry fuel, and the total tar production
was 37.39 g/kg dry fuel. The reduction in quantity of total gas produced with reduction in 𝜆 is in line with the observation in other studies. [7] [24] However, the reduction in quantity of tar produced with reduction in 𝜆 is quite unexpected. This needs to be further investigated in future tests to understand the reaction mechanisms responsible for this anomaly. Period one and period two had an overall carbon conversion efficiency of 84.4% and 58.6%, respectively. The lower carbon conversion efficiency can be explained by lower gas and tar production.
Test 3
In the case of the magnesite bed material, the change in appearance was not as striking as for olivine. As seen in Figure 16, after gasification, it looks slightly darker and polished. Not much difference in particle size was observed. Thus, magnesite, too, offered resistance to attrition
500 600 700 800 900 1000 1100 15:36 16:04 16:33 17:02 Te m p era tu re [ °C] Time TC 9 TC 8 TC 7 TC 6 TC 5 TC 4 TC 3 TC 2 TC 1 Stable Operation Period 0 10 20 30 40 50 60 70 15 :2 9 15 :3 9 15 :4 9 15 :5 9 16 :0 9 16 :1 9 16 :2 9 16 :3 9 16 :49 16 :5 9 17 :0 9 17 :1 9 17 :2 9 Gas % Time CO2 CO H2 CH4 Stable Operation Period
Figure 15 Reactor temperature profile of the olivine test Figure 14 Produced gas composition (N2 free) of olivine test
27
and agglomeration as expected. [34] The Ca- and Mg- content of magnesite was able to provide with a good resistance to agglomeration even at 20 bar pressure.
Figure 16 Magnesite, before(left) and after(right) gasification
The overall test was run for a period of 120 minutes, and the carbon balance was done over a stable operation period of 25 minutes. Figure 17 and Figure 18 show the N2 free gas
composition and the overall reactor temperature profile respectively. During this period, the average bed temperature was 854 °C, and the average pressure was 19.45 bar. Dry fuel feeding rate was 2.41 kg/h. Oxygen and steam feeding rates were 10 L/min and 7.08 kg/h, respectively. This gives us a Steam to Fuel (dry) ratio of 2.93 and Equivalence Ratio of 0.25. Total gas production (N2 free) was 0.90 Nm3/kg dry fuel, and the total tar production was
33.05 g/kg dry fuel. This gives us a total carbon conversion efficiency of 85.67%. It is very
400 500 600 700 800 900 1000 1100 18:52 19:21 19:50 20:18 20:47 Te m p era tu re [ °C] Time TC 9 TC 8 TC 7 TC 6 TC 5 TC 4 TC 3 TC 2 TC 1 Stable Operation Period 0 10 20 30 40 50 60 18 :4 7 18 :5 7 19 :0 7 19 :1 8 19 :28 19 :3 8 19 :4 8 19 :5 8 20 :0 8 20 :1 8 20 :2 8 20 :38 20 :4 8 Gas % Time CO2 CO H2 CH4 Stable Operation Period
Figure 18 Reactor temperature profile of magnesite test Figure 17 Produced gas composition (N2 free) of magnesite test
28
interesting to note that even with 𝜆 = 0.25, more gas with a lower tar content was produced in this test, compared to test 2.
Test 8
After the failure of test 7, the bed material from was observed, and ash calculation was done to conclude that grot is incompatible with silica sand. This test was then attempted with low ash birch, to demonstrate the operation at 20 bars. Unlike olivine and magnesite, at first glance, it is difficult to notice any change in silica sand before and after gasification. However, a closer visual inspection in Figure 19, reveals that some of the particles got bigger in size after
gasification. Even though the ash content of birch was 46% lower and the K2O content in ash
was 35% lower than grot, it was enough to result in agglomeration. These particles appear to grow by melt induced direct adhesion, where two or more particles got glued together due to the sticky bridge formation by the liquid phase. [32] Thus, in spite of having much lower ash content than grot, very mild form of agglomeration could still be observed using birch as a fuel. Conclusively, the use of silica sand together with the grot as a feedstock cannot be recommended due to expected high costs when frequently changing bed material during operation.
29
Figure 20 Reactor temperature profile of silica sand test
The overall test was run for a period of 65 minutes, and the operation was fairly smooth for a major part of the run, compared to previous tests with silica sand. It would have been very interesting to compare the experimental data with test 2 and test 3. However, the μGC used during the experiment was unconditioned, and therefore, the gas composition data recorded during the experiment is not reliable. Thus, the recorded data is discarded, and no reporting on gas composition is done for this test. Figure 20 shows the overall reactor temperature profile. During a stable operating period of 20 minutes, the average bed temperature was 827°C, and the average pressure was 19.6 bar. Dry fuel feeding rate was 4.96 kg/h, which is much higher than the feeding rates in test 2 and test 3, which used grot as fuel feed. This can be attributed to the smoother surface of birch, which makes it easier to flow out of the feeder under pressurized condition. Oxygen and steam feeding rates were 24.3 L/min and 6.90 kg/h, respectively. This gives us a Steam to Fuel (dry) ratio of 1.39 and Equivalence Ratio of 0.31. Total tar production was 26.17 g/kg dry fuel. The relatively lower tar production compared to test 2 and test 3, is because of the use of different fuels. Birch has lower volatile matter and higher fixed carbon compared to grot, as reported in Table 3. Therefore, it would be wrong to conclude that silica sand has best tar reducing properties at higher pressure.
Gas Composition
In the gas analysis, the primary focus was on CO2, CO, H2, and CH4 concentration because
these four gases make up over 95% of the N2 free produced gas.
Figure 21 Nitrogen free gas compositions for the 20 bar tests 400 500 600 700 800 900 1000 1100 1200 17:22 17:36 17:51 18:05 18:19 18:34 Te m p era tu re [ °C ] Time TC 9 TC 8 TC 7 TC 6 TC 5 TC 4 TC 3 TC 2 TC 1 0% 10% 20% 30% 40% 50%
Olivine - i Olivine - ii Magnesite


![Figure 9 Simplified sketch of the reactor showing the dimensions in [mm] (left) and the position of thermocouples and pressure pipes (right)](https://thumb-eu.123doks.com/thumbv2/5dokorg/4645321.120535/25.892.197.717.209.575/figure-simplified-reactor-showing-dimensions-position-thermocouples-pressure.webp)
