Postprint
This is the accepted version of a paper published in Acta Paediatrica. This paper has been peer-reviewed but does not include the final publisher proof-corrections or journal pagination.
Citation for the original published paper (version of record): Eriksson, M., Lingfors, H., Golsäter, M. (2018)
Trends in prevalence of thinness, overweight and obesity among Swedish children and adolescents between 2004 and 2015.
Acta Paediatrica, 107(10): 1818-1825 https://doi.org/10.1111/apa.14356
Access to the published version may require subscription. N.B. When citing this work, cite the original published paper.
Permanent link to this version:
1
Trends in prevalence of thinness, overweight and obesity among
Swedish children and adolescents between 2004 and 2015
Short running title: Swedish child weight trends 2004-2015
Eriksson Marit1, Lingfors Hans1 and Golsäter Marie1,2
1. Futurum, Region Jönköping County and Department of Medical and Health Sciences, Linköping University, Sweden
2. CHILD-research group, Department of Nursing Science, School of Health and Welfare, Jönköping University, Sweden
Corresponding author: Marit Eriksson, Futurum, Region Jönköping County, Box 1024, 551 11 Jönköping, Sweden, tel. +46722024207, marit.eriksson@rjl.se
2
ABSTRACT Aim
This study explored weight trends among children aged four, seven, 11, 14 and 17 years in Jönköping County Sweden, from 2004-2015.
Methods
The study had a repeated cross-sectional design and body mass index was calculated based on height and weight measurements collected from child health and school health records. The prevalence of thinness, overweight and obesity were estimated with international cut-offs, with linear trends calculated separately for boys and girls.
Results
There were 190,965 measurements of body mass index and these covered 82-97% of the younger children and 55-69% of the older children during the study period. The prevalence of thinness varied between 0.2% and 2.2% across time and age groups and did not change over the study period. There was a small decrease in overweight among both girls and boys aged four years. There were increasing trends in overweight and obesity in both girls and boys aged 11 and 14 years of age and a sharp increase among 17-year-old boys, with 7.3% obese in 2014/2015 and 3.6% in 2004/2005.
Conclusion
The prevalence of obesity decreased from 2004-2015 or was stable in younger Swedish children, but increased among older children, with a large increase in adolescent boys.
Key words
3
Key notes
• We used body mass index measurements to explore weight trends among children aged four, seven, 11, 14 and 17 years in Jönköping County Sweden.
• The prevalence of obesity decreased or was stable in younger Swedish children from 2004-2015, but increased among older children, with a large increase in adolescent boys.
• Meanwhile, the prevalence of thinness was low in all age groups and did not change during the study period.
Abbreviations
BMI - body mass index
INTRODUCTION
Childhood overweight and obesity continuously increased during the 1980s and 1990s (1-3), but several studies worldwide have reported that the increase levelled off and reached a plateau during the last decade (4-6). Surveys indicated the same development among Swedish 7-12 year old children (7-9). However, an English study reported that the
prevalence was stabilising among children aged 2-10, but still increasing among those aged 11-15 (10). Since childhood obesity often tracks into adulthood (11), followed by an increased risk of diseases such as diabetes type 2, cardiovascular disease and cancer (12-14), it is important to continuously monitoring the prevalence of obesity among children and adolescents.
4
Trends in the prevalence of thinness among children and adolescents have seldom been reported, but one study of worldwide trends did report a decrease in moderate and severe underweight in children of 5-19 years of age, with large regional differences (6). In the Netherlands the prevalence of thinness grade 1 and grade 2, according to Cole et al (15), decreased among children aged 2-18 years between 1980 and 2009 (16). However, Hardy et al (2012) did not find any trends in the prevalence of thinness grade 2 among Australian children and adolescents from the mid 1980s to 2010 (17). Data from the United States and 10 European countries from the multi-national Health Behaviour in School-aged Children Study showed an overall decline in thinness among 11, 13 and 15 year-olds between the survey years of 1998, 2002 and 2006, but with national differences (18).
Trends in the prevalence of thinness, overweight and obesity in both preschool, school-aged children and adolescents during the last decade, using yearly measurements for all age groups, have not, to our knowledge, been reported previously. The aim of the present study was to explore the trends in thinness, overweight and obesity in Swedish children aged four, seven, 11, 14 and 17 years between 2004 and 2015.
MATERIAL AND METHODS Study population
In Sweden all children are regularly invited to health visits run by child health or school health services. These health visits are performed according to the national health
monitoring programme and include measurements of height and weight. The present study used all height and weight data measured between 2004 and 2014 for four-year-olds and between the academic years 2004/2005 and 2014/2015 for children aged seven, 11, 14 and 17, in Jönköping County, Sweden. The number of children per age group and year of
5
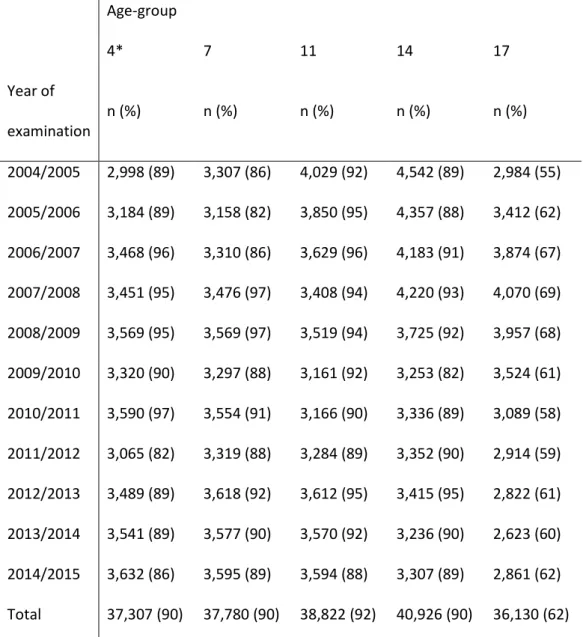
The participation rates were estimated using the total number of children in the age group according to the Swedish National Agency for Education for the seven, 11, 14 and 17-year-olds and the child health centres in Jönköping County for the four-year-17-year-olds. The figures for the respective study years are presented in Table 1. In the oldest age group, the
participation rates varied between 55% and 69% over the study period and in the younger age groups between 82% and 97% of the eligible children participated. In total, there were 190,965 measurements of BMI included in the analyses.
Measurements
Height, weight, sex, date of measurement and date of birth were collected from child healthcare and school healthcare records. Height was measured without shoes to the nearest 0.5cm in the four-year-old children and to the nearest centimetre in all other age groups. Weight was measured in light clothing without shoes to the nearest 100g at all ages.
Statistical analysis
Body mass index (BMI), measured as weight in kilograms divided by height in metres squared, was calculated and the prevalence of overweight and obesity was estimated using the cut-offs recommended by the International Obesity Task Force (19), corresponding to an adult BMI of ≥25 for overweight and a BMI of ≥30 for obesity. The prevalence of thinness was estimated using the cut-offs for thinness grade 2 as recommended for international comparisons by Cole et al (15), corresponding to an adult BMI of <17. The data were
checked for outliers and children with extreme BMI values in each age group were excluded from the analyses. The analyses were performed for girls and boys separately. Chi-square tests were used to test for linear trends in the prevalence of thinness, overweight and obesity over the study period and for differences between boys and girls. P<0.05 was used
6
for statistical significance. All analyses were performed using SPSS, version 22.0 (IBM Corp, New York, USA).
Ethical considerations
The study was approved by the regional research ethic committee in Linköping, Sweden (Dnr: 2015/431-31).
RESULTS
There were 190,965 measurements of body mass index included in the analyses and the breakdown by age and study period is shown in Table 1. The number of children in each age group ranged from 36,130 to 40,926. The mean ages for the participating children were 4.0 (standard deviation ±0.1), 6.6 (±0.3), 10.5 (±0.3), 13.9 (±0.6) and 16.6 (±0.4) years in the respective age groups. There were no differences in mean age between boys and girls or between the study years. Supplementary information on mean height, weight and BMI per sex and age group and study period are available in Tables S1 and S2.
Tables 2-6 present the prevalence of thinness, overweight and obesity among boys and girls in the respective age groups.
Thinness
There were small differences in the prevalence of thinness over the study period among both boys and girls in all age groups. The prevalence varied between 0.7% and 1.8% in both four and seven-year-olds (Tables 2 and 3), 0.2% and 1.6% among children aged 11 (Table 4), 0.5% and 2.2% in 14-year-olds (Table 5) and between 0.7% and 1.8% in 17-year-olds (Table 6). There was only a small, but significant, increasing trend in four-year-old boys. Analysing all the study years together demonstrated that there were small, but statistically significant, differences in the prevalence of thinness between girls and boys in all age groups, except
7
four-year-olds, with slightly higher prevalence among girls. Looking at the separate study years, there were only significant differences in a few years and the differences only occurred among children aged four, seven and 17.
Overweight including obesity
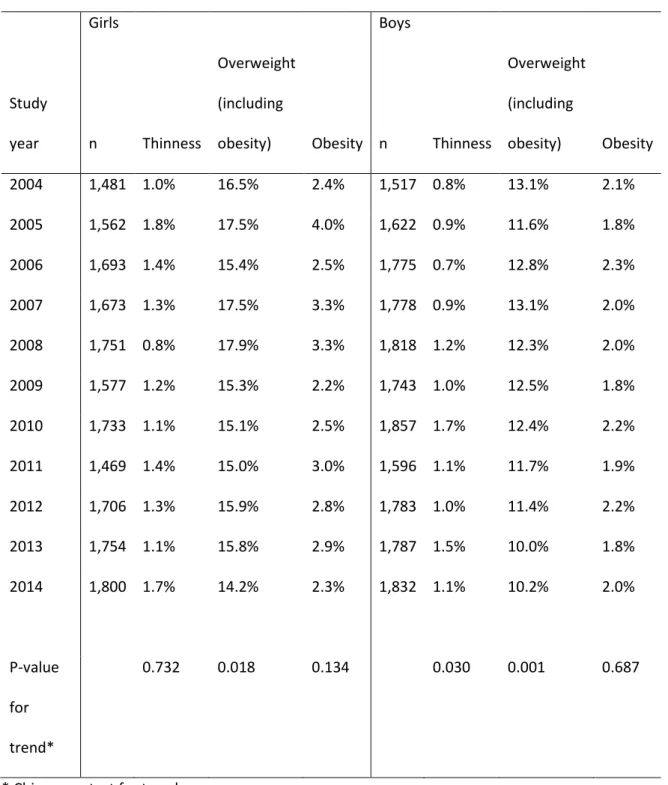
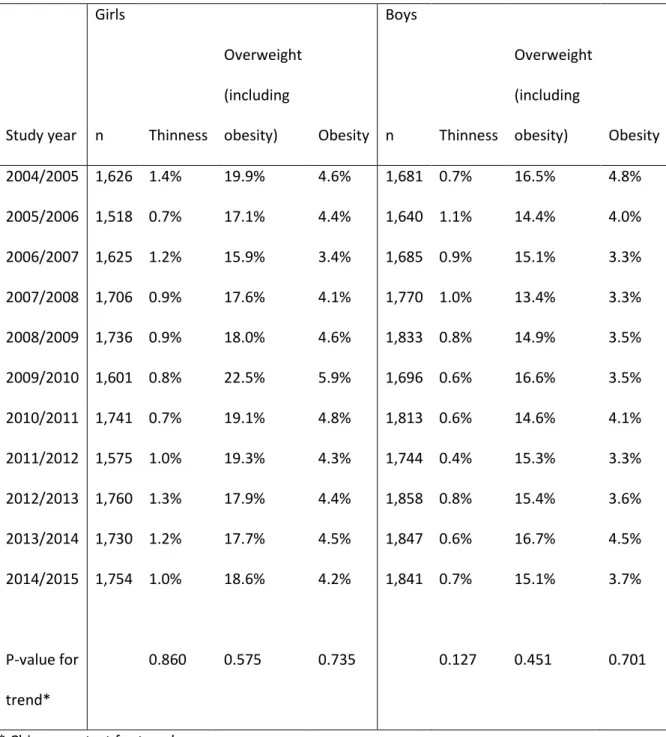
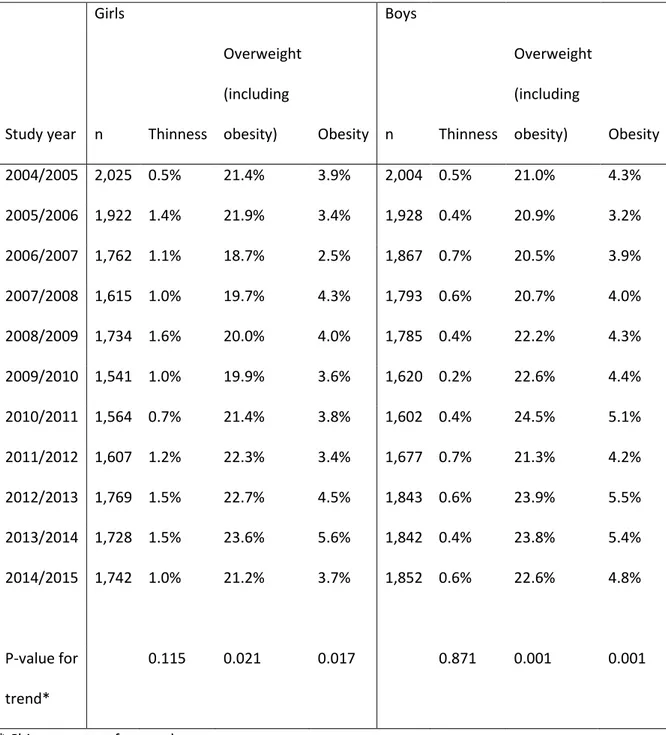
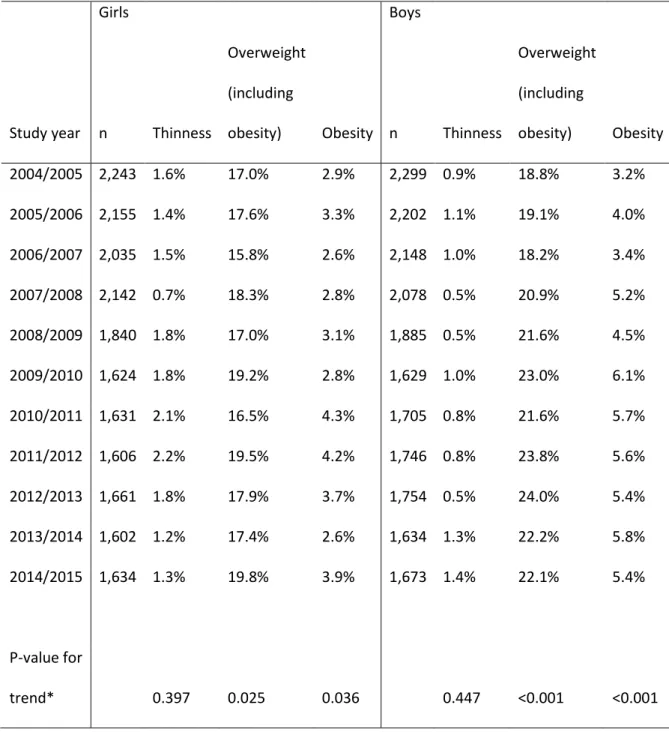
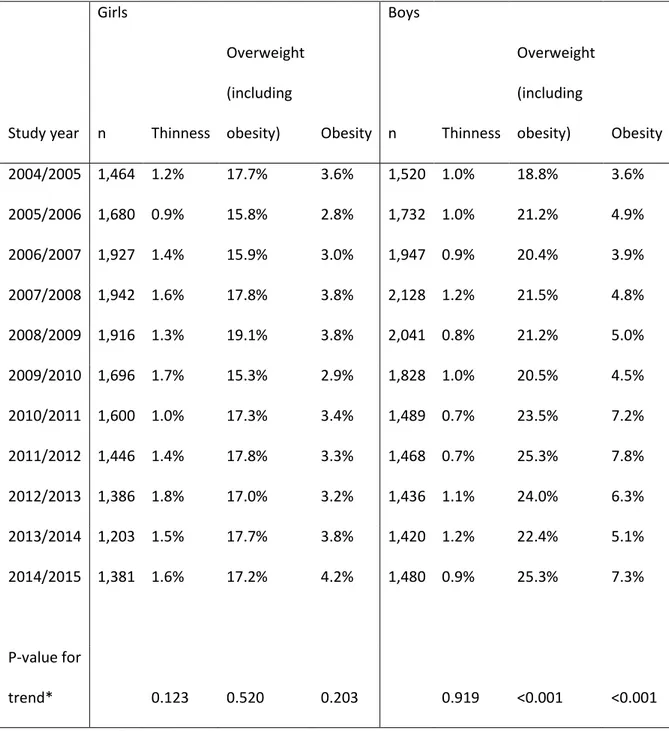
Trends in the prevalence of overweight and obesity are presented in Tables 2-6 and Figures 1-2. There were variations in the prevalence of overweight, including obesity, across the study period in all age groups and both sexes. In the four-year-old children the prevalence varied from 14.2% to 17.5% in girls and from 10.0% to 13.1% in boys (Table 2 and Figure S1). There was a small, statistically significant, decrease in the prevalence of overweight among both girls and boys. There was no trend in the seven-year-old children and the prevalence of overweight varied from 15.9% to 22.5% in girls and from 13.4% to 16.7% in boys across the study period (Table 3 and Figure S2). In the children who were aged 11 and 14, there were increasing trends in the prevalence of overweight among both girls and boys. The increase was larger among boys and 14-year-olds. The prevalence in the 11-year-olds varied between 18.7% and 23.6% in girls and between 20.5% and 24.5% in boys (Table 4 and Figure S3). The corresponding numbers in the 14-year-olds were between 15.8% and 19.8% in girls and between 18.2% and 24.2% in boys (Table 5 and Figure 1). There were no significant trends in the prevalence of overweight among the 17-year-old girls, but there was quite a large increasing trend among boys, particularly during the last five years of the study period (Table 6 and Figure 2). The prevalence of overweight varied from 15.3% to 17.8% in girls and from 18.8% to 25.3% in boys.
There were significant differences in the overall prevalence of overweight between girls and boys in all age groups, with a higher prevalence among the four-year-old girls (16.0% versus 11.9%) and seven-year-old girls (18.5% versus 15.3%) and a higher prevalence among 11-year-old boys (22.1% versus 21.2%), 14-year-old boys (21.2% versus 17.7%) and
8
17-year-old boys (22.0% versus 17.1%). When we examined the study years separately, there were significant differences between girls and boys in most of the study years in all age groups, except for the 11-year-olds. The study also showed that the prevalence of overweight increased with age up to the age of 11 and then there were only minor changes. However, when we only examined the total for the last five study years, the prevalence continued to increase to the age of 14 in girls and to the age of 17 in boys, which emphasise the increase in the prevalence of overweight and obesity among adolescents in the last five years of the study.
Obesity
When we examined obesity on its own, no trends were observed in the prevalence among the four and seven-year-old children (Tables 2 and 3 and Figures S1 and S2). The prevalence of obesity varied between 2.2% and 4.0% in the four-year-old girls and between 1.8% and 2.3% in the four-year-old boys across the study period. The corresponding figures for the seven-year-olds were 3.4%-5.9% in girls and 3.3%-4.8% in boys. In children aged 11 and 14, there were small, increasing trends in the prevalence of obesity for both girls and boys (Tables 4 and 5 and Figures 1 and S3). The increase was larger for boys among the 14-year-olds. The prevalence varied from 2.5% to 5.6% in 11-year-old girls and from 3.2% to 5.5% in boys throughout the study period. The corresponding figures for the 14-year-olds were 2.6% to 4.3% for girls and 3.2% to 6.1% for boys. There was no significant trend among the 17-year-old girls, but there was a large increasing trend in the prevalence of obesity in the 17-year-old boys, which predominantly occurred in the last five years of the study period (Table 6 and Figure 2). The prevalence of obesity varied between 2.8% and 4.2% in the 17-year-old girls and between 3.6% and 7.8% in the boys.
There were significant differences in the overall prevalence of obesity between girls and boys in all age groups, with higher prevalence among the girls in the four-year-old (2.8%
9
versus 2.0%) and seven-year-old children (4.5 versus 3.8%) and a higher prevalence among the boys in 11-year-old children (4.5% versus 3.9%), 14-year-old (4.8% versus 3.3%) and 17-year-old adolescents (5.4% versus 3.4%). Examining the study years separately, there were only significant differences in a few years in the three youngest age groups, while there were differences in around half of the study years in the adolescent groups.
DISCUSSION
This study examined trends in thinness, overweight and obesity in children and adolescents in a Swedish county during the last decade. There was an alarming increase in the
prevalence of overweight and obesity among the adolescent boys, while there were minor or no changes in the younger children and the adolescent girls. The prevalence of thinness grade 2 was low in all age groups and there were not any time trends except for a small increasing trend in four-year-old boys.
An Australian study showed similar results, with a low prevalence of thinness grade 2 and no trends among six to 17-year-olds for the period 1997-2010 (17). In the Health Behaviour in School-aged Children study, which covered the USA and 10 European countries from 1998-2006, thinness was estimated based on self-reported height and weight in 11, 13 and 15-year-old children and adolescents. There was a higher prevalence of thinness grade 2 among girls, between 2.6% and 3.3% in 2006, compared with the present study (18). This could have been an effect of self-reported data, which has been shown to overestimate the prevalence of thinness in this age group (20). There were not any significant changes in the prevalence of thinness in the Health Behaviour in School-aged Children study between 1998 and 2006 (18).
The youngest children in the present study did not show increases in the prevalence of overweight and obesity over the study period, which agrees with the findings of previous studies (5,10,21). Ogden et al (2016) showed that the prevalence of obesity declined among
10
two to five-year-old American children between 2003-2004 and 2013-2014, after having increased the previous decade (21). In a review of data from nine countries, published in 2011, Olds et al concluded that the prevalence of overweight and obesity plateaued or even declined in children aged two to 11 between 1995 and 2008, while it continued to increase in adolescents (5). An English study of primary care patients also reported that the
prevalence of both overweight and obesity plateaued in children aged two to 10 between 2004 and 2013, while there was a continuing, but smaller, increase in 11 to 15-year-olds (10). This was consistent with the present study, which showed increasing trends in the 11, 14 and 17-year-olds, especially among the oldest boys. A study published by Lissner et al in 2013 reported similar results when they compared two cohorts of Swedish 19-year-old adolescents born in 1974 and 1990, respectively. There was no difference in the BMI Z-scores between the girls, but the Z-Z-scores increased between the boys in the two cohorts (22). The increase in the prevalence of overweight and obesity among the 17-year-old boys noted in our study are of concern. A large study published in 2016 showed an increased risk of cardiovascular death in adulthood in individuals who had a high BMI at the age of 17 (12) and it has been established that overweight and obesity are tracking into adulthood with increased risks of other diseases and a lower quality of life (11,14).
An interesting finding in the present study was that the prevalence of overweight and obesity was constantly higher among the girls than the boys in the two youngest age groups, at the same level in the 11-year-olds and higher among the boys in the two oldest age groups of 14 and 17. In the children aged four and seven, the differences were mostly due to differences in the overweight category, namely a BMI equivalent to an adult BMI of 25-29.9. A Finnish study showed the same pattern, with a higher prevalence of overweight and obesity in girls aged five and a similar or higher prevalence in 12-year-old boys (23). Similar results were reported for younger children by other studies that used the
11
For example, studies that used the definition of the Centers for Disease Control and Prevention, were more likely to find a higher prevalence of overweight and obesity in boys of all ages (26,27). This raises the question about the validity of the cut-offs for classifying overweight, obesity and thinness in children of different ages and in different populations. A Swedish study found quite large differences in the prevalence of overweight and obesity in 10-year-old children when it compared three classification systems. It reported that the International Obesity Task cut-offs generated the lowest prevalence and thus the most conservative results (29). Altogether, this implies the need for further research and a widely accepted reference for international comparisons of childhood obesity.
A strength of the present study was that it was based on height and weight measured by child healthcare and school healthcare nurses, which decreased the risk of misclassification of thinness, overweight and obesity. Self-reported height and weight have been shown to underestimate BMI (20). Another strength was the high participation rate, which was probably due to the fact that the measurements of height and weight formed part of the national health monitoring programme attended by most children. An additional strength was the yearly measurements over the entire study period. This decreased the risk that the results were due to cohort effects, which would have been a risk, considering that the prevalence of overweight and obesity fluctuated considerably between the study years in the present study.
A limitation of the present study was that health visits were not as frequently attended by the 17-year-old adolescents as the younger subjects, which explains the lower participation rate in this age group. Caution is advised when interpreting the results in this age group, as there is a risk that the prevalence of thinness, overweight and obesity could be both underestimated and overestimated. It could be that adolescent who were thin or carrying excess weight attended the health visits to a greater or lesser extent than their normal
12
weight peers, due to the need for extra health support or fears about the risk of
stigmatisation. Another limitation was that we could not assess the accuracy of the height and weight scales that were used. According to the child healthcare and school healthcare manuals they should be calibrated regularly, but we cannot rule out measurement errors.
The study was performed in one of the 21 counties in Sweden, which raises the question of whether the results would be applicable to the entire country. In 2016, 3.5% of Sweden’s inhabitants lived in Jönköping County and, compared with the whole country, Jönköping had lower educational levels, but fewer inhabitants with a foreign background, higher employment rates and higher life expectancy (28). Since childhood obesity is associated with low socioeconomic status (7,17), the lower educational level suggests that the prevalence would be higher in Jönköping County than in the rest of Sweden. On the contrary, the lower level of inhabitants with a foreign background, the higher employment rates and the higher life expectancy implies that childhood overweight and obesity should be lower in Jönköping County. Taking all these factors into account, the results of the present study should be valid for all Swedish children.
CONCLUSION
The prevalence of thinness grade 2 did not change during the last decade among the children in Jönköping County, Sweden. The prevalence of overweight, including obesity, decreased among four-year-olds, but increased among children aged 11, 14 and 17, with the exception of the oldest girls. The pattern was the same for just obesity. The large increase in obesity among the adolescent boys in our study is of concern and needs to be addressed.
13
1. Wang Y, Lobstein T. Worldwide trends in childhood overweight and obesity. Int J Pediatr Obes 2006; 1: 11-25.
2. Werner B, Bodin L. Obesity in Swedish schoolchildren is increasing in both prevalence and severity. J Adolesc Health 2007; 41: 536-543.
3. Petersen S, Brulin C, Bergstrom E. Increasing prevalence of overweight in young schoolchildren in Umea, Sweden, from 1986 to 2001. Acta Paediatr 2003; 92: 848-853.
4. Ng M, Fleming T, Robinson M, Thomson B, Graetz N, Margono C, et al. Global, regional, and national prevalence of overweight and obesity in children and adults during 1980-2013: a systematic analysis for the Global Burden of Disease Study 2013. Lancet 2014; 384: 766-781.
5. Olds T, Maher C, Zumin S, Peneau S, Lioret S, Castetbon K, et al. Evidence that the prevalence of childhood overweight is plateauing: data from nine countries. Int J Pediatr Obes 2011; 6: 342-360.
6. NCD Risk Factor Collaboration (NCD-RisC). Worldwide trends in body-mass index, underweight, overweight, and obesity from 1975 to 2016: a pooled analysis of 2416 population-based measurement studies in 128,9 million children, adolescents, and adults. Lancet 2017; 390: 2627–2642.
7. de Munter JS, Friedl A, Lind S, Kark M, Carlberg M, Andersson N, et al. Stability in the prevalence of Swedish children who were overweight or obese in 2003 and 2011. Acta Paediatr 2016; 105: 1173-1180.
8. Moraeus L, Lissner L, Sjoberg A. Stable prevalence of obesity in Swedish schoolchildren from 2008 to 2013 but widening socio-economic gap in girls. Acta Paediatr 2014; 103: 1277-1284.
14
9. Sjoberg A, Lissner L, Albertsson-Wikland K, Marild S. Recent anthropometric trends among Swedish school children: evidence for decreasing prevalence of overweight in girls. Acta Paediatr 2008; 97: 118-123.
10. van Jaarsveld CH, Gulliford MC. Childhood obesity trends from primary care electronic health records in England between 1994 and 2013: population-based cohort study. Arch Dis Child 2015; 100: 214-219.
11. Simmonds M, Llewellyn A, Owen CG, Woolacott N. Predicting adult obesity from childhood obesity: a systematic review and meta-analysis. Obes Rev 2016; 17: 95-107.
12. Twig G, Yaniv G, Levine H, Leiba A, Goldberger N, Derazne E, et al. Body-Mass Index in 2.3 Million Adolescents and Cardiovascular Death in Adulthood. N Engl J Med 2016; 374: 2430-2440.
13. Twig G, Tirosh A, Leiba A, Levine H, Ben-Ami Shor D, Derazne E, et al. BMI at Age 17 Years and Diabetes Mortality in Midlife: A Nationwide Cohort of 2.3 Million Adolescents. Diabetes Care 2016; 39: 1996-2003.
14. Whitlock G, Lewington S, Sherliker P, Clarke R, Emberson J, Halsey J, et al. Body-mass index and cause-specific mortality in 900 000 adults: collaborative analyses of 57
prospective studies. Lancet 2009; 373: 1083-1096.
15. Cole TJ, Flegal KM, Nicholls D, Jackson AA. Body mass index cut offs to define thinness in children and adolescents: international survey. BMJ 2007; 335: 194.
16. Schonbeck Y, van Dommelen P, HiraSing RA, van Buuren S. Thinness in the era of obesity: trends in children and adolescents in The Netherlands since 1980. Eur J Public Health 2015; 25: 268-273.
15
17. Hardy LL, Cosgrove C, King L, Venugopal K, Baur LA, Gill T. Shifting curves? Trends in thinness and obesity among Australian youth, 1985 to 2010. Pediatr Obes 2012; 7: 92-100.
18. Lazzeri G, Rossi S, Kelly C, Vereecken C, Ahluwalia N, Giacchi MV. Trends in thinness prevalence among adolescents in ten European countries and the USA (1998-2006): a cross-sectional survey. Public Health Nutr 2014; 17: 2207-2215.
19. Cole TJ, Bellizzi MC, Flegal KM, Dietz WH. Establishing a standard definition for child overweight and obesity worldwide: international survey. BMJ 2000; 320: 1240-1243.
20. Aasvee K, Rasmussen M, Kelly C, Kurvinen E, Giacchi MV, Ahluwalia N. Validity of self-reported height and weight for estimating prevalence of overweight among Estonian adolescents: the Health Behaviour in School-aged Children study. BMC Res Notes 2015; 8: 606.
21. Ogden CL, Carroll MD, Lawman HG, Fryar CD, Kruszon-Moran D, Kit BK, et al. Trends in Obesity Prevalence Among Children and Adolescents in the United States, 1988-1994 Through 2013-2014. JAMA 2016; 315: 2292-2299.
22. Lissner L, Mehlig K, Sjoberg A, Chaplin J, Niklasson A, Albertsson-Wikland K. Secular trends in weight, height and BMI in young Swedes: the 'Grow up Gothenburg' studies. Acta Paediatr 2013; 102: 314-317.
23. Vuorela N, Saha MT, Salo M. Prevalence of overweight and obesity in 5- and 12-year-old Finnish children in 1986 and 2006. Acta Paediatr 2009; 98: 507-512.
24. Ahrens W, Pigeot I, Pohlabeln H, De Henauw S, Lissner L, Molnar D, et al. Prevalence of overweight and obesity in European children below the age of 10. Int J Obes (Lond) 2014; 38 Suppl 2: S99-107.
16
25. Schmidt Morgen C, Rokholm B, Sjoberg Brixval C, Schou Andersen C, Geisler Andersen L, Rasmussen M, et al. Trends in prevalence of overweight and obesity in danish infants, children and adolescents--are we still on a plateau? PLoS One 2013; 8: e69860.
26. Ogden CL, Carroll MD, Kit BK, Flegal KM. Prevalence of obesity and trends in body mass index among US children and adolescents, 1999-2010. JAMA 2012; 307: 483-490.
27. Skinner AC, Skelton JA. Prevalence and trends in obesity and severe obesity among children in the United States, 1999-2012. JAMA Pediatr 2014; 168: 561-566.
28. Statistics Sweden. [Web page] http://www.scb.se/en/. Assessed July 17, 2017
29. Brann E, Sjöberg A, Chaplin JE, Leu M, Mehlig K, Albertsson-Wikland K, et al. Evaluating the predictive ability of childhood body mass index classification systems for overweight and obesity at 18 years. Scand J Public Health 2015; 43: 802-9.
17
Table 1. Number of participants and participation rates (%) of the total number of children in each age group, according to the Swedish National Agency for Education (seven, 11, 14 and 17 years) and the Child Health Centre in Region Jönköping County (four years).
Age-group 4* 7 11 14 17 Year of examination n (%) n (%) n (%) n (%) n (%) 2004/2005 2,998 (89) 3,307 (86) 4,029 (92) 4,542 (89) 2,984 (55) 2005/2006 3,184 (89) 3,158 (82) 3,850 (95) 4,357 (88) 3,412 (62) 2006/2007 3,468 (96) 3,310 (86) 3,629 (96) 4,183 (91) 3,874 (67) 2007/2008 3,451 (95) 3,476 (97) 3,408 (94) 4,220 (93) 4,070 (69) 2008/2009 3,569 (95) 3,569 (97) 3,519 (94) 3,725 (92) 3,957 (68) 2009/2010 3,320 (90) 3,297 (88) 3,161 (92) 3,253 (82) 3,524 (61) 2010/2011 3,590 (97) 3,554 (91) 3,166 (90) 3,336 (89) 3,089 (58) 2011/2012 3,065 (82) 3,319 (88) 3,284 (89) 3,352 (90) 2,914 (59) 2012/2013 3,489 (89) 3,618 (92) 3,612 (95) 3,415 (95) 2,822 (61) 2013/2014 3,541 (89) 3,577 (90) 3,570 (92) 3,236 (90) 2,623 (60) 2014/2015 3,632 (86) 3,595 (89) 3,594 (88) 3,307 (89) 2,861 (62) Total 37,307 (90) 37,780 (90) 38,822 (92) 40,926 (90) 36,130 (62) *Years of examination for four-year-old children were 2004, 2005, 2006, 2007, 2008, 2009, 2010, 2011, 2012, 2013 and 2014.
18
Table 2. Trends in the prevalence of thinness, overweight and obesity in four-year-old children. Girls Boys Study year n Thinness Overweight (including
obesity) Obesity n Thinness
Overweight (including obesity) Obesity 2004 1,481 1.0% 16.5% 2.4% 1,517 0.8% 13.1% 2.1% 2005 1,562 1.8% 17.5% 4.0% 1,622 0.9% 11.6% 1.8% 2006 1,693 1.4% 15.4% 2.5% 1,775 0.7% 12.8% 2.3% 2007 1,673 1.3% 17.5% 3.3% 1,778 0.9% 13.1% 2.0% 2008 1,751 0.8% 17.9% 3.3% 1,818 1.2% 12.3% 2.0% 2009 1,577 1.2% 15.3% 2.2% 1,743 1.0% 12.5% 1.8% 2010 1,733 1.1% 15.1% 2.5% 1,857 1.7% 12.4% 2.2% 2011 1,469 1.4% 15.0% 3.0% 1,596 1.1% 11.7% 1.9% 2012 1,706 1.3% 15.9% 2.8% 1,783 1.0% 11.4% 2.2% 2013 1,754 1.1% 15.8% 2.9% 1,787 1.5% 10.0% 1.8% 2014 1,800 1.7% 14.2% 2.3% 1,832 1.1% 10.2% 2.0% P-value for trend* 0.732 0.018 0.134 0.030 0.001 0.687
19
Table 3. Trends in the prevalence of thinness, overweight and obesity in seven-year-old children.
Girls Boys
Study year n Thinness
Overweight (including
obesity) Obesity n Thinness
Overweight (including obesity) Obesity 2004/2005 1,626 1.4% 19.9% 4.6% 1,681 0.7% 16.5% 4.8% 2005/2006 1,518 0.7% 17.1% 4.4% 1,640 1.1% 14.4% 4.0% 2006/2007 1,625 1.2% 15.9% 3.4% 1,685 0.9% 15.1% 3.3% 2007/2008 1,706 0.9% 17.6% 4.1% 1,770 1.0% 13.4% 3.3% 2008/2009 1,736 0.9% 18.0% 4.6% 1,833 0.8% 14.9% 3.5% 2009/2010 1,601 0.8% 22.5% 5.9% 1,696 0.6% 16.6% 3.5% 2010/2011 1,741 0.7% 19.1% 4.8% 1,813 0.6% 14.6% 4.1% 2011/2012 1,575 1.0% 19.3% 4.3% 1,744 0.4% 15.3% 3.3% 2012/2013 1,760 1.3% 17.9% 4.4% 1,858 0.8% 15.4% 3.6% 2013/2014 1,730 1.2% 17.7% 4.5% 1,847 0.6% 16.7% 4.5% 2014/2015 1,754 1.0% 18.6% 4.2% 1,841 0.7% 15.1% 3.7% P-value for trend* 0.860 0.575 0.735 0.127 0.451 0.701
20
Table 4. Trends in the prevalence of thinness, overweight and obesity in 11-year-old children.
Girls Boys
Study year n Thinness
Overweight (including
obesity) Obesity n Thinness
Overweight (including obesity) Obesity 2004/2005 2,025 0.5% 21.4% 3.9% 2,004 0.5% 21.0% 4.3% 2005/2006 1,922 1.4% 21.9% 3.4% 1,928 0.4% 20.9% 3.2% 2006/2007 1,762 1.1% 18.7% 2.5% 1,867 0.7% 20.5% 3.9% 2007/2008 1,615 1.0% 19.7% 4.3% 1,793 0.6% 20.7% 4.0% 2008/2009 1,734 1.6% 20.0% 4.0% 1,785 0.4% 22.2% 4.3% 2009/2010 1,541 1.0% 19.9% 3.6% 1,620 0.2% 22.6% 4.4% 2010/2011 1,564 0.7% 21.4% 3.8% 1,602 0.4% 24.5% 5.1% 2011/2012 1,607 1.2% 22.3% 3.4% 1,677 0.7% 21.3% 4.2% 2012/2013 1,769 1.5% 22.7% 4.5% 1,843 0.6% 23.9% 5.5% 2013/2014 1,728 1.5% 23.6% 5.6% 1,842 0.4% 23.8% 5.4% 2014/2015 1,742 1.0% 21.2% 3.7% 1,852 0.6% 22.6% 4.8% P-value for trend* 0.115 0.021 0.017 0.871 0.001 0.001
21
Table 5. Trends in the prevalence of thinness, overweight and obesity in 14-year-old children.
Girls Boys
Study year n Thinness
Overweight (including
obesity) Obesity n Thinness
Overweight (including obesity) Obesity 2004/2005 2,243 1.6% 17.0% 2.9% 2,299 0.9% 18.8% 3.2% 2005/2006 2,155 1.4% 17.6% 3.3% 2,202 1.1% 19.1% 4.0% 2006/2007 2,035 1.5% 15.8% 2.6% 2,148 1.0% 18.2% 3.4% 2007/2008 2,142 0.7% 18.3% 2.8% 2,078 0.5% 20.9% 5.2% 2008/2009 1,840 1.8% 17.0% 3.1% 1,885 0.5% 21.6% 4.5% 2009/2010 1,624 1.8% 19.2% 2.8% 1,629 1.0% 23.0% 6.1% 2010/2011 1,631 2.1% 16.5% 4.3% 1,705 0.8% 21.6% 5.7% 2011/2012 1,606 2.2% 19.5% 4.2% 1,746 0.8% 23.8% 5.6% 2012/2013 1,661 1.8% 17.9% 3.7% 1,754 0.5% 24.0% 5.4% 2013/2014 1,602 1.2% 17.4% 2.6% 1,634 1.3% 22.2% 5.8% 2014/2015 1,634 1.3% 19.8% 3.9% 1,673 1.4% 22.1% 5.4% P-value for trend* 0.397 0.025 0.036 0.447 <0.001 <0.001
22
Table 6. Trends in the prevalence of thinness, overweight and obesity in 17-year-old children.
Girls Boys
Study year n Thinness
Overweight (including
obesity) Obesity n Thinness
Overweight (including obesity) Obesity 2004/2005 1,464 1.2% 17.7% 3.6% 1,520 1.0% 18.8% 3.6% 2005/2006 1,680 0.9% 15.8% 2.8% 1,732 1.0% 21.2% 4.9% 2006/2007 1,927 1.4% 15.9% 3.0% 1,947 0.9% 20.4% 3.9% 2007/2008 1,942 1.6% 17.8% 3.8% 2,128 1.2% 21.5% 4.8% 2008/2009 1,916 1.3% 19.1% 3.8% 2,041 0.8% 21.2% 5.0% 2009/2010 1,696 1.7% 15.3% 2.9% 1,828 1.0% 20.5% 4.5% 2010/2011 1,600 1.0% 17.3% 3.4% 1,489 0.7% 23.5% 7.2% 2011/2012 1,446 1.4% 17.8% 3.3% 1,468 0.7% 25.3% 7.8% 2012/2013 1,386 1.8% 17.0% 3.2% 1,436 1.1% 24.0% 6.3% 2013/2014 1,203 1.5% 17.7% 3.8% 1,420 1.2% 22.4% 5.1% 2014/2015 1,381 1.6% 17.2% 4.2% 1,480 0.9% 25.3% 7.3% P-value for trend* 0.123 0.520 0.203 0.919 <0.001 <0.001
0% 5% 10% 15% 20% 25% 30% 0405 0506 0607 0708 0809 0910 1011 1112 1213 1314 1415
Overweight (including obesity) Girls Overweight (including obesity) Boys Obesity Girls Obesity Boys
p<0.05*
p<0.05*
p<0.05*
0% 5% 10% 15% 20% 25% 30% 0405 0506 0607 0708 0809 0910 1011 1112 1213 1314 1415
Overweight (including obesity) Girls Overweight (including obesity) Boys Obesity Girls Obesity Boys
p<0.05*
0% 5% 10% 15% 20% 25% 30% 2004 2005 2006 2007 2008 2009 2010 2011 2012 2013 2014
Overweight (including obesity) Girls Overweight (including obesity) Boys Obesity Girls Obesity Boys
p<0.05*
0% 5% 10% 15% 20% 25% 30% 0405 0506 0607 0708 0809 0910 1011 1112 1213 1314 1415
0% 5% 10% 15% 20% 25% 30% 0405 0506 0607 0708 0809 0910 1011 1112 1213 1314 1415
Overweight (including obesity) Girls Overweight (including obesity) Boys Obesity Girls Obesity Boys
p<0.05*
p<0.05*
p<0.05*
Age group Year of examination 4* 7 11 14 17 n Height m (sd) Weight kg (sd) BMI kg/m2 (sd) n Height m (sd) Weight kg (sd) BMI kg/m2 (sd) n Height m (sd) Weight kg (sd) BMI kg/m2 (sd) n Height m (sd) Weight kg (sd) BMI kg/m2 (sd) n Height m (sd) Weight kg (sd) BMI kg/m2 (sd) 2004/2005 1481 1,04 (0,04) 17,4 (2,3) 16,0 (1,4) 1626 1,22 (0,06) 24,1 (4,4) 16,2 (2,1) 2025 1,45 (0,07) 38,3 (8,4) 18,2 (3,0) 2243 1,62 (0,07) 54,1 (10,8) 20,5 (3,4) 1464 1,66 (0,06) 60,7 (10,5) 22,0 (3,5) 2005/2006 1562 1,04 (0,04) 17,4 (2,5) 16,1 (1,6) 1518 1,21 (0,05) 23,9 (4,4) 16,1 (2,0) 1922 1,44 (0,07) 38,1 (8,4) 18,2 (2,9) 2155 1,62 (0,07) 54,2 (10,6) 20,5 (3,4) 1680 1,66 (0,06) 60,3 (9,6) 21,9 (3,2) 2006/2007 1693 1,04 (0,04) 17,3 (2,3) 16,0 (1,4) 1625 1,22 (0,05) 24,0 (4,0) 16,1 (1,8) 1762 1,44 (0,07) 37,7 (8,5) 17,9 (2,9) 2035 1,63 (0,06) 54,0 (10,1) 20,4 (3,3) 1927 1,66 (0,06) 60,3 (9,9) 21,9 (3,3) 2007/2008 1673 1,04 (0,04) 17,4 (2,4) 16,1 (1,5) 1706 1,22 (0,06) 24,0 (4,1) 16,1 (1,9) 1615 1,44 (0,07) 37,8 (8,6) 18,1 (3,0) 2142 1,63 (0,06) 54,7 (10,6) 20,6 (3,4) 1942 1,66 (0,06) 60,7 (10,5) 22,0 (3,5) 2008/2009 1751 1,04 (0,04) 17,4 (2,3) 16,1 (1,5) 1736 1,22 (0,05) 24,1 (4,3) 16,2 (2,0) 1734 1,45 (0,07) 38,0 (8,6) 18,0 (3,0) 1840 1,63 (0,07) 54,5 (10,5) 20,5 (3,4) 1916 1,66 (0,06) 61,2 (10,5) 22,2 (3,5) 2009/2010 1577 1,04 17,3 16,0 1601 1,22 24,5 16,4 1541 1,44 37,9 18,1 1624 1,63 54,9 20,6 1696 1,66 60,6 21,9
2010/2011 1733 1,04 (0,04) 17,3 (2,3) 16,0 (1,4) 1741 1,22 (0,05) 24,1 (4,2) 16,2 (2,0) 1564 1,45 (0,07) 38,6 (8,5) 18,2 (3,1) 1631 1,63 (0,07) 54,6 (11,1) 20,5 (3,6) 1600 1,66 (0,06) 60,8 (10,2) 22,0 (3,3) 2011/2012 1469 1,04 (0,04) 17,2 (2,3) 16,0 (1,5) 1575 1,21 (0,05) 24,0 (4,3) 16,2 (1,9) 1607 1,45 (0,07) 38,5 (8,7) 18,3 (3,1) 1606 1,63 (0,07) 54,7 (11,0) 20,7 (3,6) 1446 1,66 (0,06) 60,8 (10,6) 22,0 (3,4) 2012/2013 1706 1,04 (0,04) 17,2 (2,3) 16,0 (1,4) 1760 1,21 (0,05) 24,0 (4,2) 16,2 (2,0) 1769 1,45 (0,07) 38,7 (8,9) 18,3 (3,2) 1661 1,62 (0,07) 54,7 (10,8) 20,6 (3,5) 1386 1,66 (0,06) 60,9 (10,5) 22,0 (3,4) 2013/2014 1754 1,04 (0,04) 17,3 (2,4) 16,0 (1,4) 1730 1,21 (0,05) 23,9 (4,2) 16,1 (2,0) 1728 1,45 (0,07) 39,3 (9,6) 18,5 (3,4) 1602 1,63 (0,07) 55,0 (10,7) 20,6 (3,3) 1203 1,66 (0,07) 61,1 (11,1) 22,0 (3,6) 2014/2015 1800 1,04 (0,04) 17,2 (2,3) 15,9 (1,4) 1754 1,22 (0,05) 24,0 (4,2) 16,2 (2,0) 1742 1,45 (0,07) 38,6 (8,4) 18,2 (3,1) 1634 1,63 (0,07) 55,5 (10,7) 20,9 (3,5) 1381 1,66 (0,06) 61,1 (10,5) 22,1 (3,5) *Years of examination among 4 year olds were 2004, 2005, 2006, 2007, 2008, 2009, 2010, 2011, 2012, 2013 and 2014.
Age group Year of examination 4* 7 11 14 17 n Height m (sd) Weight kg (sd) BMI kg/m2 (sd) n Height m (sd) Weight kg (sd) BMI kg/m2 (sd) n Height m (sd) Weight kg (sd) BMI kg/m2 (sd) n Height m (sd) Weight kg (sd) BMI kg/m2 (sd) n Height m (sd) Weight kg (sd) BMI kg/m2 (sd) 2004/2005 1517 1,05 (0,04) 17,9 (2,3) 16,2 (1,4) 1681 1,23 (0,06) 24,6 (4,2) 16,3 (1,9) 2004 1,45 (0,07) 38,6 (8,3) 18,3 (3,0) 2299 1,66 (0,09) 55,7 (12,3) 20,1 (3,3) 1520 1,78 (0,07) 69,8 (12,7) 21,9 (3,5) 2005/2006 1622 1,05 (0,04) 17,8 (2,2) 16,1 (1,3) 1640 1,22 (0,06) 24,4 (4,2) 16,2 (1,9) 1928 1,45 (0,07) 38,4 (8,1) 18,2 (2,9) 2202 1,66 (0,09) 55,7 (12,4) 20,1 (3,4) 1732 1,79 (0,07) 70,8 (13,0) 22,2 (3,6) 2006/2007 1775 1,05 (0,04) 17,9 (2,3) 16,1 (1,4) 1685 1,23 (0,05) 24,5 (4,1) 16,2 (1,8) 1867 1,45 (0,07) 38,3 (8,1) 18,2 (2,9) 2148 1,66 (0,09) 55,5 (12,4) 20,0 (3,3) 1947 1,78 (0,07) 70,2 (12,5) 22,0 (3,5) 2007/2008 1778 1,05 (0,04) 17,9 (2,2) 16,2 (1,3) 1770 1,23 (0,06) 24,4 (4,0) 16,1 (1,8) 1793 1,45 (0,07) 38,4 (8,3) 18,3 (2,9) 2078 1,67 (0,09) 57,3 (12,9) 20,5 (3,5) 2128 1,78 (0,07) 70,5 (12,6) 22,1 (3,5) 2008/2009 1818 1,05 (0,04) 17,8 (2,3) 16,1 (1,4) 1833 1,23 (0,05) 24,7 (4,1) 16,2 (1,8) 1785 1,45 (0,07) 38,7 (8,3) 18,4 (3,0) 1885 1,67 (0,09) 57,3 (13,0) 20,4 (3,6) 2041 1,78 (0,07) 70,6 (13,3) 22,2 (3,7) 2009/2010 1743 1,05 17,9 16,1 1696 1,23 24,8 16,3 1620 1,44 38,6 18,4 1629 1,67 57,8 20,6 1828 1,79 70,9 22,1
2010/2011 1857 1,05 (0,04) 17,8 (2,3) 16,1 (1,4) 1813 1,23 (0,06) 24,6 (4,3) 16,2 (1,9) 1602 1,45 (0,07) 39,2 (8,7) 18,5 (3,1) 1705 1,67 (0,09) 57,8 (13,2) 20,6 (3,7) 1489 1,79 (0,07) 71,7 (14,1) 22,4 (4,0) 2011/2012 1596 1,06 (0,03) 17,8 (3,6) 16,1 (1,4) 1744 1,23 (0,06) 24,6 (4,2) 16,3 (1,9) 1677 1,45 (0,07) 38,5 (8,2) 18,3 (3,0) 1746 1,67 (0,09) 57,5 (13,5) 20,6 (3,8) 1468 1,78 (0,07) 71,8 (14,0) 22,5 (4,0) 2012/2013 1783 1,05 (0,04) 17,7 (2,2) 16,1 (1,3) 1858 1,23 (0,06) 24,6 (4,0) 16,3 (1,8) 1843 1,45 (0,07) 39,3 (9,2) 18,5 (3,4) 1754 1,67 (0,10) 58,1 (13,3) 20,7 (3,7) 1436 1,78 (0,07) 71,4 (13,4) 22,4 (3,8) 2013/2014 1787 1,05 (0,04) 17,7 (2,2) 16,0 (1,3) 1847 1,23 (0,06) 24,7 (4,3) 16,3 (1,9) 1842 1,45 (0,07) 39,3 (8,5) 18,5 (3,1) 1634 1,67 (0,09) 57,8 (13,2) 20,6 (3,8) 1420 1,78 (0,07) 70,6 (13,2) 22,3 (3,7) 2014/2015 1832 1,05 (0,04) 17,6 (2,2) 16,0 (1,3) 1841 1,23 (0,06) 24,5 (4,2) 16,2 (1,9) 1852 1,45 (0,07) 38,9 (8,5) 18,4 (3,1) 1673 1,67 (0,09) 57,4 (13,6) 20,5 (3,8) 1480 1,78 (0,07) 71,7 (13,9) 22,6 (4,0) *Years of examination among 4 year olds were 2004, 2005, 2006, 2007, 2008, 2009, 2010, 2011, 2012, 2013 and 2014