Rapport 20 - 2012
by Laurence Nachin, Christina Normark and Irina Boriak
Proficiency testing
Food Microbiology
- October 2012
0
30
60
90
120
150
180
<1
1.5
2
2.5
3
3.5
4
4.5
5
Antal svar
Log CFU per ml
2,9
↓
No
. of r
Proficiency Testing
Microbiology – Food
October 2012
Laurence Nachin, Christina Normark, Irina Boriak
Microbiology Division
National Food Agency
Box 622
SE-751 26 UPPSALA
SWEDEN
Uppsala 2012
All analytical activities require the execution of work of a high standard that is
accurately documented. For this purpose most laboratories carry out some form of
internal quality assurance, but their analytical work also has to be evaluated by an
independent party. Such external quality control of laboratory competence is
commonly required by accreditation
bodies and can be done by taking part in
proficiency testing (PT).
In a proficiency test, identical test material is examined by a number of
laboratories. The laboratories must follow instructions, perform analyses on the
samples provided and report their results to the organiser. They are also expected
to use their routine methods to analyse the samples provided. The organiser
subsequently evaluates the results using statistical tools and finally compiles them
in a report.
Purpose of the National Food Agency’s proficiency tests
1. Laboratories are externally evaluated with respect to their analytical
competence, including usage of methods, documentation and orderliness.
2. Accreditation bodies are provided with a tool for inspections regarding new
accreditation or maintenance of accreditation.
3. Laboratories and the organiser improve their knowledge of the efficiency of
analytical methods used routinely by participating laboratories with respect to
various types of organisms.
Edition
Version 1 (2012-12-03)
Editor in chief
Annika Rimland, Head of Science Department, National Food Agency
Responsible for the scheme
Contents
Abbreviations ... 4
Design and analyses ... 5
- Analyses performed ... 5
- Test material ... 6
- Quality control of the mixtures ... 7
Laboratory results ... 8
- General information regarding the results ... 8
- Description of mixture A ... 12
- Description of mixture B ... 15
- Description of mixture C ... 17
Outcome of the methods ... 18
- General comments ... 18
- Aerobic microorganisms ... 19
- Contaminating microorganisms ... 20
- Enterobacteriaceae ... 20
- Thermotolerant coliform bacteria ... 20
- Escherichia coli ... 20
- Coliform bacteria, 30
˚C and 37˚C ... 21
- Presumptive Bacillus cereus ... 21
- Coagulase-positive Staphylococci ... 21
- Enterococci ... 22
General outcome of the results – assessment ... 23
- Box plot ... 24
References ... 30
Appendix 1: Results obtained by the participants
Abbreviations
Media
BA
Blood Agar
BcS
Bacillus cereus Selective agar
BGB
Brilliant Green Broth
BP
Baird-Parker agar
BP+RPF
Baird-Parker agar +
Rabbit Plasma Fibrinogen
MPCA
Milk Plate Count Agar
MPN
Most Probable Number
MYP
Mannitol-Egg Yolk-Polymyxin agar
P
Polymyxin
PCA
Plate Count Agar
S&B
Slanetz & Bartley agar
PCA
Plate Count Agar
SFA
Sugar-Free Agar
TBX
Tryptone Bile X-Glucuronide agar
TSA
Trypticase Soy Agar
VRB
Violet Red Bile agar
VRBG
Violet Red Bile Glucose agar
Organisations
IDF
International Dairy Federation
ISO
International Organization for Standardization
NMKL
Nordic Committee for Food Analyses
Design and analyses
The proficiency testing reported in this document was performed during October
2012 and is registered as no. 2822/2012 at the National Food Agency, Uppsala.
Analyses performed
- Quantitative analyses
Aerobic microorganisms, 30
˚C and 20˚C
Contaminating microorganisms
Enterobacteriaceae
Coliform bacteria, 30
˚C and 37˚C
Thermotolerant coliform bacteria
Escherichia coli
Presumptive Bacillus cereus
Coagulase-positive Staphylococci
Enterococci
- Qualitative analysis
Gram-negative bacteria in pasteurized milk and cream. Detection of recontamination.
Test material
Each laboratory received three freeze-dried microbial mixtures designated A-C.
The manufactured test material was freeze-dried in portions of 0.5 ml in vials, as
described by Peterz and Steneryd (1). Before analysing the samples, the contents
of each vial had to be dissolved in 254 ml of diluent. The organisms present in the
mixtures are listed in Table 1.
Table 1. Microorganisms present in mixture A-C supplied to participants
Mixture
1
Microorganism
Strain no.
A
Aeromonas caviae
SLV-206
Enterobacter cloaceae
SLV-011
Bacillus cereus group (atypical)
SLV-517
Enterococcus durans
SLV-078
B
Micrococcus sp.
SLV-055
Proteus vulgaris
SLV-476
Enterococcus faecalis
SLV-051
C
Micrococcus sp.
SLV-055
Escherichia coli
SLV-524
Bacillus cereus group
SLV-518
Staphylococcus aureus
SLV-280
1
Quality control of the mixtures
It is essential to have homogeneous mixture and uniform volume in all vials in
order to allow comparison of all freeze-dried samples from one mixture. Quality
control was performed in conjunction with manufacture of the mixtures according
to Scheme Protocol (2). The results are presented in Table 2. Homogeneity
requires that the standard deviation and the difference between the highest and
lowest value of results from 10 samples analysed do not exceed 0.15 log
10
units
and 0.5 log
10
units, respectively.
Table 2. Concentration mean (m) and standard deviation (s) from analyses of 10
randomly selected vials per mixture, expressed in log
10
cfu (colony forming units)
per ml of sample.
Analysis and method
m
A
s
m
B
s
m
C
s
Aerobic microorganisms 30
˚C
NMKL-method nr. 86
4.03
0.06
5.19
0.03
4.88
0.03
Aerobic microorganisms 20
˚C
NMKL-method nr. 86
3.97
0.07
5.05
0.04
4.87
0.05
Contaminating microorganisms
ISO-method nr. 13559:2002
IDF-method nr. 153:2002
4.09
0.09
5.13
0.05
4.93
0.04
Enterobacteriaceae
NMKL-method nr. 144
3.00
0.05
4.37
0.04
3.23
0.04
Coliform bacteria 30
˚C
NMKL-method nr. 44
2.88
0.06
–
–
3.16
0.05
Coliform bacteria. 37
˚C
NMKL-method nr. 44
2.94
0.05
–
–
3.17
0.04
Thermotolerant coliform bacteria
NMKL-method nr. 125
–
–
–
–
3.24
0.03
Escherichia coli
NMKL-method nr. 125
–
–
–
–
3.24
0.03
Presumptive Bacillus cereus
NMKL-method nr. 67
3.00
0.03
–
–
3.60
0.05
Coagulase-positive Staphylococci
NMKL-method nr. 66
–
–
–
–
4.74
0.04
Enterococci
NMKL-method nr. 68
3.70
0.03
3.86
0.04
–
–
Gram-negative bacteria in pasteurized milk
and cream. Detection of recontamination*
NMKL-method nr. 192
pos
–
pos
–
pos
– No target organism
Laboratory results
General information regarding the results
Samples were sent to 223 laboratories, 54 in Sweden, 153 in other European
countries, and 16 outside Europe. 214 laboratories reported results, 108 (50%)
provided at least one result that received an annotation. In the previous round
(October 2011) with similar analyses, the proportion was 46%.
Highly deviating values that did not belong to a strictly normal distribution were
identified as statistical outliers (Grubbs’ test modified by Kelly (3)). In some
cases, subjective adjustments were made to set limits, based on knowledge of the
mixture’s contents. Outliers and false results were not included in the calculations
of means and standard deviations. Results reported as “>value” were excluded
from the evaluation. Results reported as “<value” were interpreted as being zero
(negative result). All reported results are presented in Appendix 1.
Description of mixture A
Mixture A contained Aeromonas caviae, Enterobacter cloaceae, presumptive
Bacillus cereus group, and Enterococcus durans
Table 3. Outcome of each analysis for mixture A
Analysis
Organism
m
as
bF+ F−
Outl< Outl>
n
cAerobic microorgs, 30 ºC
A. caviae
E. durans
4.05
0.20
0
0
3
8
197
Aerobic microorgs, 20 ºC
A. caviae
E. durans
3.99
0.16
0
0
2
1
42
Contaminating microorg
A. caviae
E. durans
3.82
0.27
0
2
1
1
27
Enterobacteriaceae
E. cloaceae
2.98
0.23
0
1
0
3
160
Escherichia coli
(E. cloaceae)
-
-
6
0
-
-
149
Thermotolerant coliform
(E. cloaceae)
-
-
5
0
-
-
62
Coliform bacteria 30
oC
E. cloaceae
2,96
0.26
0
3
0
1
78
Coliform bacteria 37
oC
E. cloaceae
2.96
0.23
0
5
0
2
113
Presumptive B. cereus
Pres. B. cereus
2.85
0.29
0
53
0
1
143
Coagulase pos. staph.
-
-
-
0
0
-
-
134
Enterococci
E. durans
3.67
0.12
0
11
6
3
93
Gram negative bact. in dairy
products
A. caviae
E. cloaceae
pos
-
0
2
-
-
11
a
mean value and standard deviation of laboratory results expressed in log
10cfu/ml (Appendix 1)
bstandard deviation of laboratory results
c
number of analyses performed
F+ and F-: numbers of false positive and false negative results, respectively.
Outl < and Outl>: number of low and high outliers, respectively.
Aerobic microorganisms 30
˚C and 20˚C
The colonies counted for these analyses are mainly from the strains of Aeromonas
caviae and Enterococcus durans present in the mixture at the highest
concentration. Some colonies were quite small after incubation at 30
˚C or 20˚C
and were counted under magnifier at National Food Agency. The small colonies
could explain the dispersion of the results and the deviating results obtained.
Contaminating microorganisms
As for the analysis of aerobic microorganisms, colonies are mainly from the
strains of A. caviae and E. durans. Only 27 laboratories performed this analysis.
The average value is slightly lower than for the total count of aerobic
microorganisms. No confirmation step is required for this analysis according to
standard method ISO 13559:2002/IDF 153:2002, but a catalase test can be
performed. Both catalase-positive and catalase-negative microorganisms present
in mixture A form colonies on SFA, which could explain the dispersion of the
results depending if all or only catalase negative colonies were counted.
Enterobacteriaceae, coliform bacteria 30
˚C and 37˚C
Mixture A contained a strain of Enterobacter cloaceae which forms typical
colonies on VRBG and VRB medium. Few laboratories reported divergent results
for these analyses. Indeed, other colonies appeared on these media but they were
atypical and differentiate from enterobacteriaceae and coliforms bacteria in the
confirmations tests (oxidase-positive and no fermentation of lactose in BGB)
Thermotolerant coliform bacteria and Escherichia coli
Mixture A did not contain any strain of E. coli or thermotolerant coliform
however five and six false positive results were obtained for these analyses,
respectively. The strain of E. cloaceae can form colonies if plates are incubated at
a temperature slightly below 44
˚C and be therefore misjudged as thermotolerant
coliform bacteria. It is worth noticing that all laboratories that reported false
positive results for the analysis of thermotolerant coliform bacteria reported an
absence of E. coli in the mixture, indicating a correct interpretation of the
confirmation steps. Concerning the E. coli analysis, none of the laboratories that
reported a false positive result had carried out the analysis of thermotolerant
coliform bacteria; moreover the analysis was performed at a temperature below
44
˚C and / or did not include confirmations steps.
Presumptive Bacillus cereus
The strain included in mixture A belongs to B. cereus group and was isolated
from a cream sauce that caused food poisoning. This strain forms atypical
colonies, shiny with a small haemolysis zone on BA medium. On
Mossel/MYP-agar and BcS, colonies appear pink and light blue, respectively and on both media
the precipitation zone is weak or even absent. 53 laboratories reported a false
negative result for this analysis. No correlation between method and false results
can be established.
Due to the high difficulty of the analysis, the results are not evaluated and
therefore no z-score will be calculated. Moreover, these results are not taken into
account in the tables under the box plots.
Coagulase-positive Staphylococci
Mixture A did not contain any target organism for this analysis and did not cause
any major problem.
Enterococci
Mixture A contained a strain of Enterococcus durans which forms typical
colonies on Slanetz-Bartley medium and is positive for esculine hydrolysis.
However, 11 laboratories reported a false negative result and several reported
outliers results.
Gram-negative bacteria in pasteurized milk and cream. Detection of
recontamination
E. cloaceae was the target organism for this analysis. Only eleven results were
Figure 1. Histograms of all analytical results obtained for the mixture A.
values within the interval of acceptance (Appendix 1), outliers, false
negative results, * outliers outside of the x-axis scale. The mean value of the
analysis results is indicated in the histograms
0 10 20 30 40 50 2 2,5 3 3,5 4 4,5 5 5,5 6 log 10 CFU per ml 4,0 ↓ Aerobic microorganisms 30 °C N o o f r e s u lt s 0 5 10 15 20 2 2,5 3 3,5 4 4,5 5 5,5 6 log 10 CFU per ml 4,0 ↓ Aerobic microorganisms 20 °C N o o f r e s u lt s 0 10 20 30 40 50 1 1,5 2 2,5 3 3,5 4 4,5 5 log 10 CFU per ml 3,0 ↓ Enterobacteriaceae N o o f r e s u lt s 0 5 10 15 20 2 2,5 3 3,5 4 4,5 5 5,5 6 log 10 CFU per ml 3,8 ↓ Contaminating microorganisms N o o f r e s u lt s 0 10 20 30 1 1,5 2 2,5 3 3,5 4 4,5 5 log 10 CFU per ml 3,0 ↓ Coliform bacteria 30 °C N o o f r e s u lt s 0 10 20 30 1 1,5 2 2,5 3 3,5 4 4,5 5 log 10 CFU per ml 3,0 ↓ Coliform bakteria 37 °C N o o f r e s u lt s 0 20 40 60 0 0,5 1 1,5 2 2,5 3 3,5 4 log 10 CFU per ml 2,9 ↓
Presumtive Bacillus cereus
N o o f res u lt s 0 10 20 30 40 1 1,5 2 2,5 3 3,5 4 4,5 5 log 10 CFU per ml 3,7 ↓ Enterococci N o o f res u lt s
*
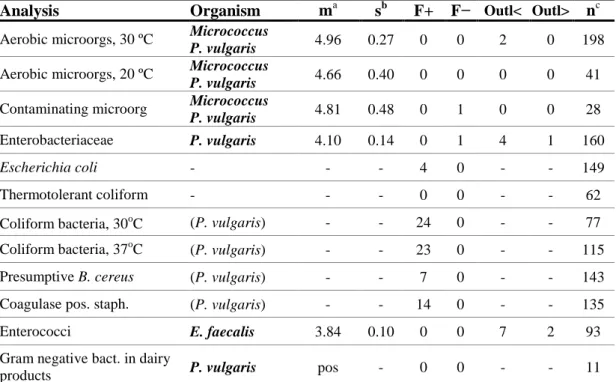
Description of mixture B
Mixture B contained Micrococcus sp., Proteus vulgaris and Enterococcus
faecalis.
Table 4. Outcome of each analysis for mixture B
Analysis
Organism
m
as
bF+ F
−
Outl< Outl>
n
cAerobic microorgs, 30 ºC
Micrococcus
P. vulgaris
4.96
0.27
0
0
2
0
198
Aerobic microorgs, 20 ºC
Micrococcus
P. vulgaris
4.66
0.40
0
0
0
0
41
Contaminating microorg
Micrococcus
P. vulgaris
4.81
0.48
0
1
0
0
28
Enterobacteriaceae
P. vulgaris
4.10
0.14
0
1
4
1
160
Escherichia coli
-
-
-
4
0
-
-
149
Thermotolerant coliform
-
-
-
0
0
-
-
62
Coliform bacteria, 30
oC
(P. vulgaris)
-
-
24
0
-
-
77
Coliform bacteria, 37
oC
(P. vulgaris)
-
-
23
0
-
-
115
Presumptive B. cereus
(P. vulgaris)
-
-
7
0
-
-
143
Coagulase pos. staph.
(P. vulgaris)
-
-
14
0
-
-
135
Enterococci
E. faecalis
3.84
0.10
0
0
7
2
93
Gram negative bact. in dairy
products
P. vulgaris
pos
-
0
0
-
-
11
a
mean value and standard deviation of laboratory results expressed in log
10cfu/ml (Appendix 1)
bstandard deviation of laboratory results
c
number of analyses performed
F+ and F-: numbers of false positive and false negative results, respectively.
Outl < and Outl>: number of low and high outliers, respectively.
- : no target organism
( ): false positive organism in a presumptive analysis
Aerobic microorganisms 30
˚C and 20˚C
Micrococcus and P. vulgaris were the two microorganisms at the higher
concentration in mixture B. The participants results are quite spread for both
analyses with a long tail of lower results for the count of aerobic microorganisms
at 30
˚C. This outcome can be explained by the use of different methods and/or
substrate and is discussed further in the section “outcome of the methods”
Contaminating microorganisms
As for the analysis of aerobic microorganisms, colonies are mainly from the
strains of Micrococcus and P. vulgaris. Few laboratories participate in this
analysis and, like for mixture A, the results are quite spread without any obvious
main peak. This can be linked to the swarming characteristic of P. vulgaris
colonies which makes difficult the plate reading.
Enterobacteriaceae
P. vulgaris was the target organism for this analysis which present only few
difficulties.
Thermotolerant coliform bacteria and Escherichia coli
Mixture B did not contain any strain of E. coli or thermotolerant coliform and
only four false positive results were obtained for the analysis of E. coli.
Coliform bacteria 30
˚C and 37˚C
Mixture B did not contain any coliform bacteria but a strain of P. vulgaris which
forms very small colonies without precipitation zone on VRB agar. Moreover, in
the confirmation step, P. vulgaris does not produce gas in BGB and can therefore
be distinguished from coliform bacteria. However, 34 laboratories reported a false
positive result for this analysis at 30
˚C, 37˚C or both temperatures. This indicated
that colonies of P. vulgaris were considered as coliform bacteria and that the
confirmation step failed or was not performed.
Presumptive Bacillus cereus
Mixture B did not contain any presumptive B. cereus but the P. vulgaris strain
which forms swarming colonies on Blood agar could make difficult the reading of
the plates. However, P. vulgaris grows on MYP medium forming B. cereus-like
colonies which could explained that seven laboratories reported a false positive
result.
Coagulase-positive Staphylococci
No coagulase positive Staphylococci was present in mixture B, but the strain of P.
vulgaris which forms black colonies with a surrounding zone on BP-agar can be
misinterpreted as Staphylococcus. However, these bacteria can be differentiated
from each other in the confirmation step of the analysis: P. vulgaris is
coagulase-negative. On BP-agar with RPF, P. vulgaris forms colonies without any zone and
cannot therefore be misinterpreted as a coagulase-positive Staphylococcus. Many
laboratories (~10%) reported a false positive result, 10 of them used BP-agar or3
Petrifilm
™
Staph.
Enterococcci
Enterococcus faecalis was the target organism for this analysis. Several
laboratories reported outliers but no explanation could be found from the method
information given by the participants.
Gram-negative bacteria in pasteurized milk and cream. Detection of
recontamination
Figure 2. Histograms of all analytical results obtained for mixture B.
For details, see legend to Figure 1.
0 20 40 60 80 3 3,5 4 4,5 5 5,5 6 log 10 CFU per ml 5,0 ↓ Aerobic microorganisms 30 °C N o o f r e s u lt s
*
0 5 10 15 20 3 3,5 4 4,5 5 5,5 log 10 CFU per ml 4,7 ↓ Aerobic microorganisms 20 °C N o o f r e s u lt s 0 5 10 15 20 3 3,5 4 4,5 5 5,5 6 log 10 CFU per ml 4,8 ↓ Contaminating microorganisms N o o f r e s u lt s 0 20 40 60 80 2 2,5 3 3,5 4 4,5 5 5,5 6 log 10 CFU per ml 4,1 ↓ Enterobacteriaceae N o o f r e s u lt s 0 15 30 45 60 1 1,5 2 2,5 3 3,5 4 4,5 5 log 10 CFU per ml 3,8 ↓ Enterococci N o o f res u lt sDescription of mixture C
Mixture C contained Micrococcus sp., Escherichia coli, presumptive Bacillus
cereus and Staphylococcus aureus.
Table 5. Outcome of each analysis for mixture C
Analysis
Organism
m
as
bF+ F
−
Outl< Outl>
n
cAerobic microorgs, 30 ºC
Micrococcus
S. aureus
4.82
0.14
0
0
10
2
197
Aerobic microorgs, 20 ºC
Micrococcus
S. aureus
4.69
0.21
0
0
4
0
42
Contaminating microorg
Micrococcus
S. aureus
4.48
0.61
0
0
0
0
27
Enterobacteriaceae
E. coli
3.03
0.14
0
0
2
2
160
Escherichia coli
E. coli
3.08
0.14
0
5
10
2
147
Thermotolerant coliform
E. coli
3.08
0.17
0
1
1
1
61
Coliform bacteria, 30
oC
E. coli
2.97
0.16
0
0
2
4
78
Coliform bacteria, 37
oC
E. coli
3.00
0.23
0
1
0
1
112
Presumptive B. cereus
Pres. B. cereus
3.52
0.16
0
2
6
2
142
Coagulase pos. staph.
S. aureus
4.62
0.11
0
4
4
1
134
Enterococci
-
-
-
1
0
-
-
93
Gram negative bact. in dairy
products
E. coli
pos
-
0
0
-
-
11
a
mean value and standard deviation of laboratory results expressed in log
10cfu/ml (Appendix 1)
bstandard deviation of laboratory results
c
number of analyses performed
F+ and F-: numbers of false positive and false negative results, respectively.
Outl < and Outl>: number of low and high outliers, respectively.
- : no target organism
( ): false positive organism in a presumptive analysis
Aerobic microorganisms
The organisms detected by these analyses were mainly Micrococcus spp. and
Staphylococcus aureus which should not cause any particular difficulties.
However, ten and four low outliers were obtained for the analysis of aerobic
microorganisms at 30
˚C and 20˚C, respectively. No method or medium could be
linked to the low values obtained after incubation at 30
˚C. On the other hand, all
participants who carried out the analysis at 20
˚C and used MPCA, obtained values
regarded as low outliers for the mixture C.
Contaminating microorganisms
As for the analysis of aerobic microorganisms, colonies are mainly from the
strains of Micrococcus and S. aureus. Few laboratories participate in this analysis
and the results are quite spread without any obvious main peak.
Enterobacteriaceae, E. coli, thermotolerant coliform, and coliform bacteria
30
˚C and 37˚C
The E. coli strain present in mixture C was the target organism for the five
analyses, which is reflected by similar mean values obtained. The analysis of
enterobacteriaceae did not revealed any difficulties. For the analysis of E. coli, 5
false negative and 10 low outliers results were reported. No obvious explanation
for these results appeared when looking at the method or medium used by the
participants. Concerning the analysis of coliform bacteria, at 30
˚C, the results are
distributed in a wide peak, while at 37
˚C they separate in
one major and one
minor peak centered around 3.0 and 2.5, respectively. This distribution of the
results could not be linked to the method and/or medium used for the analysis.
Presumptive Bacillus cereus
Mixture C contained a typical strain belonging to the B. cereus group. This strain
forms typical colonies on BA, BcS and MYP media. For an unexplained reason,
two false negative and eight outliers results were reported.
Coagulase-positive Staphylococci
Mixture C contained a strain of S. aureus which forms typical colonies on both
BP and BP+RPF medium. On the former, the coagulase reaction is not tested
directly on the plate and must be performed with rabbit plasma. On the latter,
coagulase-positive strain form grey/black colonies surrounded by a precipitation
halo. Some laboratories reported outliers results but none of them used BP+RPF.
This suggest that the results interpretation was more difficult with other media or
that the confirmation steps failed.
Gram-negative bacteria in pasteurized milk and cream. Detection of
recontamination
0 20 40 60 80 2 2,5 3 3,5 4 4,5 5 5,5 6
log10 CFU per ml
4,8 ↓ Aerobic microorganisms 30 °C N o o f r e s u lt s 0 5 10 15 20 2 2,5 3 3,5 4 4,5 5 5,5 6
log10 CFU per ml
4,7 ↓ Aerobic microorganisms 20 °C N o o f r e s u lt s 0 5 10 15 20 2 2,5 3 3,5 4 4,5 5 5,5 6 log 10 CFU per ml 4,5 ↓ Contaminating microorganisms N o o f r e s u lt s 0 20 40 60 80 0 0,5 1 1,5 2 2,5 3 3,5 4 log 10 CFU per ml 3,1 ↓ E. coli N o o f r e s u lt s
*
0 10 20 30 40 0 0,5 1 1,5 2 2,5 3 3,5 4 log 10 CFU per ml 3,1 ↓ Thermotolerant coliforms N o o f r e s u lt s 0 10 20 30 1 1,5 2 2,5 3 3,5 4 4,5 5 log 10 CFU per ml 3,0 ↓ Coliform bacteria 30 °C*
N o o f re s u lt s 0 10 20 30 1 1,5 2 2,5 3 3,5 4 4,5 5 log 10 CFU per ml 3,0 ↓ Coliform bacteria 37 °C N o o f re s u lt s 0 20 40 60 80 1 1,5 2 2,5 3 3,5 4 4,5 5 log 10 CFU per ml 3,0 ↓ Enterobacteriaceae N o o f r e s u lt sFigure 3. Histograms of all analytical results obtained for mixture C. For details,
see legend to Figure 1.
0 15 30 45 60 1 1,5 2 2,5 3 3,5 4 4,5 5
log10 CFU per ml
3,5 ↓
Presumtiv Bacillus cereus
N o o f res u lt s 0 15 30 45 60 2 2,5 3 3,5 4 4,5 5 5,5 6
log10 CFU per ml
*
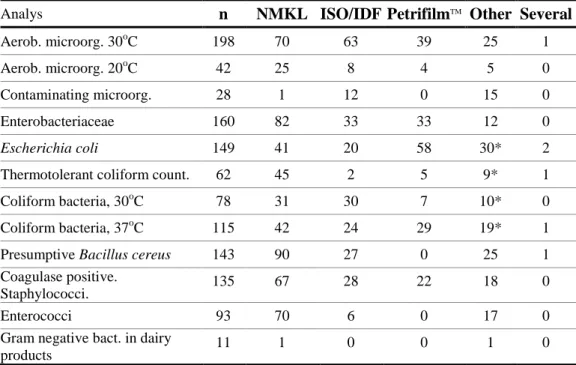
4.6 ↓ Coagulase-positive Staphylococci N o o f res u lt sOutcome of the methods
General comments
According to EN ISO/IEC 17043, for which the proficiency testing programme
organised by the National Food Agency is accredited, it is mandatory for the
participating laboratories to give method information for all analyses for which
they report results. However, the method information is sometimes difficult to
interpret, e.g. many laboratories choose a medium that differs from that in the
reported standard methods. Therefore, first the distribution of methods used for
each analysis is presented (Table 6). Thereafter, for each analysis, the results are
divided according to the medium used.
In the tables of this section, the following symbols have been used:
n
amount of laboratory that performed the analysis
m
mean value of laboratory results in log
10cfu/ml (false results and outliers excluded)
s
standard deviation of laboratory results
<
amount of low outliers and false negative
>
amount of high outliers
F+
amount of false positive
Table 6. Distribution of the methods used by the laboratories for each analysis.
Analys
n
NMKL ISO/IDF Petrifilm
TMOther Several
Aerob. microorg. 30
oC
198
70
63
39
25
1
Aerob. microorg. 20
oC
42
25
8
4
5
0
Contaminating microorg.
28
1
12
0
15
0
Enterobacteriaceae
160
82
33
33
12
0
Escherichia coli
149
41
20
58
30*
2
Thermotolerant coliform count.
62
45
2
5
9*
1
Coliform bacteria, 30
oC
78
31
30
7
10*
0
Coliform bacteria, 37
oC
115
42
24
29
19*
1
Presumptive Bacillus cereus
143
90
27
0
25
1
Coagulase positive.
Staphylococci.
135
67
28
22
18
0
Enterococci
93
70
6
0
17
0
Gram negative bact. in dairy
products
11
1
0
0
1
0
Aerobic microorganisms
30
˚C
Mixture A
Mixture B
Mixture C
n
m
s
<
>
n
m
s
< >
n
m
s
< >
PCA
117
3.99 0.17
2
4 117
5.03 0.24 1 0 117
4.82 0.13 5 2
Petrifilm
™
37
4.26 0.17
0
2
38
4.71 0.27 0 0
37
4.81 0.17 1 0
MPCA
25
4.01 0.20
0
2
25
5.02 0.18 0 0
25
4.84 0.18 1 0
TSA
9
4.03 0.14
0
0
9
4.96 0.22 0 0
9
4.89 0.15 1 0
Other
9
-
-
1
0
9
-
-
1 0
9
-
-
1 0
20
˚C
n
m
s
<
>
n
m
s
< >
n
m
s
< >
PCA
29
3.96 0.15
0
0
28
4.81 0.28 0 0
29
4.71 0.19 0 0
Petrifilm
™
4
4.27
-
1
1
4
4.59 0.32 0 0
4
4.63 0.39 1 0
MPCA
3
3.90
-
1
0
3
3.78 0.17 0 0
3
-
-
3 0
Other
6
-
-
0
0
6
-
-
0 0
6
-
-
0 0
The results obtained for these analyses are similar but some trends are noticeable
when using Petrifilm™, both at 30
˚C and 20˚C: results are higher for mixture A,
lower for mixture B and similar to the results obtained with other media for
mixture C (Fig 4). For mixture A, some colonies were quite small, hence it is
possible that the presence of tetrazolium in the Petrifilm™ facilitates their
enumeration. The results for mixture B spread with a tail of lower values, mainly
linked to the use of Petrifilm™. Mixture B contained P. vulgaris, forming
swarming colonies that could render difficult the results interpretation.
Few laboratories performed the analysis at 20
˚C but , for the three mixtures, the
use of MCPA led to results considered as low outliers and/or close to the lower
limits of the interval of acceptance. This was not the case at 30
˚C.
Figure 4. Analytical results of aerobic microorganisms at 30
o
C for mixture A-C
according to the medium used: PCA, MPCA, Petrifilm
TM0 10 20 30 40 50 2 2,5 3 3,5 4 4,5 5 5,5 6 log 10 CFU per ml N o o f r e s u lt s