THE AFFECT OF URBANIZATION ON THE COST
OF OPERATING AN IRRIGATION DISTRICT OR CANAL COMPANY
John Wilkins-Wellsl Thayne Coulter
ABSTRACT
This is a report of data collected on irrigation districts and mutual ditch and irrigation companies (what we broadly term irrigation enterprises) in the intermountain region, and comprising the states of Colorado, Idaho, New Mexico, Utah and Wyoming. The data are from a three year study funded by the U.S. Bureau of Reclamation and entitled Irrigation Entemrise Management Practice Study HEMPS).l The study was located at Colorado State University. A variety of data were collected on thirty-six irrigation districts and canal companies, including operation/maintenance and administrative costs from 1945 to 1995. The combined effective irrigated acreage served by the sample is 1,478,720 acres (1995), or a little over one-tenth of all intermountain irrigated lands served by gravity canal systems. Costs reported are, in effect, the water costs borne by farmers for surface gravity supplies provided by local irrigation enterprises. What follows is (1) a brief overview of average water costs, and (2) a more in-depth analysis of the affect of urbanization on the cost of operating these two forms of enterprises. The conclusion is that urbanization in the region appears to be having a dramatic affect on operating costs, and therefore the price paid by farmers for water supplied through these enterprise.
BACKGROUND
The urbanization of prime irrigated lands is clearly one of the major issues facing the West today.2 The intermountain region, an area that has served for many years as a summer recreational haven for those wishing to escape the heat and noise of urban living, is now experiencing rapid and permanent urban settlement. This is occurring in many areas traditionally dominated by irrigated agriculture and its associated economy. Most of the desirable locations for new urban growth have been developed through the years, in great part, by irrigated agriculture. These
lSenior Research Scientist, Special Assistant Professor, Department of Sociology, Colorado State University, Fort Collins, Colorado, 80523.
2 Sociologist, Resource Management, Bureau of Reclamation, Denver Federal Center, P.O. Box 25007-D8580, Denver, Colorado, 80225-0007.
242 USCID 14th Technical Conference
select localities have a good water supply to support urban growth and ample vegetation in an otherwise very arid environment.
At the same time, many communities, particularly those founded on agriculture, mining and tourism, frequently appear unprepared to deal politically or economically with this new urban growth. Many traditional agricultural communities have seemingly resigned themselves to the inevitable change. Others are attempting to gain some control of urbanization through county or municipal ordinances, covenants and zoning that are designed to protect prime irrigated lands.3
However, it is not only the number of people, but the changing values and priorities associated with this demographic shift that are of concern to farmers. Differences and conflicts between rural and urban values and priorities are observed in local newspapers daily. Gone are the days when urban residents could casually claim that their parents or grandparents were farmers, and therefore felt a strong kinship with agriCUlture. Present urban residents are often two or three generations removed from the farm, and their knowledge of farming needs is therefore minimal.
Costs Associated With Urbanization
As urbanization gradually creeps into the service areas of local irrigation districts and canal companies, challenges are made to informal agriCUltural water exchange agreements and reservoir storage release scheduling that have been practiced over many years. Traditional water exchanges and diversions which have often been practiced as a means of stretching scarce water supplies to overcome peaks and valleys in river flows, and to improve cooperation between enterprises competing over water, are now often viewed by urban dwellers and municipal planners as obstructions to the aesthetic value of rivers meandering through urban corridors. Challenges are frequently made that the traditional practices of irrigation enterprises destroy wetlands, riparian habitat and natural river meanders. One frequently hears that a "new legal order" must be instituted.4
Even when
agriculturalists point out that many of these local wetlands and other habitats were largely created by irrigated agriculture, it is often of no avail.
Urban dwellers tend to view waterways and vegetation created by irrigation enterprises as a haven for light recreation; walking, birdwatching, biking, running, and other activities. All of these activities increase the demands on irrigation enterprise management, and their legal liabilities in numerous ways. Irrigation enterprise rights-of-way are routinely challenged by urban dwellers, developers and planning agencies. The petition for right-of-way crossings to facilitate developer needs, or the request (often in the form of a demand) made by
Affect of Urbanization on Operating Cost
today. Lawsuits associated with accidents along irrigation enterprise rights-of-way may not necessarily lead to unfavorable settlements for these enterprises, but such lawsuits almost inevitably result in substantial costs to retain attorneys to protect enterprise assets.
Irrigation Enterprise Operating Costs
243
Reporting average costs per irrigated acre, or cost per acre foot of water delivered to the farm headgate, must be treated with extreme caution. There was no strong correlation in the lEMPS data between the size (acreage) of an irrigation enterprise service area and the cost per irrigated acre borne by farmers in financing the enterprise. The cost of operating an enterprise in the intermountain region varies greatly because of differences in physical location, canal engineering and administrative requirements. Therefore, the cost of water for irrigated agriCUlture varies considerably from one enterprise to the next. Water cost can vary by $20 per acre or more between irrigation enterprises immediately adjacent to each other.
In the lEMPS sample of thirty-six enterprises, and for the year of 1995, operation/maintenance and administrative costs (and therefore the price paid by farmers for water supplied through these nonprofit enterprises), ranged from $5.00 per irrigated acre to $78.00 per irrigated acre, with an average of about $20.68 per irrigated acre. The $20.68 per irrigated acre cost can be broken down as follows: $7.75 per irrigated acre for total 0 & M costs, $11.87 per irrigated acre for administrative costs, .88¢ for debt payment on the irrigation enterprise and .17¢ for special project costs.
Prorating an average cost of $20.68 per irrigated acre for a sample representing 1,479,000 irrigated acres, and an effective water supply of approximately two acre feet per acre for the region, would give an average cost of $10.34 per acre foot for water supplied by enterprises in the intermountain region. This would mean that for an average size farm of280 acres, the annual water bill would be about $5,790 dollars. It is believed that these are generally conservative estimates for irrigation water costs in the region.
The cost of irrigation water in the intermountain region may be understated by researchers working in the field. This is primarily due to the fact that (I) farm labor costs associated exclusively with water application, (2) farm capitalization costs associated exclusively with irrigation, and (3) pumping of supplemental water from private irrigation wells are often ignored in the calculation of farm water cost.s These additional costs may double the cost per unit (acre foot) of water applied to the land. Only the cost of gravity surface delivery by irrigation enterprises is generally used. This is all that is reported in the present study when the value of $20.68 per irrigated acre is indicated for the sample.
244
USCID 14th Technical Conference
The decade of the 1970s appears to be one in which irrigation enterprise operation/maintenance and administrative costs begin to show their most rapid increase. Some of this is undoubtedly due to the general inflation in the economy at this time. However, the trend continues unabated thereafter. Another jump in cost occurs in the 1 980s and continues into the present. Much of this later jump in costs appears due to urbanization in the intermountain region, plus the overall affects of the general increase in environmental regulations, including the administrative burden associated with environmental requirements. Discussions with irrigation enterprise managers and board members clearly point to
urbanization as a major factor in explaining the increase in costs of approximately 300 percent between 1975 and 1995.
It will come as no surprise that the relationship between the cost of operating an irrigation enterprise, and the degree--and perhaps even the pattern--of urbanization being experienced by the county that the irrigation enterprise is located in, is an important one. This relationship is a major focus of the IEMPS research effort. The problem has been to develop methods that will allow quantitative data to be used to assess and monitor this relationship over time. These will be discussed momentarily.
A major contributor to administrative costs appears to be employee salaries. Some of this increase is obviously due to incrementally higher pay rates for higher skilled managers, office secretaries and additional field staff over the years. The cost of employee health and retirement benefits is rapidly growing in importance too. IEMPS found that employee salaries were generally sixty percent (60%) higher for enterprises located in urbanizing counties compared to enterprises located in more rural counties.
IEMPS cannot at this time state with any degree of precision what percentage of irrigation district or canal company operating costs are directly the result of accommodating the specific needs of urbanization. Examples of these needs include dealing with housing subdivision development within the irrigation enterprise service area, dealing with a rapidly rising rural non-farm population of hobby farmers and rural-to-urban commuters, litigation over protection of irrigation enterprise rights-of-way, increased costs ofliability insurance for irrigation enterprises and other urbanization-generated costs. These costs are . often disguised in the annual expense statements of these enterprises. Attempts were made by IEMPS to extract these urbanization-based costs in various ways, since they are rarely reported as separate line items in enterprise expenditures. As mentioned earlier, most of the thirty-six irrigation enterprises in the sample are located in separate counties. Each of these counties in turn show unique
demographic characteristics, based on an analysis of U.S. Census data going back to World War II. The census data have been useful in developing a typology or
Affect of Urbanization on Operating Cost 245
classification of county demographic trends specifically designed for IEMPS research needs. We will now turn to a discussion of these demographic types and what they tell us about the affect of urbanization on irrigation enterprise costs
COUNTY DEMOGRAPHIC TYPES
The analysis of demographic data on fifty-six important irrigation counties in the intermountain region, of which thirty-six have an irrigation enterprise that IEMPS collected data on, appears to show three principal demographic types for our interest.6 They are: 1) the urbanized agricultural county; 2) the quasi-urban agricultural county, and; 3) the typical ruraJ agriculturaJ county. These three demographic types are more or less defined by the particular configuration of three principal population groups in these counties over time. These popUlation groups are: 1) the urban population, 2) the rural non-farm population, and; 3) the rural farm population. Table 1 shows the county affiliation of thirty-six irrigation enterprises relative to these three demographic types. We will now examine these three types.
Type #1 - Urbanized Agricultural County
There are several counties in the intermountain region that still possess valuable irrigated lands, despite having a sizable urban population. These counties might be considered as urbanized agriculture counties, rather than urban metropolitan counties. Such counties appear to have been in the process of becoming slowly urbanized since shortly after World War II. Their urban population usually comprises 66% or more of the total county population today. However, it will come as no surprise that they are usually close to a major metropolitan area in the region, such as Denver, Boise or Salt Lake City.
Larimer County, Colorado and Davis County, Utah seem to represent examples of this demographic Type # J agricultural county, where irrigated agriculture is still relatively important, but where enormous growth pressures are being exerted daily on irrigated agriculture. The demographic trends for Larimer and Davis counties, along with the population numbers for the three principal population groups (urban, rural non-farm and rural farm) are shown in Figures 1 and 2. Irrigated acreage in Larimer County has decreased by about 18% since 1949, while irrigated acreage in Davis County has decreased by about 27% over the same period. Despite these decreases, the acreage remaining in irrigation is still important in both counties, and is of course served by important canal companies in these counties too.
246
USCID 14th Technical Conference
In summary, Type #1 counties tend to show a trend toward urbanization beginning in the 1950s, continuing steadily into the 1990s. Being adjacent to a major
Table I - Classifying Thirty-Six Irrigation Enterprises by Three County Demographic Types Location of Irrigation Enterprise = Type #1 - Urbanized Agricultural County I. Progressive Irrigation District, Bonneville Co., Idaho
2. Cub River Irrigation Company, Cache Co., Utah
3. Davis and Weber Counties Canal Company, Davis Co., Utah
4. Elephant Butte Irrigation District, Dona Ana Co., New Mexico N=9
5. North Poudre Irrigation Company, Larimer Co., Colorndo 6. Grand Valley Irrigation Company, Mesa Co., Colorado 7. Orchard Mesa Irrigation District, Mesa Co., Colorndo 8. Bessemer Ditch and Irrigating Company, Pueblo Co., Colorndo 9. Strawberry Highline Canal Company, Utah Co., Utah
Location of Irrigation Enterprise = Type #2 - Quasi-Urban Agricultural County I. Bear River Irrigation Company, Box Elder Co., Utah
2. Dry Gulch Irrigation Company, Duchesne Co., Utah 3. Riverton Valley Irrigation District, Fremont Co., Wyoming 4. Goshen Irrigation District, Goshen Co., Wyoming 5. Pine River Irrigation District, La Plata Co., Colorado 6. Uncompahgre Water Users Association, Montrose Co., Colo. 7. Bijou Irrigation District, Weld Co., Colorado
8. Catlin Canal Company, Otero Co., Colorado 9. Shoshone Irrigation District, Park Co., Wyoming
N= 17
10. Heart Mountain Irrigation District, Park Co., Wyoming I I. Wheatland Irrigation District, Platte Co., Wyoming 12. San Luis Valley Irrigation District, Rio Grande Co., Colorndo 13. Gunnison Irrigation Company, Sanpete Co., Utah 14. Twin Falls Canal Company, Twin Falls Co., Idaho 15. Burley Irrigation District, Cassia Co., Idaho
16. Upper Hanover Irrigation District, Waskakie Co., Wyoming 17. Henrylyn Irrigation District, Weld Co., Colorado
Location of Irrigation Enterprise = Type #3 -Rural Agricultural County I. Trinchern Irrigation Company, Costilla Co., Colorado
2. Cottonwood Creek Canal Company, Emery Co., Utah 3. Huntington-Cleveland Irrigation Company, Emery Co., Utah 4. Egin Bench Canal Company, Fremont Co., Idaho 5. North Side Canal Company, Jerome/Gooding Co., Idaho
N= 10
6. Butte and Market Lake Canal Company, Jefferson Co., Idaho 7. Abraham Irrigation Company, Millard Co., Utah
8. Julesburg Irrigation District, Sedgwick Co., Colorado 9. Salmon River Canal Company, Twin Falls Co., Idaho 10. North Sterling Irrigation District, Morgan Co., Colorado
Affect of Urbanization on Operating Cost
Figure 1 - Larimer County, Colorado
100% 80% ~ 60%
..
'"
3. 40% 20% 0%Figure 2 - Davis County. Utah
100% 80% !:f 60%
..
'"
;a. 40% 20% 0%Population Trends 1940·1990
Breakdown by Key Population Groupings
,..,.,r-=---,c::--:-- - - " .
1940 1950 1960 1970 1990
Vear
Source: us 8~reau ofC~nsu.s
Population Trends 1940·1990
Breakdown by Key Population Groupings
... -=--.,-:=--,---".
Vear
Sourc~; us SCIre-au ofC~(tsU$ Figure 3 - Delta County. Colorado
Population Trends 1940-1990
Breakdown by Key Population Groupings
.... ...."".-::-:==---.,. 100%
I II
II
II
II
I.. -.) : ,
IIII II II II II I
I
11111
1/
II
II I
1 II II II II II I
1
II 11-11-11_11 1
BO% !:f 60%..
'"
3. 40% 20% 0% I I I I '.1 • I ":, I I I Vear$oure.a-: us Sur~ilu OfC~('t.1U$ 247
248
USCID 14th Technical ConferenceFigure 4 - Goshen County, Wyoming
80% ~ 60% g a 40% 20% 0% Population Trends 1940-1990 Velr
SOClrc .. ; us Burellel ofCef7sus Figure 5 - Sedgwick County. Colorado
Population Trends 1940-1990
Breakdown by Key Population Groupings
1 00% rr--.,.rr----,.rr---,~~m_-rI1rF<irOi!~~_:I 80%
i
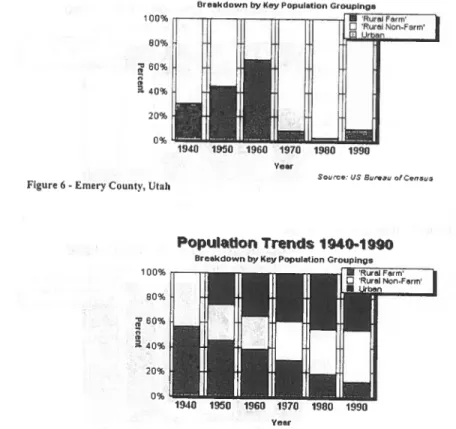
60% co a 40% 20% 0%Figure 6 - Emery County, Utah
100% 80% ~ 60% ~ 40% 20% 0% Vear Population Trends 1940-1990 Vear
Affect of Urbanization on Operating Cost 249
metropolitan area pretty much defines their growth pattern. Larimer County is an example of an agricultural county that was nevertheless considerably urbanized prior to World War II; being 52% urban in 1940. It is close to the Denver metropolitan area. A regional land grant college was present early on, and several large corporations began moving into the county in the 1960s. On the other hand, Davis County had an urban population of only 21 % in 1940. It is located just north of Salt Lake City. Some of the counties of this type, such as Davis County, were Type #2 counties (our next type described below) shortly after World War II. However, Davis County moved rapidly into the Type #1 category as Salt Lake City and Ogden grew and people began moving into suburbs developing in neighboring Davis County.
Type #2 - Ouasi-Urban Agricultural County
The next county type we encounter in the data is the quasi-urban agricultural county. These counties usually have at least one major trade center of 5000 people or more. However, they are unique in having a substantial rural non-farm population. They tend to occur in the following two situations:
1) Several small trade centers combine to make up a mixture of both urban and rural farm population. However, the rural non-farm population often makes up 40% to 60% of the total county population. This is generally not the result of the presence of a large nearby metropolitan area, but rather the result of several small trade centers. Delta County, Colorado (Figure 3) and Goshen County, Wyoming (Figure 4) might be examples; 2) The county has a substantial rural non-farm population spilling into it from an urban metropolitan county or an urbanized agricultural county and its economy (Type #1 above). Cassia County, Idaho and Sevier County, Utah might be examples (demographic charts not shown).
Regardless of which of the two Type #2 situations one is discussing, this quasi-urban agricultural county shows an unusually large rural non-farm population relative to the two other popUlation groupings. This rural non-farm population is not engaged in farming, but rather employed in the local agri-business sector or in the neighboring metropolitan area economy. Long-distance commuting by car to work may be noticeable on local state or interstate highways in these counties. Type #3 - Typical Rural Agricultural County
Finally, there is the typical rural county where the urban population is very small. However, the rural farm population may be only about seven to ten percent of the
250
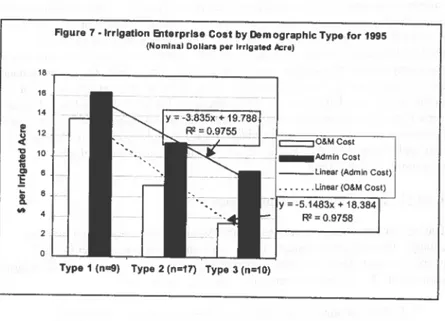
USCID 14th Technical ConferenceFigure 7 -Irrigation <erprlse Cost by Demographic Type for 1995
(Nominal DoUar. per Irrigated Acre)
18~ __________________________ ~ 16 14 I!! 12 ~
I
10f
8!
...
4Type 1 (nag) Type 2 (n"17) Type 3 (n"10)
_ _ Linear (Admin CoSI)
••••••. Linear (O&M Cost)
y = -5.1483x + 18.384 R2 =0.9758
total population as welL In fact, today, there are almost no important irrigation counties in the intermountain region that have a rural farm population greater than fifteen percent. Irrigated agriculture tends to produce viable local trade centers supporting a sizable rural non-farm population. Consequently, in these typical rural agriCUltural counties, the rural non-farm population predominates as well. It
is just that the rural farm population remains significant at the same time.
Examples of this Type #3 demographic pattern might be Sedgwick County,
Colorado (Figure 5) or Emery County, Utah (Figure 6).
In summary, we would anticipate that the cost of operating an irrigation enterprise in this third demographic type would be the least costly environment. On the
other hand, the urbanized agriCUltural county (Type #1) might be expected to show
the most costly environment for irrigation enterprises. Finally, irrigation enterprise costs in Type #2 counties might be expected to fall somewhere in
between irrigation enterprise costs in Type #1 and Type #3 demographic environments. We can examine this relationship statistically.
Again, Table I shows the names of thirty-six irrigation enterprises for which information on operation/maintenance and administrative costs were available for 1995. Figure 7 shows the average overall operation/maintenance cost, and then the average administrative cost alone, for the three county types. It is clear that the Type #1 demographic pattern shows higher costs per irrigated acre for
Affect of Urbanization on Operating Cost
irrigation enterprises. We will now turn to some supporting evidence for our thesis that urbanization results in increased costs for irrigation enterprises, and therefore the price of water paid by farmers.
THE BEALES CODE
251
Dr. Calvin Beales is a U.S.D.A. sociologist who developed a numerical classification scheme for more carefully identifying and understanding the demographic character of counties. 7 The Beales Code is a useful and widely accepted typology for classifying counties on a rural-urban continuum, and is based on a variety of economic, social and political factors. The numerical continuum runs from "0" signifying most urban county to "9" signifying most rural county. We will use this classification to further explore and substantiate the effect of urbanization on the cost of operating an irrigation enterprise.
Using IEMPS data from two reporting years (1975 and 1995), Table 2 and 3 show comparisons of the cost per irrigated acre of operating an irrigation enterprise in two rural-urban subgroupings, using the earliest (1974) and the most recent (1993) Beales
classification. These data tend to show that the cost per irrigated acre is
lower when these enterprises are located in more rural (6 to
Table 2 - Irrigation Enterprise Costs (Combined 0 & M and
Administrative CosU) Per Irrigated Acre By Beales Code (1974,1993)
BEALES COUNTY Average IE Cost Average IE Cost CODE Per Irrigated Acre Pcr Irrigated Acre CLASSIFICA nON in 1975 in 1995 o to 5 (A $6.51 $22.82 Predominantly Urban County) 6t09(A $5.91 $19.35 Predominantly Rural County)
Based on 16 irrigation enterprises having complete cost data for 1975 and 1995.
9) counties, than in more urban (0 to 5) counties.
Note also the relatively dramatic increase in operational costs in the short span of twenty years. Irrigation enterprise costs per irrigated acre are similar for the two subgroupings in 1975. However, they are considerably different twenty years later. This may be explained by the fact that many of the urban counties in 1975 were really our Type #2 counties (quasi-urban agricultural counties) discussed in the previous section; whereas in 1995 these same counties have moved into the Type #1 county demographic pattern and are more clearly urban in nature. Overall, Table 2 and 3 tend to further substantiate our thesis about the affect of urbanization on irrigation enterprise costs over the years.
When the three county demographic types discussed earlier are taken together with the Beales Code analysis. the data seem to give strong support to the thesis
252
USCID 14th Technical Conference
that urbanization increases the cost of operating an irrigation enterprise. Rarely can the costs associated with urbanization be passed on by farmers to the very juggernaut that is imposing them. Growers absorb the cost. It comes out of their
farm income.
CONCLUSION
Due to the relatively low returns to primary agricultural production in the region--despite the importance of regional commodity production, and feed production for the cattle/calve, dairy, hog and sheep industry--farmers tend to be very vulnerable
to rapidly increasing water costs. A water budget of two acre feet per acre on a 280 acre farm, with an average water cost of $1 0 per acre foot, would result in an annual water bill of about $5,600. A 30 percent increase in the cost of operating an irrigation enterprise delivering water to the same farm--and primarily as a result
of increased operation and
administrative costs associated with urbanizing
influences--Table 3 - Irrigation Enterprise Costs (Administrative Costs Only) Per Irrigated Acre By Beales Code (1974, 1993) BEALES COUNTY Average IE Cost Per Average IE Cost Per CODE Irrigated Acre in Irrigated Acre in
CLASSIFICATION 1975 1995 Oto5(A $3.44 $14,83 Predominantly Urban County) 6t09(A $2,01 $12,08 Predominantly Rural County)
Based on 16 irrigation enterprises having complete cost data for 1975 and 1995.
would increase the water bill for this same farm by $1,700. This scenario is not unrealistic considering the information shown here on trends in irrigation enterprise costs associated with urbanization.
These factors clearly reflect one type of crisis for irrigated agriculture in the region. One alternative for many irrigated farms is to make greater use of groundwater where available--when the cost of groundwater is less than the surface supplies provided by the local irrigation enterprise. However, this strategy may potentially deplete local groundwater resources. Another strategy is simply to sell the farm and benefit from rapidly increasing farm real estate values. There may be no other alternative for a farm located a considerable distance from the river, and relying upon a canal system to obtain water, when confronted with a sizable increase in its irrigation enterprise water bill due to urbanizing influences. These relationships are often poorly understood, frequently perverse and extremely dangerous to the preservation of food producing areas in the intermountain region.
Urbanizing influences appear to lead to increasing costs of operating an irrigation enterprise. These costs are passed on by the nonprofit enterprise to individual
Affect of Urbanization on Operating Cost 253
farmers, who in tum are absorbing the costs of urban expansion onto irrigated lands that were developed in part through the U.S. Bureau of Reclamation revolving fund and private capital. The problem is that these and other market factors affecting water rates for irrigated agriculture and reallocation of river basin supplies are generally oblivious to the prioritization of land use. The way of life represented by agriculture and its important value system aside, Class I and Class II farm land is placed in harm's way due to the frequent unwillingness or inability of county and local government to deal effectively and timely with urban sprawl and its associated rural non-farm population growth.
If farmers could pass on at least an equitable share of the costs of the urbanization of agricultural lands to food consumers, the economic impact on agriculture might be considerably lessened. However, these costs are difficult for agriculture to pass
on to the consumer. One may argue that water costs could be alleviated through
improved water use and conservation. However, on-farm water conservation is primarily paid for by farmers through their individual investment in new and more efficient irrigation technologies, and/or increased labor costs to improve water application on the farm. Concurrently, technological improvements for the irrigation enterprise itself cannot be passed on to the general pUblic. These costs associated with the urbanization of irrigated lands are now absorbed almost entirely by farmers. There is little discussion today about the public'S need to share in these costs, costs directly associated with how urban dwellers utilize land. In recent years, irrigation enterprises have been forced to develop special water rates for subdivisions and other fractional water users to achieve equity in the relationship between water used and the water service provided. These water rates are frequently set higher for fractional water users than for bulk users represented by actual income-producing farms. This is one important way to defray the cost of urbanizing influences, but often does not get at the problem of preserving the geographical integrity and physical assets of irrigation enterprise service areas. There are long-term investments that all farms in an irrigation enterprise service area have made in developing the canal infrastructure over many years. This past investment cannot be easily recuperated through special water rates for non-agricultural users; thereby ensuring equity in benefits received from the irrigation facilities relative to the individual investments made over many years.
IEMPS has shown that thirty-six irrigation enterprises, for which data was available in the single year of 1995, reported $214,202,003 in fixed assets (the book value of primary canal systems only), or approximately $157 per acre of irrigated land. The book value of irrigation infrastructure in the 5 state
intermountain region, and again for primary canal systems only, is conservatively estimated at $1.4 billion based on IEMPS data. Dams, local water storage
254
USCID 14th Technical Conference
facilities, and major pumps and diversion structures are not included in this book value.
Each converted acre of irrigated land to urbanization potentially represents an income loss from future assessments needed to maintain the operating condition of these valuable canal assets. This is a troubling trend. If irrigated lands and the associated canal infrastructure are needed to meet future food production needs, which they inevitably will, the cost of moving onto Class III and Class IV lands because of the loss of Class I and Class I11ands--and the associated cost of reinvesting in new irrigation system infrastructure to serve these new lands--will result in ever increasing costs of producing crops. If past trends continue, farmers may be expected to absorb these costs as well.
The urbanization of agricultural counties is generally not supported by a proper and detailed assessment of the long-term costs and consequences of losing these agricultural assets. Despite the constant warning about the loss of agricultural land, it is the loss of "prime irrigated lands" to urban development that poses the most concern for food production in the future. However it is not just the land, but also the valuable irrigation water delivery infrastructure that has been developed over the years--frequently with federal support--and at a great cost to agricultural incomes in the past. Finally, the trends noted here potentially represent the loss of much needed farm income, viable farms and experienced farmers.
REFERENCES
1. 1. Wilkins-Wells, R.L. Anderson, G.A. Pavelis and M .. S Anwer, Irrigation Enterprise Management Practice Study, U.S. Bureau of Reclamation, Project # EI.D4.4, January (1999).
2. U.S.D.A., Agricultural Resources and Environmental Indicators, 1996-1997.
An Economic Research Service Report, Agricultural Handbook No. 712, July (1997).
3. 1. Freedgood, Saving American Farmland: What Works, USDA, Natural Resources Conservation Service (1997).
4. C.F. Wilkinson, Aldo Leopold and Western Water Law: Thinking
perpendicular to the Prior Appropriation Doctrine, Land and Water Law Review, 24:1 (1989).
5. G. A. Pavelis, Natural Resource Capital Formation in American Agriculture: Irrigation, Drainage, and Conservation, 1885-1980. USDA, Economic Research Service, Natural Resource Economics Division (1985).
Affect of Urbanization on Operating Cost
6. Part of this analysis has been infonned by N. Brooks, D. Reimund and R.N. Peterson, Effects of Population Growth and County Type on Farm Structure,
1970-1980. USDA, Economic Research Division, Agriculture and Rural Economy Division.
255
7. PJ. Cook and I.F. Hardy, Updating the ERS County Typology. USDA, Economic Research Service, Agriculture and Rural Economy Division, December (1993).