THE ADVANCED PLACEMENT GAP: EFFECTS OF FEDERAL FEE WAIVERS ON AP EXAM PARTICIPATION AND PERFORMANCE
by
DANA A. WALLNER B.S., Illinois State University, 1998
M.A., The Colorado College, 2005
A dissertation presented to the graduate faculty of the University of Colorado Colorado Springs
in partial fulfillment of the requirements for the degree of
Doctor of Philosophy
Department of Leadership, Research, and Foundations 2018
© 2018
DANA A. WALLNER ALL RIGHTS RESERVED
This dissertation for the Doctor of Philosophy degree by Dana A. Wallner
has been approved for the
Department of Leadership, Research, and Foundations by
Phillip Morris, Ph.D., Chairperson
Dick Carpenter, Ph.D.
Corinne Harmon, Ed.D.
Craig Loper, Ph.D.
Margaret Scott, Ed.D.
Wallner, Dana A. (Ph.D., Education Leadership, Research, and Policy)
The Advanced Placement Gap: Effects of Federal Fee Waivers on AP Exam Participation and Performance
Dissertation directed by Assistant Professor Phillip Morris, Ph.D.
ABSTRACT
A paired samples t test and two fixed effects regression analyses were conducted using school-level data to determine factors most related to Advanced Placement exam participation and performance between fee waiver-qualifying students and non-fee waiver-qualifying students in one Western state. From 2006-2014, AP exam passing percentages for fee waiver students increased, while passing percentages for non-fee waiver students remained unchanged. However, non-fee waiver students maintain a higher overall passing percentage than fee waiver students. Regression results indicate significant effects for free and reduced price lunch recipients (FRL%), district size, school size, and percent graduates on AP exam participation for all students in all years of the study. School size, FRL%, and percent minority students had significant effects on fee waiver student passing of AP exams. Findings support recommendations for a
comprehensive approach to funding and reform, improved data collection measures, and greater transparency in data access, and contribute to existing literature by offering school-level analysis of statewide AP testing trends.
Keywords: achievement gap, Advanced Placement, College Board, free and reduced price lunch (FRL), fee waiver, equity, No Child Left Behind Act of 2001
ACKNOWLEDGEMENTS
The completion of this Dissertation would not have been possible without the guidance and support of several generous people. I owe my deepest gratitude to Phillip Morris, Ph.D., my dissertation chairperson, for his support and reassurance throughout the process. This dissertation would not have been possible without the statistical expertise and steadfast guidance of Dick Carpenter, Ph.D., who adeptly steered my idealistic interests into viable methodological models. I am indebted to Corinne Harmon, Ed.D., my true compass of compassion, who modeled a “students first” philosophy that inspires my work to this day. I am truly grateful for the mentorship and friendship of Craig Loper, Ph.D. Few things comfort the heart quite like having someone in your corner. Thank you, Doc, for being in mine for the past 20 years. Many thanks to Margaret Scott, Ed.D., for her meticulous skill in editing, genuine interest in the research, and generous feedback. I gratefully extend my thanks to department chairperson Sylvia Mendez, Ph.D., for her continued support and advocacy on my behalf.
To my mother, Barbara, ever a champion of education and a constant support, thank you. (Surprise!)
To my dear friend, Tanya, thank you for much-needed moments of levity and encouragement.
Finally, to my husband, Tim, thank you for your unwavering support and infinite belief in me. You have held down the fort for years, and your sacrifice has enabled me to explore, ponder, invent, and dream. Simply put, I am here today only because of you.
DEDICATION
I dedicate this dissertation to my advanced English Language Arts students, who gave me far more than I ever could have given them.
TABLE OF CONTENTS CHAPTER
I. INTRODUCTION………..………1
Overview……….……….1
Accountability, the Achievement Gap, and Advanced Placement ……….2
Statements of Problem and Purpose………6
Theoretical Frameworks.……….9
Research Questions………..………..………12
II. REVIEW OF THE LITERATURE………..…………13
Operational Definitions……….….………13
The Low-income Achievement Gap……….…….15
AP Program Expansion and the Achievement Gap………...18
College Board Equity Statement………22
Test Fee Grant Program as National Education Policy…...………..……23
ESCAPE: The Federal Grant Plan of Colorado……….26
Rationale for State Focus on Colorado………..………28
Advanced Placement and the Low-income Participation Gap.…….…....30
Advanced Placement and the Low-income Achievement Gap……..……35
Outcomes of Rapid Advanced Placement Expansion………37
III. METHODOLOGY..……….43
Research Questions………...……….43
College Board Released Data and Rationale……….……44
Public Data and Rationale……….…46
Sample………...….52 Research Design...………..54 Regression Assumptions……….…………...56 Data Screening…..……….57 Limitations…..………...61 IV. RESULTS………63 Descriptive Statistics………..………63 Research Question #1………64 Research Question #2………66 Research Question #3……….………...67
V. DISCUSSION OF RESULTS, LIMITATIONS, AND IMPLICATIONS……..69
Results………70 Limitations………....…….75 Implications………77 REFERENCES………..86 APPENDICES………...…96 A. IRB Approval………..…………..96
B. Letter of Approval for Data Release, Colorado Department of Education….…..97
C. Colorado Open Records Request, Colorado Department of Education…….…...98
D. Data Release Contract between the College Board and The University of Colorado - Colorado Springs……….…100
E. Eliminating Student Cost for Advanced Placement Exams (ESCAPE)
Fee Waiver Form, 2014……….……….….106
LIST OF TABLES TABLE
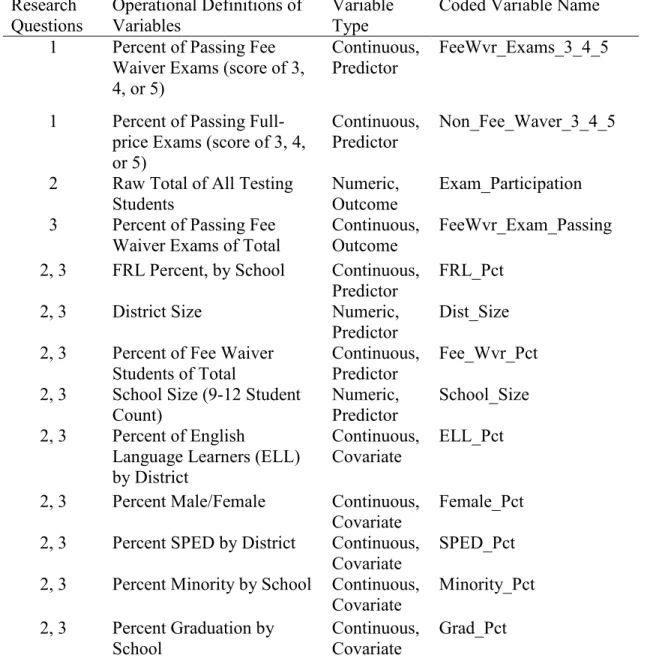
3.1. Variables by Research Question………...…51
3.2. Exam and Student Totals for AP Testing, 2006-2014………..……….…...…54
3.3. Number and Percent Missing by Variable………..….….58
3.4. Tests of Normality of All Variables………...…...60
4.5. Descriptive Statistics, All Variables………..……...64
4.6. Mean Percent Passing: Fee Waiver vs. Non-fee Waiver Students, by Year…...65
4.7. Paired Samples t test Results: Passing Fee Waiver vs. Passing Non-Fee Waiver, by Year……….66
4.8. Fixed-Effects Regression Analysis: Exam Participation (All Students)…………..67
LIST OF FIGURES FIGURE
INTRODUCTION Overview
Educational equity, particularly as it pertains to underrepresented low-income populations, has a pronounced ethical and sociopolitical history in the United States. Central to this history, the educational “gap” has become paramount in discussions of educational reform in K-12 education at the state and national levels. The primary national focus is on the achievement gap, which denotes the persistent measurable difference in academic performance between groups of students, such as male and female, Black and White, or urban and rural (National Assessment of Educational Progress, 2015). The term carries with it an educational imperative: educators, policymakers, and communities must make a concerted effort to reduce such gaps.
Often noted as a precursor to the achievement gap, a second discrepancy in educational attainment between groups of students is the gap in academic opportunity, or “access,” which addresses the availability of diverse and challenging coursework deemed necessary for college and career readiness. Principally, the access gap is illustrated through comparisons of academic course offerings, early enrollment programs, and myriad resources available at school and district levels. The access gap is differentiated not only by socioeconomics, but urban, suburban, and rural assignation, and finally, between White, Asian American, Black, Hispanic/Latino, and Native American students (National Assessment of Educational Progress, 2015). First recognized in a
comprehensive study conducted by Coleman, Hobson, McPartland, Mood, Weinfeld & York (1966) in response to The Civil Rights Act of 1964 (Civil Rights Act, 1964), both access and achievement gaps have demanded the spotlight within education reform and expanded to the national consciousness with the adoption of the No Child Left Behind Act of 2001 (NCLB), and later, the “Race to The Top” national initiative in 2009. NCLB established measures that uncovered achievement gaps between students from varying socioeconomic backgrounds and initiated important national discourse on education reform (No Child Left Behind Act of 2001). Fifty years after Coleman et al.’s 1966 seminal study and despite various state and national reform efforts, the achievement gap, largely, has persisted (Hallet & Venegas, 2011; Lee & Burkham, 2002; Reardon, 2011). The disparity in educational access and achievement between traditionally underserved students has led to funding and reform efforts to close the achievement gap.
Accountability, the Achievement Gap, and Advanced Placement
A national shift toward accountability has been essential in efforts to ensure a quality education for all students. The challenges lie in the adequate implementation and measurement of this goal. National policy has consistently focused first on increasing the access students in lower socioeconomic areas have to higher academic opportunities, particularly students of low-income status. Both NCLB and “Race to the Top”
specifically focus on promoting test-based accountability systems as tools for remedying a vast array of educational problems, including inadequate resources, poor motivation, sub-par instruction, varying or inconsistent standards, and educational inequality with the intention of producing college and career ready high school graduates (No Child Left
Behind Act of 2001). Emerging as a beacon of higher academic achievement and as a measure of such academic “readiness,” the College Board’s Advanced Placement (AP) program has entered the discussion on access and achievement gaps as the solution for these problems (Dougherty & Mellor, 2009).
Utilizing a name that has become synonymous with rigorous coursework, policymakers and educational agencies, with the support of community stakeholders, have promoted the expansion of Advanced Placement (AP) courses. In the past 60 years, no other high school program has risen to such a prominent role in the American
educational landscape quite like the AP program (Lichten, 2010). AP course designation has become synonymous with increased rigor and the ideals of college readiness.
Introduced in the 1950s as a program designed to meet the needs of high-achieving students in a select group of elite northeastern schools, the AP program boasted
2,342,528 student test-takers nationwide in 2014 and maintains a dominant presence in 68% of American high schools (College Board, 2014a). Paramount to the program’s success has been federal and state legislation specifying advanced placement as a key indicator of both a student’s college and career readiness and a badge of school excellence.
The need for more rigorous and relevant coursework is heightened for low-income students and students from racial/ethnic minority groups. Because of the Advanced Placement program’s influence over the college admissions landscape, “refraining from AP participation, or worse still, attending a high school which does not offer advanced placement programming, can hinder postsecondary educational options”
(Sadler & Sonnert, 2010, p. 220). Advanced Placement currently factors into five different admissions criteria for most four-year public institutions: high school GPA, class rank, dual credit enrollment, AP course grades, and AP exam participation (Klopfenstein & Thomas, 2010). Because of this, AP has emerged as one of the most dominant factors in college acceptance. Other than college enrollment, AP courses may be the foremost, if not the solitary, opportunity for students to engage in rigorous, relevant curricula (Sadler & Sonnert, 2010).
In order to promote educational equity and college readiness of minority and disadvantaged students, policy makers have sought to expand AP programming in schools serving those students (Handwerk, Tognatta, Coley & Gitomer, 2008). The policy intentions are twofold, with a primary goal of improving the educational experience of the better-prepared low-income students, particularly in the science, technology, engineering, and math (STEM) fields. The summative goal is to use the AP program to transform curriculum at the school level, extending the availability of college and career preparatory coursework to the larger population of disadvantaged students within the nation’s schools—in essence, increasing the rigor and value of the academic curricula of K-12 schools nationwide (Dougherty & Mellor, 2009).
As indicated by the College Board, the data trend for the national percentage of AP enrollments culminating in exam participation is on the rise and has enjoyed steady growth over the past four decades in response to this concerted national focus. As reported in the 2014 AP Report to the Nation, the College Board compared national participation and testing trends from the graduating class of 2003 to the graduating class
of 2013 and reported several encouraging findings. The class of 2013 attained 1,000,135 more passing AP exam scores of 3, 4, or 5 and had an increase of 824,368 AP scores of 1 or 2. Succinctly, there was greater participation and a greater increase in passing scores than in failing scores from 2003 to 2013 (College Board, 2014a).
Nationally, the percent of high school graduates who took at least one AP test during their senior years climbed from 18.9% in 2003 to 33.2% in 2013. The success rate increased as well: 12.2% of these test takers earned a passing score of 3 or higher in 2003, compared to 20.1% in 2013. Of those testing seniors, 11.4% were low-income in 2003, compared with 27.5% in 2013. In total, 275,864 low-income graduates in the class of 2013 took at least one AP exam during their high school careers, which far exceeds the number of low-income graduates who took an AP exam in the class of 2003 (College Board, 2014a).
Although encouraging, these generalizations cast broad strokes of meaning to the national trend of increased AP participation and likely pose a logical side effect of state and national legislation, a favorable reciprocal relationship among students, high schools and colleges in terms of credits earned and matriculation, and finally, the national
increase in the number of students who now qualify as “low-income graduates.” Absent from the College Board’s report are passing rates of low-income students and the extent to which AP participation and exam success varies at the school level with regard to socioeconomic gaps. Specific attention to the Advanced Placement exam as a measure of examining the achievement gap at the school level has not yet been paid, though
state-mandated testing is heavily utilized for such assessments of low-income academic progress.
Statements of Problem and Purpose
In January of 2015, news outlets reported a statistic emblematic of a newspaper headline: concise, easily understandable—an attention-grabbing shout of an update: over half of the nation’s students qualify for free and reduced price lunch. The Washington Post article, entitled “Majority of U.S. public school students are in poverty,” disclosed that 51% of students in pre-kindergarten through 12th grade during the 2012-2013 school year qualified for the federal assistance program that provides free and reduced price lunches to eligible students (Layton, 2015). Although this occurrence was not surprising to researchers, it did arrive earlier than expected. This turning point cannot help but steer our direction as we shape policy, teaching, and services to serve the new majority.
As the expansion, prominence, and influence of the Advanced Placement program is considered within secondary and postsecondary education, the problem of
underrepresentation and underperformance of the new student majority continues to be of national concern (Reardon, 2011). In an attempt to remedy the barrier of prohibitive exam costs that exacerbate an existing socioeconomic gap in participation and
performance on the AP exam, substantial financial support has been allocated by federal and state agencies with the intention of narrowing such gaps. With such subsidies available, the question remains: have we succeeded in narrowing the gaps? The AP participation and performance gaps, as they exist in the context of Advanced Placement participation and achievement at the school level, have gone largely unexplored,
particularly when school level data are utilized. This study presents the advantage of looking at the problem through two lenses: the larger picture of AP practices and outcomes for an entire state which has documented and vested interests in AP opportunity expansion, and a focused, intra-school examination of testing and achievement trends. Metaphorically, the study utilizes both telescope to examine
statewide participation and microscope to examine test-taking practices and results at the school level to provide insight into one facet of a multifaceted issue.
The purpose of this study is to evaluate the effects of federal subsidies for AP exam participation and exam achievement through a comparison of students who qualify for fee waiver assistance and those who do not, at the public school level in the state of Colorado for the 2005-2014 school years. The state of Colorado was selected for the focus of the study due to state population growth over the span of the study, the robust percentages of students who meet the free and reduced price lunch criteria for financial assistance, the wide variance in school settings present in the state, and the significance of legislation passed in response to NCLB which designated Advanced Placement enrollment and performance as required indicators for the statewide school accreditation contract, per the Colorado Revised Statutes and Education Accountability Act of 2009. (Education Accountability Act, 2009). Within, The Code of Colorado Regulations (2006) delineates the reporting data collection and reporting parameters for the state of Colorado as follows:
2202-R-3.00 Accreditation Indicator Reporting
Annually by December 1 the local board of education shall report in writing its progress on district and school accreditation indicators. Progress shall be reported
in a way that does not identify individual students and shall contain all elements required by the Education Accountability Act, C.R.S. 22-7-205 (2). These reports shall be disseminated to each school’s local community and the district’s
taxpayers and shall be available to the State Board of Education, the general assembly, the governor, and the public at large. (Code of Colorado Regulations, 2006)
2202-R-3.01 (3) The number of students taking one or more advanced placement examinations; the total number of students enrolled in advanced placement classes; and the percentage of those students obtaining a passing grade on an advanced placement examination as defined in the accreditation contract; and/or equivalent indicators of high academic performance as defined in the local district/State Board of Education Accreditation Contract. (Code of Colorado Regulations, 2006)
These articles of the Colorado Revised Statutes make possible the acquisition of student level Advanced Placement placement data that have previously been unavailable to the public; such data served as the crux of the study’s analysis. The specification that such data be disseminated by the state to all stakeholders prompted the creation of the Schoolview and DataLab tools, which serve as storehouses of searchable data for the state and are managed by the Colorado Department of Education. It is worth reiterating that Advanced Placement enrollment, exam participation, and exam performance have not only been earmarked as indicators of academic excellence; they have also been identified as essential measurement components of a school’s merit through
accreditation. The option to participate in Advanced Placement programming no longer seems optional, given the emphasis of AP in school and district valuations.
Overall, Colorado students have responded to the rapid expansion of Advanced Placement offerings in terms of participation. The 2015 College Board Progress Report for Colorado indicated that 45,633 students took an AP Exam in 2015, compared to 41,533 in 2014 and 33,127 in 2011. Of those 45,633 students, 16.7% were low-income
students, compared to 15.0% in 2014 and 11.9% in 2011 (College Board, 2015). The question remains as to whether low-income students have benefitted from federal assistance to the extent that they are participating and achieving on these exams to a comparable degree as their more financially advantaged counterparts.
Equity in access and achievement have been noted by the College Board as priorities for improvement, but the published analysis falls short of capturing whether progress has been made in narrowing the gaps that exist between low-income students and their counterparts at the school level. This study seeks to remedy this absence of measurement by further examining the relationship between financial assistance and the effect of such offered subsidies to Advanced Placement exam participation and exam achievement.
Theoretical Frameworks
The study utilizes Gerald Leventhal’s (1976) Justice Judgment Theory as a framework for ethical decision-making and understanding, as well as Change Theory (Weiss, 1995) as a framework for understanding the evaluative aspect of the phenomenon of AP expansion through subsidization. The Justice Judgment model, a byproduct of Equity Theory, highlights the need for distributional equity in addition to a cost/benefit measurement for determining whether the allocation of resources is fair to stakeholders. With the view that equity must be multidimensional, Leventhal contended that fairness must not only be based on contribution value, but also on a needs rule which dictates that individuals with greater need should receive greater assistance (Leventhal, 1976).
in the greater distribution of resources to students who are in the most need of such resources. In the context of the study, the fee waiver practice of alleviating financial burden for those with fewer financial resources such that these students have an
opportunity engage in competitive, higher-level assessments coincides with Leventhal’s “needs rule” of distributive justice.
In the broader realm of education, the concept of equity often coincides with the concept of fairness. Although it is often used interchangeably with the related principle of equality, equity embodies a wide variety of strategies, financial models, and educational programs that are often employed in the interest of what is fair, but may not necessarily be equal. The adage “equity is the process; equality is the outcome,” is relevant to the discussion given that equity may not reflect strict equality in the process of educating students when we measure what is applied, allocated, or distributed. It is in this vein that Leventhal’s Justice Judgment Theory validates legislative actions in an effort to remove financial obstacles hindering student achievement, thus, distributing more financially to students who have fewer financial resources.
Researcher assumptions regarding AP participation and testing trends take root in Change Theory, in which planning educational reform initiatives and legislation begin with long-term goals of interest, followed by a reflective and purposeful connection between actions and outcomes (Weiss, 1995). Originally attributed to a roundtable committee of methodologists concerned with community-based change initiatives,
Change Theory emerged as the recognition of the relationship between strategy and result in complex systems.
Change Theory (also known as Theory of Change) functions as a causal model by identifying several steps which link program inputs to observable outcomes. Steps are determined by the complexity of task or scope of reform and vary accordingly; however, generally defined, Step 1 begins with the identification of long-term goals. Step 2
specifies backward mapping and purposeful connections between and among outcomes with the goal of generating an actionable framework. Step 3 involves the identification of assumptions, which is a critical step in accurately assessing the landscape of factors influencing the identified problem or phenomena. Step 4 delineates the development of measurement of initiative effectiveness. Finally, Step 5 identifies interventions that should be implemented to achieve specified targets (Organizational Research Services, 2004). Though these step descriptions represent a simplification of the complex Change Theory, the adaptability of the model to suit complex initiatives makes Change Theory appropriate for reflection on education program efficacy and purposeful revision. Indeed, Weiss, Murphy-Graham, and Birkeland contend that such evaluation serves any of three purposes: to provide guidance for policy and practice, validate pre-existing programs or systems, or propose new hypotheses, initiatives, or solutions (Weiss, Murphy-Graham, & Birkeland, 2005). The AP grant program in Colorado would benefit from all three
functions.
Beginning with the long-term end goal of gender, racial, and socioeconomic balance in academic achievement, reform initiatives at all levels have subsequently identified teacher training, rigorous preparatory coursework in advance of AP course participation, adequate materials, and expansion in course offerings as the means to
achieving this end. Presumably, the consistent practice of granting fee waivers and an increase in students who qualify for them would increase (a) the percentage of students participating in AP examinations and (b) exam performance for these students. Results of the analysis are discussed and recommendations made with regard to Change Theory for future AP funding initiatives in chapter 5.
Research Questions
The focus of the study was to explore whether additional funding aimed at narrowing the participation and achievement gaps in AP exam-taking between students who qualify for free and reduced price lunch and those who do not has succeeded at the school level within the state of Colorado. The dataset compiled was used to explore the following research questions:
Research Question 1: Do fee waiver students and non-fee waiver students have significantly different passing percentages on Advanced Placement tests?
Research Question 2: Is there a significant relationship between AP exam
participation and school FRL percent, district size, percentage of fee waiver students, and school year?
Research Question 3: Is there a significant relationship between AP fee waiver exam passing and school FRL percent, district size, percentage of fee waiver students, and school year?
CHAPTER TWO
REVIEW OF THE LITERATURE
The review of literature included ERIC and Sage searches of all relevant topics within the conceptual framework of the study, a search of all related topics, titles and datasets from the College Board, NCES, and Colorado Department of Education
websites, and titles from LexisNexis policy index searches. The review is arranged in the following ten sections beginning with Operational Definitions and following with The Low-income Achievement Gap, AP Program Expansion and the Achievement Gap, College Board Equity Statement, Test Gee Grant Program as National Education Policy, ESCAPE: The Federal Grant Plan of Colorado, Rationale for State Focus on Colorado, Advanced Placement and the Low-income Participation Gap, Advanced Placement and the Low-income Achievement Gap, and Outcomes of Rapid Advanced Placement Expansion.
Operational Definitions
The following operational definitions define constructs and serve to standardize discussions of the intricacies of Advanced Placement testing and legislation.
Achievement gap. Refers to the observed, persistent disparity of educational measures between the performance of groups of students, particularly those categorized by socioeconomic status (SES), gender, and race/ethnicity. For the purposes of this study, participation and achievement gaps of low-income students are the focus of analysis.
Advanced Placement (AP) program. Created by the College Board, the Advanced Placement program offers college-level curricula and examinations to high school
students in 20 subject areas (37 courses). United States colleges and universities often grant placement and/or course credit to students with passing scores on the examinations; generally, scores of 3, 4, or 5 are accepted as indicators of college-level proficiency.
Advanced Placement exam. Rigorous, multi-disciplinary assessments administered in high schools in May as culminating assessments of college-level
coursework mastery. High school students can be granted college placement, earn college credit, or both for qualifying AP exam scores.
College Board. Founded in 1900, the College Board was created to expand access and establish readiness criteria to assist both students and higher education institutions in college admissions. Programs include the SAT test and the Advanced Placement
Program.
ESCAPE (Eliminating Student Cost for AP Exams) program. The federal AP Exam Fee Waiver Program in Colorado, ESCAPE grants funding to eligible state educational agencies to pay advanced placement test fees for eligible low-income students. The specified goal of the program is to increase the number of low-income students who participate in AP testing and increase the number of students who receive scores which qualify them for college credit or placement (Colorado Department of Education, 2016).
Fee waiver/Fee reduction. To offset the costs of AP exam participation, the College Board offers payment assistance in the form of a fee waiver or fee reduction for students who qualify according to the economic-need guidelines created by the federal government. In conjunction with state and local subsidies, AP exam costs to the students
are reduced to $12, and in many cases, are completely covered for qualifying students (Colorado Department of Education, 2016). For the purposes of this study, “fee waiver students” refers to students who both qualify for free and reduced price lunch and who elect to utilize a fee waiver toward completion of an AP exam.
Free and reduced price lunch. Students from families with household incomes at or below 130 percent of the poverty level are eligible for free meals in school. Students from families whose incomes are between 130 and 185 percent of the poverty level are eligible for reduced-price meals. Combined, this figure represents the total percentage of students eligible for free or reduced-price lunch (FRL) under the National School Lunch Program. FRL also provides a proxy measure for the concentration of low-income students within a school (United States Department of Agriculture, 2014).
Low-income student. A student who qualifies for financial assistance through qualification for the Free and Reduced Price Lunch program, and thus, for fee waiver assistance in AP exams.
The Low-Income Achievement Gap
Equality of Educational Opportunity, commissioned by the U.S. Congress in 1965, was the first extensive study conducted for the purposes of identifying achievement gaps in the American education system and shaping subsequent school policy (Coleman, Campbell, Hobson, McPartland, Mood, Weinfeld & York, 1966). Initiated in response to the Civil Rights Act of 1964, American sociologist Coleman and his colleagues (1966) sought comprehensive answers to the questions of the scope and prevalence of
“The Coleman Report,” as it came to be known, was the first research-based study to confirm gaps in assessment outcomes among students of various ethnic and
socioeconomic backgrounds. The study showed that student achievement outcomes differed based on school characteristics, but such differences were less important than student financial backgrounds. Researchers also found that per-pupil expenditures did not significantly affect student achievement, but student socioeconomic background and teacher effectiveness did have an effect (Coleman et al., 1966). This seminal report became not only a model for educational research, but also a principled catalyst for subsequent reform.
An expansion of measurements, subsidies, and researchers seeking to understand and remedy such inequities followed the Coleman study. Current research findings indicate that the achievement gap between low and high socioeconomic students persists, and in some cases, has gradually widened since the 1960s. Researcher Reardon (2011) examined the relationship between rising income inequality in the U.S. and a widening in the achievement gap between high- and low-income families. The study indicated
sobering findings: Not only has the achievement gap widened as income disparity has widened nationally, this gap is 30%-40% greater for students born in 2001 than it was for students born in 1976. Additionally, the income achievement gap was now larger than the black-white achievement gap (Reardon, 2011). The report concluded that the income achievement gap has been growing, rather than shrinking, over the past fifty years; furthermore, no examined age cohort in the study demonstrated a narrowing of this gap as students age (Reardon, 2011).
In a successive large-scale study expanding on his earlier work, Reardon et al. (2016) continued research on the achievement gap by compiling the most comprehensive collection of national student assessment data to date; the database currently holds 200 million K-12 student test scores. Because no single achievement assessment is
administered nationwide, Reardon and his colleagues linked data from all statewide assessment score scales to the scale of the National Assessment of Educational Progress to examine testing trends at the district level, on a national scale (Reardon et al., 2016). Researchers found that nearly every school district with high enrollment figures of low-income students had an average academic performance that was significantly below the national grade-level average. Additionally, average performance levels between the most and least socioeconomically advantaged districts were more than four grade levels apart (Reardon et al., 2016).
Repeatedly confirmed in studies ranging from Coleman’s (1966) era to Reardon’s (2013) more recent work, the achievement gap for low-income populations of students has persisted in statewide assessments (National Assessment of Academic Progress, 2015), standardized college readiness measures (Reardon, 2013), high school graduation rates (DePaoli, et al., 2015), college graduation rates (Bailey & Dynarski, 2011),
academic readiness at the onset of kindergarten (Duncan & Magnuson, 2011), and in both math and reading content areas (Lee & Orfield, 2006; National Center for Education Statistics, 2014). Current findings suggest that the low-income achievement gap now reflects a greater disparity in achievement between low- and high-income students than
comparisons of gender or racial achievement gaps (Duncan & Magnuson, 2011; Reardon, 2011).
AP Program Expansion and the Achievement Gap
Utilized in federal mandates for equity accountability as well as promoted as the model for higher achievement and college readiness, the College Board Advanced Placement (AP) program has enjoyed enormous growth with the charge of raising accessibility and academic standards within the high school classroom. School
administrators nationwide are engaged in reform efforts to minimize the AP participation and performance gaps and ensure that all students have equitable opportunities to
participate in advanced coursework and thus, access higher education. Within this context, the availability of advanced placement (AP) programming has become significant.
Advanced placement courses have become synonymous with rigorous secondary academic programming nationwide. The Advanced Placement program provides
opportunities for high school students to complete college level coursework while enrolled in high school. There are currently 37 AP courses in 20 different subject areas. Culminating spring AP exams are widely acknowledged by higher education institutions nationwide as comparable representations of college curricula. In many high schools, students who achieve passing scores on AP exams may be exempted from state-mandated high school assessments that are required for graduation (Aratani, 2006).
The rise in popularity of the Advanced Placement program in the American education system cannot be disputed and is widely recognized; however, the
pervasiveness of the program in college and university admissions procedures is worthy of note. In the admissions process, colleges routinely award application credit for AP course participation without regard to AP exam scores. The University of Michigan weighs the rigor of the candidate’s high school curriculum when considering a student’s application and grants extra application points for AP course completion (Dougherty & Rutherford, 2010). Often, letter grades earned in AP courses are weighted in high school grade point average calculations. A student who takes AP courses and excels in those courses, whether s/he takes the exams or not, earns an additional point for the course in grade point calculation. In turn, many universities, such as those belonging to the University of California system, grant applicants five points for an A in an AP course rather than the traditional four, making participation in AP an additional valuable GPA boost (Burdman, 2000). The weighted AP grade has the potential for increasing a student’s cumulative grade point average and strengthening the student’s application, as college admissions processes rely heavily on student GPA. Whether the student takes the AP exam or not, AP course enrollment indicates to college and university admissions officers that a candidate is experienced with college level coursework, though students who perform well on AP exams are more likely to be accepted by higher education institutions and be better prepared for the rigors of college curricula (Rothschild, 1999).
According to a 2000 survey of 962 four-year public and private colleges and universities, AP participation (exclusive of test-taking) factors directly or indirectly into five of the six most important considerations for college admissions: (a) high school GPA or class rank; (b) SAT/ACT scores; (c) pattern of high school coursework; (d) AP course
designation, International Baccalaureate (IB) program enrollment, or dual-credit coursework; (e) AP coursework alone; and (f) AP course grades (Breland, Maxey, Gernand, Cumming, & Traipani, 2002; Klopfenstein & Thomas, 2010). AP courses are often “weighted,” regardless of completion of the exam, which is reflected in a student’s GPA. Admissions officers also consider the number of AP courses a student completes. A 2005 survey of 539 public and private four-year and two-year colleges and universities showed that 91% of post-secondary institutions consider AP course completion in the admissions process (Sathre & Blanco, 2006). Because of these practices, it is the logical conclusion that K-12 schools must follow the precedent set forth by colleges and
universities in admissions practices to remain college preparatory institutions. Secondary schools undoubtedly feel pressure to offer more advanced courses, regardless of whether they can support these courses with adequately trained teachers and financial resources. Furthermore, graduates who earn credit for AP courses and exams are more likely to complete a bachelor’s degree in four years or less than are non-AP participants (Dougherty, Mellor & Jian, 2006). For these reasons, it is clear that excelling in AP classes and/or on AP exams is critical for students to access higher education options and ensure academic preparation for college work.
The AP program has expanded over the past decade. According to The 10th
Annual AP Report to the Nation (2014), the number of exams administered nationally has risen dramatically from 1,328,511 in 2003 to 3,153,014 in 2013 (College Board, 2014). Further, just over one million of all graduates in the national class of 2013 took at least one AP exam during their high school careers. While participation has increased, students
have been achieving at higher levels on AP exams as well. In 2013, 607,505 U.S. public high school graduates scored a 3 or higher on an AP Exam during high school (College Board, 2014a). Legislation has followed on the heels of AP’s successes. In 2009, The AP Incentive and Test Fee programs received $43 million in federal subsidies, which are supplemented at the local level in 47 states through teacher training, fee waivers, scholarships and teacher bonuses (Gallagher, 2009). In 2013, The U.S. Department of Education awarded $28.8 million in grants to 42 states to pay a portion of the cost to low-income students for taking Advanced Placement (AP) exams (United States Department of Education, 2013). The widespread investment in AP programming has succeeded in expanding opportunity to all secondary students, and the intended outcome of this increased funding, namely increased access to AP programming to often underserved populations, has made gains. However, the specific examination of access and
performance gaps based on financial need warrant further examination.
The College Board reported increased AP exam participation of students from all ethnic backgrounds, yet, while 48.1% of K–12 U.S. public school students qualified for the free or reduced-price lunch program in 2013, only 27.5% of AP exam takers were in this same category in the graduating class of 2013 (College Board, 2013). Clearly, more work is needed on the part of schools to address the access gap if AP exam participation is to serve as the standard for equal opportunity between socioeconomically
disadvantaged and advantaged student populations. Commendably, The 9th Annual AP Report to the Nation has emphasized the equity gap in AP participation and performance for lower-socioeconomic and minority students (College Board, 2013). These students
remain underrepresented not only in the high school AP classroom and in the population of successful college-bound students, but also among Americans with a college degree (Tai, Liu, Almarode, & Fan, 2010).
College Board Equity Statement
Since its inception in 2003, the annual AP Report to the Nation has noted the equity gap in AP participation and performance for traditionally low-income and
minority students, and the College Board has been a willing participant in discussions on educational equity. The College Board has aligned its position on inclusion, access, and equity with federal and state legislation aimed at assisting low-income and minority students gaining access to rigorous college preparatory coursework. Entitled “Achieving Equity,” the College Board's Equity and Access Policy Statement affirms:
The College Board strongly encourages educators to make equitable access a guiding principle for their AP programs by giving all willing and academically prepared students the opportunity to participate in AP. We encourage educators to eliminate barriers that restrict access to AP for students from ethnic, racial, and socioeconomic groups that have been traditionally underserved; make every effort to ensure their AP classes reflect the diversity of their student population; provide all students with access to academically challenging coursework before they enroll in AP classes. Only through a commitment to equitable preparation and access can true equity and excellence be achieved. (College Board, n.d.)
College Board researchers Edwards and Duggan presented “Data-Based Decision Making: The Road to AP Equity,” in which equity as a statistic is described as both a means for advancing strategic interventions and a measure for evaluating progress via mathematical comparison. On behalf of the College Board, the researchers further clarified equity in education as a condition in which all students have access to needed supports in order to meet and exceed a common standard (Edwards & Duggan, 2012).
These value statements were previously delineated in access and achievement initiatives sponsored by the College Board and the priority of equitable access in AP programming has often been echoed through the yearly AP Report to the Nation (College Board, 2008, 2009, 2010, 2013).
In light of the concerted, unifying efforts of the U.S. Department of Education, the College Board, and state and local education agencies to direct attention and resources to underserved and underperforming populations and thereby decrease the achievement and access gaps, the question remains: have these efforts worked?
Test Fee Grant Program as National Education Policy
The increase in the AP participation of socioeconomically disadvantaged and minority students over the past ten years can be attributed in part to the Advanced Placement Incentive Program and the Advanced Placement Test Fee Grant program authorized by the United States Department of Education (Access to High Standards Act, 2001). The Act authorizes reimbursement to low-income students to offset advanced placement test fees. The recipients of these financial awards (national, state, or local education agencies) must serve students in schools where at least 40% of the student body is low-income to meet eligibility requirements. Additionally, a student who qualifies for free and reduced price lunch is eligible to receive individual financial assistance in the form of government subsidies in the event the school she attends does not qualify at the 40% threshold. Specifically, a student is eligible for the AP exam fee reduction on all AP exams she takes in a school year if (a) her family’s income meets or falls below 185% of the poverty level issued annually by the U.S. Department of Health
and Human Services, or if (b) she qualifies as an "identified student" through foster care or Head Start enrollment, homeless or migrant status, or residence in a household that receives SNAP/Food Stamps, TANF cash assistance, or the Food Distribution on Indian Reservations benefits (United States Department of Agriculture, 2014).
Title I, Part G of the No Child Left Behind Act of 2001 focuses on improving the academic achievement of the socioeconomically disadvantaged in the area of Advanced Placement programs. Section 1001 of the Act states, “The purpose of this title is to ensure that all children have a fair, equal, and significant opportunity to obtain a high-quality education and reach, and at a minimum, proficiency on challenging state academic achievement standards and state academic assessments” (United States Department of Education, 2002, section 1001, paragraph 1). Subsection 3, elaborating on the modes of application of section 1001, states that this purpose can be accomplished by “closing the achievement gap between high- and low-performing children, especially the achievement gaps between minority and nonminority students, and between disadvantaged children and their more advantaged peers” (United States Department of Education, 2002, section 1, paragraph 3). Though Advanced Placement testing is not indicated as the measurement tool for “closing the achievement gap” in this subsection, measurements of gifted and talented programs and their impacts on underserved student populations are specified in later subsections.
Sections 1701-1707 of Title I of the No Child Left Behind Act of 2001, often referred to as the “Access to High Standards Act,” outline the purpose, funding
to supplement, rather than supplant, programs already in place for advanced placement studies. These are the purposes of the Act:
(1) to support State and local efforts to raise academic standards through
advanced placement programs, and thus further increase the number of students who participate and succeed in advanced placement programs…(5) to
demonstrate that larger and more diverse groups of students can participate and succeed in advanced placement programs…(6) to provide greater access to advanced placement and pre-advanced placement courses and highly trained teachers for low-income and other disadvantaged students…(8) to increase the participation of low-income individuals in taking advanced placement tests through the payment or partial payment of the costs of the advanced placement test fees (United States Department of Education, 2002, sec. 1702).
The Advanced Placement test is used throughout these sections to refer to an advanced placement test administered by the College Board, the publishing and
governing body of the nationally recognized Advanced Placement program. Though the specifications of the “Access to High Standards Act” do not address advanced placement program expansion as the measure of closing the access or achievement gap, the overall intent of Title I, the practice of mandating 50% of the disbursement of total advanced placement funding toward at-risk populations and the declared intent for more diverse participation and greater success of low-income students make the intent clear. AP exam fee subsidies hold the distinction of being the most prominently utilized federal incentive approach for supporting AP programs.
The push to expand AP participation has spread to state legislatures. The Education Commission of the States (ECS), a nonpartisan organization that provides policymakers with education information, policy research, and analysis of education issues, recommends that all states adopt a comprehensive state AP policy. Adoption has
been swift. State mandates range from all high schools offering AP courses (Arkansas, Indiana, South Carolina, West Virginia) to all districts offering AP (Mississippi). Most states offer compensation to students for AP exam fees, financial incentives to schools for achievement, and training for AP teachers (Education Commission of the States, 2010). Following such legislation, federal and state education agencies now make substantial investments in AP. The Education Commission of the States provides guidelines for drafting AP policy statements; thirty-seven state education policies currently specify the College Board Advanced Placement Program by name (Dounay, J. & Education
Commission of the States, 2006). Forty-seven states supplement federal money with state and local grants (Gallagher, 2009).
The AP program has woven its way into the fabric of our education policy; however, we should carefully consider whether the practices surrounding the College Board program truly effect positive change for students most in need.
ESCAPE: The Federal Grant Plan of Colorado
In 2003, the Colorado Department of Education introduced ESCAPE: Eliminating Student Cost for Advanced Placement Exams as the plan for implementing the current federal grant program (Colorado Department of Education, 2003). The ESCAPE fee waiver program validates the Colorado Department of Education’s dedication to rigorous standards, challenging assessments and valid accountability measures for all. The
program removes the obstacle of exam fees and upholds the State Board of Education’s mission of equal access to educational opportunities through suitable learning
and participating in advanced coursework. ESCAPE provides the Colorado Department of Education with funds to pay advanced placement (AP) fees for low-income students. (Colorado Department of Education, 2016). The 2014-2015 AP exam cost was $91.00 for qualifying students. The College Board reduced the AP exam fee by $29. The ESCAPE federal grant paid $41 per AP exam. In most cases, high schools waived the $9
processing fee. Low-income students/their families paid $12 (though in many cases, the school paid the $12). Payment was made through direct billing between the CDE and College Board; the portion of payment due by the high school was deducted from the total invoice to the College Board (see Appendix E for ESCAPE fee waiver form).
In addition to the ESCAPE Grant, which assists students in need on an individual basis, the Colorado Department of Education has recently established The Advanced Placement Incentives Pilot Program, created to assist with the implementation and/or expansion of AP programming in order to build capacity for increased participation in rural and small rural school districts across Colorado. The Advanced Placement
Incentives Pilot Program began during the 2014-15 academic year. In 2015, the program awarded $237,500 to ten participating high schools in nine school districts across
Colorado. These districts and schools represent a diverse cross-section of Colorado’s small rural school districts and served 475 students in making AP a reality. Priority funding is allotted to public high schools with a percentage of students who are eligible for free and reduced price lunch that exceeds the statewide high school average of 38% (Colorado Department of Education, 2014a).
Passing federal and state legislation focused on improving education for all and establishing accountability measures for state and local education agencies has ushered in a new era of educational oversight and demanded an unprecedented degree of
transparency. States and local districts have complied, targeting AP course expansion and increased AP exam performance as the earmark for college and career readiness. State education agencies have begun the arduous task of reforming evaluation processes and publicizing performance data for schools in response to federal legislation.
Rationale for State Focus on Colorado
Colorado is one of the most geographically diverse states in the U.S. Elevation varies from 3,315 feet above sea level along the Arikaree River near Wray to the 14,433-foot peak of Mount Elbert, the highest point in the Rocky Mountains. The average
altitude is roughly 6,800 feet, making Colorado the highest state in the contiguous United States (United States Geological Survey, 2016). Coloradoans relate locations by physical region, such as "Western Slope," "Front Range," “Palmer Divide,” and "Eastern Plains." If a visitor plans a trip for the day, s/he should depart prepared for a 50-degree range in temperature and vacillating precipitation. This visitor may explore the largest and quickly growing city of Denver, and then travel 7.4 miles to Lakeside Town, a municipality situated in the shadow of an amusement park, which steadfastly maintains its population of 8 (United States Census Bureau, 2015).
Not unlike the geography and climate, the students of Colorado are equally diverse. Students work on ranches in Brighton and negotiate ski slopes in Aspen. Students claim various religious and political affiliations. Students of migrant working
families and students of military families call Colorado home, and there is no one typical Colorado high school student. In Colorado, 42.2% of students were eligible for free or reduced-price lunch during the 2015-2016 school year (Colorado Department of
Education, 2016). Almost half of the 132 school districts that offer AP programs pay the AP exam fee, though no research has yet determined if this policy has positively affected AP participation or scores on AP exams (Colorado Department of Education, 2016). Depending upon the number of AP exams students take in a district, a school district’s financial contribution could be substantial. It is advantageous, therefore, to attempt to determine the impact that these financial incentives are having on student enrollment and achievement in advanced placement courses.
In 2014, the College Board released The 10th Annual Report to the Nation that highlighted the collective achievement of Colorado students on the 2013 AP exams. Overall, Colorado ranked ninth nationwide for the percentage of the class of 2013 scoring a three or higher on Advanced Placement (AP) exams, according to The 10th Annual AP Report to the Nation, released by the College Board (College Board, 2014b). Previously, four Colorado school districts were highlighted in the fourth annual AP Honor Roll, which recognizes school districts that increase both AP programming and the percentage of students passing AP exams. Colorado honorees were Denver Public Schools,
Gunnison Watershed School District RE-1 J, Lewis-Palmer School District #38 and Telluride School District R-1. Denver Public Schools was one of 19 districts honored nationally for expanding student representation in AP to over 25% for both low-income and minority student populations. Also noted in the press release was the percent
improvement rate over time: Colorado ranked tenth in the nation for increasing the percentage of exam participants scoring a 3 or higher on an AP exam over the past ten years (College Board, 2008).
These accomplishments were noteworthy and certainly indicative of the concerted effort on the part of national and state education agencies to expand advanced course offerings and increase student achievement in such courses. However, the 25% increase of both low-income and minority student participation (Denver) represented a different sample than the achievement increase, which refers to all graduates. As of yet, there has been no examined link between the increased participation and corresponding
achievement for the same group of low-income students.
Advanced Placement and the Low-income Participation Gap Many studies have documented the limited quantity and narrow variety of AP courses available in low-income urban and rural schools in the U.S. (Klopfenstein, 2006; Zarate & Pachon, 2006). Researchers in several states have sought to study the access disparity, both in course offerings and exam participation, as they relate to funding.
The state of Texas received substantial federal AP subsidies, yet students in high-poverty and rural schools continued to have limited access to AP courses, and ethnic minority students continue to be underrepresented in AP course programs (Klopfenstein, 2004). Further noted in the study was the state’s tendency to subsidize testing fees for students, rather than program expansion, teacher training, and course materials. While many students decided whether to sit for the exam in May during their AP coursework, many Black, Hispanic, and low-income students declined to enroll in such classes,
indicating a weak infrastructure for preparing students for the rigors of AP coursework (Klopfenstein, 2004). Klopfenstein further concluded that Black and Hispanic high school students enrolled in Advanced Placement courses at approximately half the rate of white students, despite funding efforts.
Zarate and Pachon (2006) revisited the AP access question initially studied at the onset of the AP rise to prominence in the mid-1990s; earlier findings concluded that programs with college-level challenges were not available to all students in California. The 2006 study results concluded that AP access remained an improbable opportunity for Black and Latino students and many low-income/rural students regardless of ethnicity in the state of California. As the study was concluded at the onset of No Child Left Behind legislation, it does not reflect changes in funding specifically mandated and directed to the expansion of AP programs in disadvantaged areas.
In a later study, Hallett and Venegas (2011) explored the Advanced Placement access question with regard to the academic quality of coursework, noting that although more opportunities exist for disadvantaged students to enroll in AP courses in California, the curricular quality of courses in low-income, urban schools does not adequately
prepare students for the rigors of college coursework or the AP exam (Hallett & Venegas, 2011). Perhaps Hallett and Venegas encompassed the true issue in their belief statement: “We appreciate the need for increased equity in course offerings but iterate the need for equity in course quality, not just the number of courses available” (Hallett & Venegas, 2011, p. 471). Further assessing education expenditures, Hill rightly stated, “Though no one seriously argues that more spending could never lead to school improvement, there is
reason to fear that without changes in the way funds are spent, Americans could end up with a more expensive, but not necessarily more effective or equitable, system of public education” (Hill, n.d.).
Darity and fellow researchers analyzed the underrepresentation of minority students in honors courses, Advanced Placement courses, and gifted programs in North Carolina and were concerned with the identification of qualified students for such programs, rather than the availability of them within the schools. Authors introduced the Disparity Index, which functioned as a summary statistic in using the ratio of the
percentage of minority students in advanced courses or programs to the percentage of minority students enrolled in the school (Darity, Castellino, Tyson, Cobb, & McMillen, 2001). Through the use of the disparity index, authors illustrated that the gap in
enrollment in AP courses between minority students and their white counterparts is much larger than often reported, contending that the issue of “access” is a more complicated interaction of educational processes, rather than mere course availability.
From these studies we may conclude three things: (a) “access” pertains to the availability of courses within a district as well as an evident discrepancy in student inclination to enroll in AP courses; (b) the quality of AP courses and the necessary preparatory coursework is vital to student success; and (c) funds targeting underserved or underrepresented students must be disbursed to schools and districts with specific, comprehensive program reform initiatives aimed at improving the infrastructure of both school and services. Of particular interest to this study is Darity’s use of a disparity index
for assessing minority representation in AP course enrollment, as reflected in the second of the three research questions encompassed in this study.
With a similar concern for low-income students and their representation in AP coursework, the Denver Public School District commissioned researchers to examine student participation in Advanced Placement coursework and their subsequent college enrollment and persistence for the graduating classes of 2002-2007 (Buckley & Muraskin, 2009). First noted in the Denver report was the unique demographic
composition of the student population: When averaged over the course of the study, 55% of the district’s students were Hispanic, 18% were African American, and 23% White. From among the total population, 66% were eligible to receive free or reduced-price lunch. From among the students who enrolled in one or more AP course, 40% were Hispanic, 46% were African American, and 62% White (Buckley & Muraskin, 2009). The study found that low-income students who participated in at least one advanced placement course enrolled in postsecondary coursework at a greater frequency than low-income students who did not participate in advanced placement coursework. The study also concluded that of those students who enrolled in college within one year of high school graduation, AP participants were more likely to persist in college, with
postsecondary efforts culminating in a 4-year degree (Buckley & Muraskin, 2009). The study did not make use of a Disparity Index, which would have noted that although White students account for 31% of the total demographics, 62% of that population participated in one or more advanced placement offering. AP exam performance was not addressed in the study.
Geiser and Santelices (2004) determined that students who enrolled in AP courses and took the culminating exams were likely to outperform non-AP participants;
furthermore, the researchers found AP participation to be positively related to degree attainment (Geiser & Santelices, 2004). Similar study results indicate that fee-waiver AP examinees have a higher likelihood of enrolling, persisting, and graduating from four-year colleges, when compared to their socioeconomically similar peers who do not take AP exams (Godfrey, Wyatt & Beard, 2016).
Worthy of note in these studies is the district-level nature of the analysis. Both North Carolina, particularly in its urban areas, and Denver Public Schools (a district with 31 high schools), vary widely in socioeconomic makeup of clientele, resources, and performance. To use district mean demographics to encapsulate the AP experience, and further still, measure success, falls short of capturing the true local experience of the student and paints a picture of a school that might be inaccurate. The educational experience a student receives at Denver Manual High School may differ significantly from the experience of a student who hails from Denver North. The low-income population may vary widely, the number of AP courses offered may differ, the school policy on AP exam participation may differ, the preparatory courses offered as part of the AP pathway at one school may greatly surpass those of another. For an adequate measure of prevalence and success of an AP program, the study must be conducted at the school level and follow AP participation on the AP exam and level of success on the exam. The additional benefit of a school-level study is a consistent look at intra-school variability in terms of such factors as number of AP courses available, teacher quality, variations in
exam cost, gatekeeping, among others. In other words, despite socioeconomic standing, students within the same school would theoretically have the same opportunities (and obstacles) with regard to advanced placement coursework. The number of available AP course offerings within a school would theoretically apply to all students; an exceptional AP teacher would benefit students in her classroom regardless of their backgrounds. If they exist, gatekeeping practices (though discouraged by the College Board) would be in effect for the entire school population, and preparatory coursework leading up to
advanced placement enrollment would be comparable.
Advanced Placement and the Low-income Achievement Gap
In 2008, researchers Handwerk, Tognatta, Coley, and Gitomer combined College Board data on AP exam participation and performance with the U.S. Department of Education’s Common Core of Data’s 2003-2004 Public Elementary and Secondary Universe Survey Data. Combining data from two national datasets yielded approximately 22,000 U.S. public high schools which were categorized based on school characteristics. The rationale for undertaking the study was to examine the availability, participation, and prevalence of college credit earnings resulting from the AP experience, and because examining the average rates of participation and performance in the AP program can obscure important differences in the availability and quality of educational programming for students depending on school type (Handwerk et al., 2008). The ETS study
categorized high schools into “Low-AP” (schools offering at least one AP math course) and “High-AP” (schools offering at least one math, science, and English course) and examined the ethnicity, socioeconomics, and urbanity of the school settings. The research
indicated that less than 1% of low-income students, as measured by free and reduced price lunch eligibility, took an AP exam in schools that offered AP exams, and that these low-income students are consistently engaging in AP coursework less frequently than their more advantaged peers, regardless of the type of school they attend—urban or rural, large or small, low-AP or high-AP. Additionally, researchers found that qualification for AP or college course credit is also related to income status. The report noted that “across most levels of AP program intensity, regardless of cluster, the median proportion of low-income students participating in the AP program and earning a grade that will gain them college credit and/or placement is 0 percent” (Handwerk et al., 2008 p. 23).
Researcher Jeong (2009) sought to answer the question of whether financial incentives succeeded in prompting students to both enroll in AP coursework and succeed in AP exams. An analysis of nationally representative AP exam data taken from the Education Longitudinal Study of 2002 determined that “AP exam fee exemption, the most prevalent incentives, leads to an increase in the likelihood of AP course enrollees taking the exam—in particular, the disadvantaged” (Jeong, 2009, p. 346). Jeong found that AP exam fee exemption had a significant impact on the likelihood a student will complete an AP exam, particularly if that student is low-income. Jeong remains optimistic, concluding that “AP exam subsidies can serve as an effective policy instrument to reduce socioeconomic disparities in AP exam participation and thereby broaden access to further educational opportunities leading to social equality” (Jeong, 2009, p. 363).
Despite educators’ strides to provide traditionally underserved students with access to AP courses, research indicates that these students do not consistently receive adequate preparation for the demands of college level coursework (Lee & Burkham, 2002). Although some recent research indicates simple exposure to college-level standards inherent in AP courses can lead to greater college success (even for those students who score 1 or 2 on an AP exam), the likelihood of college success is greater for those students who score a 3 or higher (Sadler & Sonnert, 2010). Research consistently finds a passing score of 3 to be predictive of college readiness (Tai et al., 2010). Major initiatives must continue to ensure adequate preparation of low-income students early so that all students will have an equitable chance at success when enrolled in AP courses and exams. However, increased funding and focus on raising participation and
achievement for socioeconomically challenged students does not tell us whether achievement has improved since the Handwerk et al. (2008) study.
Outcomes of Rapid Advanced Placement Expansion
Evidence suggests that a side effect of rapid AP expansion may be an increase in course credit inflation (Dougherty et al., 2006). AP exams are therefore designed to validate the courses offered in high schools through a standardized measure of college-level skill attainment. A key concern has been to monitor whether AP courses cover material of content value, requisite complexity, and appropriate challenge, and thus maintain the high quality of the programs. This also has been a challenge for the College Board, which has implemented an AP course audit system to ensure that all courses labeled “AP” in course catalogs and student transcripts meet college-level standards.