Older adults' self-rated health and differences by age and gender:
A quantitative study
Karin Josefsson 1*, Marie Andersson 2, Annika Erikstedt 2
1 Faculty of Caring Science, Work Life and Social Welfare, University of Borås and School of Health, Care and Social Welfare,
Mälardalen University, Eskilstuna, Sweden 2 County Council Sörmland,Eskilstuna, Sweden Abstract
Background: The older adult population is expected to grow, presenting potential challenges for individuals and
society. Maintenance of older adults’ health will be an important factor for healthy aging. It will also be a challenge for health professionals who work to promote health and care equity. To promote healthy aging and equal care, an overview of older adults’ rated health is needed. The aim of this study was to describe self-rated health among older adults’ living at home describe age group and gender-based health differences.
Methods: A descriptive and a comparative cross-sectional study. The questionnaire study was part of a Swedish
national population study. Randomly selected older adults 65–84 years living in five counties in central Sweden. The response rates were 79% and 75% for those 65–79 years and 80–84 years, respectively. Participants (n = 13922) were divided into two age groups: 65–79 years (n = 5926 male, n = 5755 female) and 80–84 years (n = 1208 male, n = 1033 female).
Results: Older adults generally self-rated their health as good, especially in the age group aged 65–79 years.
Females self-rated their health as poorer than males, especially among those aged 65–79 years. Gender-based health differences decreased in those aged 80–84 years.
Conclusions: It is important to address these gender-based health differences; health policies and programmes
are needed that promote equitable healthy aging.
Citation: Josefsson K, Andersson M, Erikstedt A (2016) Older adults' self-rated health and differences by age and gender: A quantitative
study. Healthy Aging Research 5:1. doi:10.12715/har.2016.5.1
Received: July 26, 2015; Accepted: January 11, 2016; Published: January 25, 2016
Copyright: © 2016 Josefsson et al. This is an open access article distributed under the terms of the Creative Commons Attribution
License, which permits unrestricted use, distribution, and reproduction in any medium, provided the original work is properly cited.
Competing interests: The authors have declared that no competing interests exist. * Email: karin.josefsson@hb.se
Introduction
It is estimated that by 2050 the global population of those 60 years or older will reach 21% [1]. Sweden and Italy have Europe’s largest population proportions of older adults. In Sweden, 1.7 million (18%) of the population is 65 years or older [2]. The average lifespan in Sweden is 79 and 83 years for males and females, respectively. In 2060, the number of older adults in Sweden is expected to be 2.7 million [1]. Most forecasts predict an increased number of older adults in the Western world [3]. However, there is no
accurate prediction of what proportion of adult life years will be healthy.
Average life expectancy continues to rise in Sweden, primarily as a result of the significant decrease in mortality rates for cardiovascular diseases, and more so among men than women [4]. Women live longer than men. Cancer is a relatively more common cause of death, despite mortality due to cancer decreasing over time. Stroke has decreased among women and men over the age of 65. The incidence of myocardial infarction has also declined mostly among people above retirement age. However, some health
differences remain or are increasing. There are health differences between groups with different educational backgrounds. All the major causes of death in the population, such as cardiovascular disease, stroke, cancer, accidents, suicide and alcohol-related illnesses are more common among those with less education [4].
Healthy aging is also influenced by a variety of interacting determinants, including lifestyle and living conditions, social networking, socio-economic status, educational background and living environment [5, 6, 7]. Older adults’ health is related to their ability to adapt to and compensate for their disabilities [8]. Their health experience has been described in terms of autonomy, togetherness, security and peace of mind. There are major differences in older adults’ health due to socio-economic status [6, 9]. There have also been reports of gender differences in self-rated health, with females rating their health as worse than males [5, 10].
Healthy aging is a process in which the body slows down physically and cognitively and simultaneously adapts while autonomy and self-determination are maintained [7]. The most widely recognized definition of health is by the World Health Organization [11], which describes health as a state of complete physical, mental and social well-being and not merely the absence of disease or infirmity. This has replaced the biomedical description of health as the absence of disease. Another accepted definition of health is its relation to whether a person experiences a sense of coherence (SOC), consisting of the components of comprehensibility, manageability and meaningfulness [7, 12]. Antonovsky [12] described the state of health on a continuum with individuals moving between two opposing poles: complete ill health and full health. Throughout life, individuals move between these states of feeling better and worse.
The expected increase in the older adult population poses a health care challenge [5]. Forecasts indicate that the cost of elderly care in Sweden may increase by 270% by the year 2040. One challenge is that older adults report more health complaints compared with health professionals’ needs assessments [13]. Health, health promotion and equal treatment are key factors promoting healthy aging [5, 13). Therefore, this study aimed to describe self-rated health among older adults
living at home along with any age and gender-based health differences.
Methods
Research design and ethics
This was a descriptive, questionnaire-based cross-sectional study [14]. It formed part of a larger population-based survey, Life & Health, in Sweden [15] that aims to study health trends across the population and older adults’ self-perception of their health, as well as life habits and living conditions. The study followed the ethical principles for human research of the Declaration of Helsinki [16] and Swedish Research Council [17] in relation to
informed consent, confidentiality and study
procedures. The participants received information about the study aims and processes before giving their informed consent to participate. They had the option of withdrawing at any time without giving a reason. All data was treated as confidential, kept inaccessible to unauthorized persons and used solely for study purposes. Participants’ responses were anonymised.
Sample and data collection
Statistics Sweden, the Swedish Government Agency responsible for Swedish official statistics, developed a random sample from the population register in Sweden. In total, 13,922 older adults aged 65–84 years and living in five counties in central Sweden participated. The only exclusion criterion was if the person lived in a nursing home.
The questionnaire was developed by researchers and statisticians from the five counties where the study was performed [15]. Areas investigated included background characteristics such as age, gender, education and housing, as well as health, living conditions and need for additional care. In the present analyses, we included background and health measures. The questions were presented with response categories, the majority of which were nominal or ordinal scales with the option of providing additional comments at the end of the questionnaire [18].
The questionnaires were disseminated in sealed envelopes with a postage-paid return envelope. The
sealed envelope included an introduction explaining the study aim, that participation was voluntary, that data would be kept confidential and that participants’ identity was protected. Three reminders were sent, as needed. The response rate was 79% among those aged 65–79 years and 75% among those 80–84 years.
Data analysis
Data were analysed using the Statistical Package for the Social Sciences (SPSS) for Windows version 19.0 (SPSS Inc., Chicago, IL, USA). Nominal data are presented as absolute frequency (number = n) and relative frequency (%) [18]. Non-parametric tests included the chi-square test to examine health differences between genders and the Mann–Whitney
U to examine differences between the two age groups,
namely, 65–79 years and 80–84 years. The median was used to describe the central tendency and min– max was used to describe variance. To avoid type I error, only p-values < .01 were considered statistically significant. Missing data are presented because these made up less than 1% and data were neither replaced nor imputed [18].
Results
The results describe 13,922 self-rated health assessments of older adults living at home with health differences by gender and age groups 65–79 years (n = 5,926 males, n = 5,755 females) and 80–84 years (n = 1,208 males, n = 1,033 females). The characteristics and general health, long-term diseases or health problems, short-term problems or symptoms, mental health and dental health are described.
Participant characteristics
More females aged 65–79 years (35%) lived alone than did males (18%); the same was found for females aged 80–84 years (58%) compared with males (26%). The remaining participants lived with a spouse, partner or cohabitant; a few lived with a child or an adult friend. The most common form of housing was a villa (65–79 years: males 58%, females 49%; 80–84 years: males 43%, females 30%). More females aged 65–79 years (39%) lived in a multifamily home or
apartment than did males (30%); this was consistent among females aged 80–84 years (55%) compared with males (42%). A low proportion lived in a townhouse (65–79 years: males 8%, females 8%; 80– 84 years: males 6%, females 8%) or a serviced building or apartment (65–79 years: males 1%, females 1%; 80–84 years: males 3%, females 5%). Most participants had completed elementary school, primary school and junior secondary school or girls’ school (65–79 years: males 51%, females 61%; 80–84 years: males 60%, females 74%). A lower proportion had graduated from a secondary or vocational school (65–79 years: males 17%, females 9%; 80–84 years: males 12%, females 5%) or from higher education (65–79 years: males 16%, females 16%; 80–84 years: males 11%, females 7%). Some participants reported that they had completed additional education (65–79 years: males 15%, females 15%; 80–84 years: males 19%, females 13%).
General health
Overall, participants aged 65–79 years rated their general health as good (Table 1); those aged 80–84 rated their health as neither good nor poor. Statistically significant gender differences were found on the health assessment with a greater proportion of males than females estimating their health as good or very good. Regardless of age group, participants could handle their daily activities well but were troubled by moderate pain. More females than males were bothered by anxiety and or depression (Table 1). These differences were statistically significant.
Long-term diseases and problems
More than a third of participants aged 65–79 years had had long-term diseases or problems for longer than six months (males: yes 38%, no 62%; females: yes 38%, no 62%). Among participants aged 80–84 years, the proportion of both males and females who had had long-term diseases or problems was greater (males: yes 43%, no 57%; females: yes 47%, no 53%).
Table 2 shows participants’ descriptions of long-term diseases or problems during the last year.
Table 1. Older adults’ general health across age groups and gender
Variables Older adults n = 13,392
65–79 years 80–84 years Male n = 5,926 Female n = 5,755 Male n = 1,033 Female n = 1,208 Median (min–max) Median (min–max) p Median (min–max) Median (min–max) p General health a 2 (1–5) 2 (1–5) .000 3 (1–5) 3 (1–5) .001 Mobilityb 1 (1–3) 1 (1–3) .000 1 (1–3) 2 (1–3) .000 Hygiene c 1 (1–3) 1 (1–3) .801 1 (1–3) 1 (1–3) .884 Daily activitiesd 1 (1–3) 1 (1–3) .001 1 (1–3) 1 (1–3) .018
Pain and or discomforte 2 (1–3) 2 (1–3) .000 2 (1–3) 2 (1–3) .000
Anxiety and or depressionf 1 (1–3) 1 (1–3) .000 1 (1–3) 1 (1–3) .000
a1 = very good, 2 = good, 3 = neither good nor poor, 4 = poor, 5 = very poor
b1 = move without difficulty, 2 = move with some difficulty, 3 = bedridden
c1 = no help, 2 = needs some help, 3 = needs constant help
d1 = can handle, 2 = some problems, 3 = cannot handle
e1 = none, 2 = moderate, 3 = severe
f1 = none, 2 = to a certain extent, 3 = much
Table 2. Older adults’ long-term diseases or problems during the last year across age groups and gender
Variables
Older adults n = 13,922
65-79 years 80-84 years
Male n = 5,926 Female n = 5,755 Male n = 1,033 Female n = 1,208 Yes
n (%) Yes n (%) p Yes n (%) Yes n (%) p
Cardio-vascular disease 1,362 (23) 978 (17) .000 372 (36) 399 (33) .143 Hypertension 2,489 (42) 2,590 (45) .006 444 (43) 664 (55) .000 Diabetes Type 1 119 (2) 58 (1) .001 21 (2) 24 (2) .933 Diabetes Type 2 948 (16) 691 (12) .000 196 (19) 193 (16) .038 Thyroid disease 178 (3) 863 (15) .000 52 (5) 230 (19) .000 Asthma 356 (6) 518 (9) .000 72 (7) 121 (10) .056
Allergy eye or nose 770 (13) 921 (16) .000 176 (17) 230 (19) .412
Food allergy 178 (3) 345 (6) .000 21 (2) 60 (5) .000 Eczema 593 (10) 633 (11) .259 114 (11) 145 (12) .316 Nickel allergy 59 (1) 518 (9) .000 10 (1) 72 (6) .000 Depression 356 (6) 518 (9) .000 72 (7) 145 (12) .001 Exhaustion syndrome 237 (4) 288 (5) .016 83 (8) 72 (6) .107 Cancer 474 (8) 288 (5) .000 103 (10) 72 (6) .001
Chronic obstructive pulmonary disease
296 (5) 230 (4) .276 83 (8) 60 (5) .022
Stomach or intestinal disease 593 (10) 806 (14) .000 114 (11) 181 (15) .010
Involuntary leakage of urine 711 (12) 1,381 (24) .000 207 (20) 435 (36) .000
Rheumatoid arthritis 296 (5) 518 (9) .000 62 (6) 169 (14) .000 Neurologic disease 237 (4) 230 (4) .841 52 (5) 48 (4) .239 Sleep apnoea 533 (9) 345 (6) .000 72 (7) 97 (8) .820 Tinnitus 2,015 (34) 1,151 (20) .000 341 (33) 338 (28) .069 Hearing loss 3,141 (53) 1,842 (32) .000 671 (65) 652 (54) .000 Visual impairment 652 (11) 633 (11) .729 227 (22) 314 (26) .085 Physical disabilities 1,244 (21) 1,209 (21) .538 331 (32) 423 (35) .301 Mental disabilities 178 (3) 173 (3) .465 52 (5) 72 (6) .343
More than half of males aged 65–79 years reported trouble with hearing loss. A large percentage of males also had trouble with high blood pressure, cardio-vascular disease, tinnitus and physical disabilities. Females aged 65–79 years had the most trouble with high blood pressure, hearing and physical disabilities. In those aged 80–84 years, both males and females had disorders including cardio-vascular disease, high blood pressure, hearing and physical disabilities. Females reported more long-term illnesses or symptoms compared with males. Most of the differences were in the group aged 65–79 years (Table 2). These differences were statistically significant.
Short-term problems or symptoms
Both males and females reported having been occasionally bothered by musculoskeletal pain (Table 3). Females reported being troubled more by short-term diseases or problems compared with males. A larger proportion of females reported more problems than males, including sleep problems and fatigue during the last three months. These differences were statistically significant (Table 3).
Mental health
Females aged 65–79 years reported worse mental health on several variables compared with males’ ratings (Table 4). Females aged 65–79 years reported a lower sense of coherence (SOC) than did males [11]. These differences were statistically significant (Table 4).
Dental health
Almost 70% of males aged 65–79 years stated that they had very good or good dental health (very good 18%, good 49%, neither good nor poor 23%, poor 7%, very poor 2%), which was similar to females aged 65– 79 years (very good 18%, good 51%, neither good nor poor 24%, poor 6%, very poor 2%).
Over half of males aged 80–84 years had very good or good dental health (very good 12%, good 46%, neither good nor poor 31%, poor 10%, very poor 2%). More than half of females aged 80–84 years had very good or good dental health (very good 14%, good 48%, neither good nor poor 29%, poor 8%, very poor 2%).
Table 3. Older adults’ short-term problems or symptoms during the last three months across age groups and gender
Variables a Older adults n = 13,922
65-79 years 80-84 years
Male
n = 5,926 Female n = 5,755 Male n = 1,033 Female n = 1,208
Median
(min-max) Median (min-max) p Median (min-max) Median (min-max) P
Pain in shoulders and neck 2 (1-4) 2 (1-4) .000 2 (1-4) 2 (1-4) .000
Pain in back or hips 2 (1-4) 2 (1-4) .000 2 (1-4) 2 (1-4) .000
Pain in limbs 2 (1-4) 2 (1-4) .000 2 (1-4) 2 (1-4) .000
Pain in the stomach 1 (1-4) 1 (1-4) .000 1 (1-4) 1 (1-4) .000
Headaches and or migraines 1 (1-4) 1 (1-4) .000 1 (1-4) 1 (1-4) .000
Anxiety and worry 1 (1-4) 1 (1-4) .000 1 (1-4) 2 (1-4) .000
Fatigue and weakness 1 (1-4) 2 (1-4) .000 2 (1-4) 2 (1-4) .000
Sleep problems 1 (1-4) 2 (1-4) .000 1 (1-4) 2 (1-4) .000
Depressed mood 1 (1-4) 1 (1-4) .000 1 (1-4) 2 (1-4) .000
Dizziness 1 (1-4) 1 (1-4) .000 1 (1-4) 2 (1-4) .000
Irritated mucous membranes 1 (1-4) 1 (1-4) .000 1 (1-4) 1 (1-4) .052
Stress 1 (1-4) 1 (1-4) .000 1 (1-4) 1 (1-4) .000
Table 4. Older adults’ mental health during the last week across age groups and gender
Variables Older adults n = 13,922
65-79 years 80-84 years
Male
n = 5,926 Female n = 5,755 Male n = 1,033 Female n = 1,208
Median
(min-max) Median (min-max) p Median (min-max) Median (min-max) p
Concentrationa 2 (1-4) 2 (1-4) .000 2 (1-4) 2 (1-4) .024
Making decisionsa 2 (1-4) 2 (1-4) .157 2 (1-4) 2 (1-4) .337
Grab problems a 2 (1-4) 2 (1-4) .240 2 (1-4) 2 (1-4) .285
Hard to sleep because of anxietyb 1 (1-4) 2 (1-4) .000 1 (1-4) 2 (1-4) .000
Felt tenseb 1 (1-4) 2 (1-4) .000 2 (1-4) 2 (1-4) .001
Not managing their problemsb 1 (1-4) 2 (1-4) .000 2 (1-4) 2 (1-4) .000
Unhappy and depressedb 1 (1-4) 2 (1-4) .000 1 (1-4) 2 (1-4) .000
Lost faith in oneselfb 1 (1-4) 1 (1-4) .000 1 (1-4) 1 (1-4) .001
Felt uselessb 1 (1-4) 1 (1-4) .000 1 (1-4) 1 (1-4) .142
Made some benefit a 2 (1-4) 2 (1-4) .360 2 (1-4) 2 (1-4) .911
Felt appreciateda 2 (1-4) 2 (1-4) .280 2 (1-4) 2 (1-4) .186
Felt happya 2 (1-4) 2 (1-4) .000 2 (1-4) 2 (1-4) .476
View of the future for himself c 2 (1-5) 2 (1-5) .008 3 (1-5) 3 (1-5) .304
Sense of coherence (SOC) d 75 (13-91) 73 (19-91) .000 75 (28-91) 74 (23-91) .227
a 1 = better than usual, 2 = as usual, 3 = less than usual, 4 = much worse than usual
b 1 = not at all, 2 = no more than usual, 3 = more than usual, 4 = much more than usual
c 1 = very optimistic, 2 = fairly optimistic, 3 = neither optimistic nor pessimistic, 4 = quite pessimistic, 5 = very pessimistic d Low SOC = ≥ 59 points, high SOC = ≥ 75 points, max SOC = 91 points (SOC = experiences a sense of coherence [6, 11]
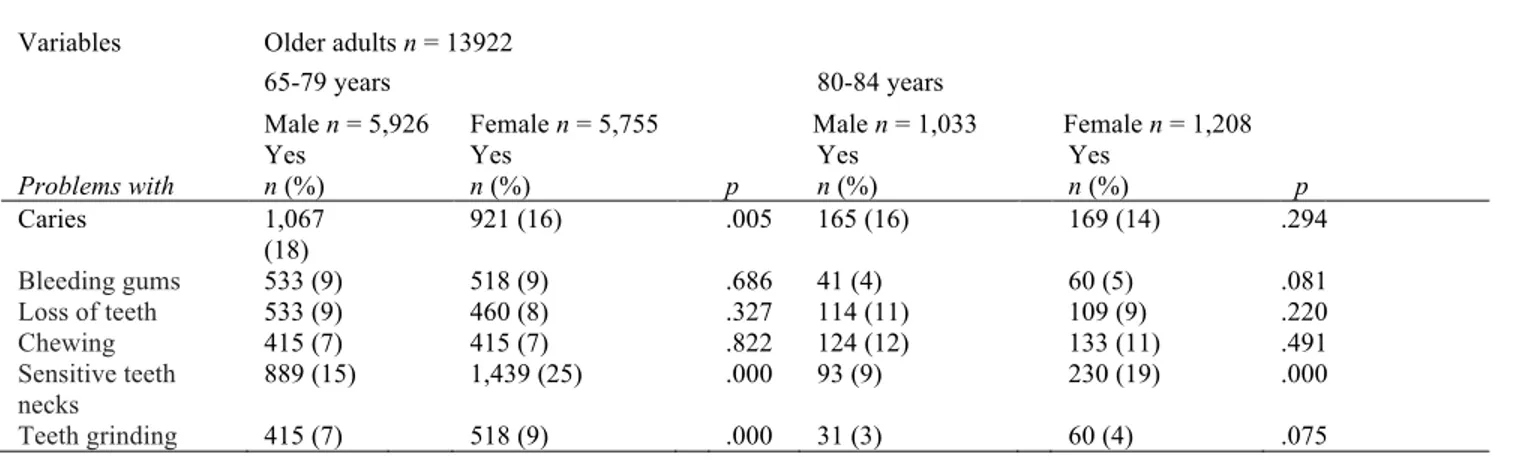
Compared with males, females aged 65–79 years had more problems with sensitive teeth and teeth grinding (Table 5). Males in the same age group were troubled more by caries than were females. Females aged 80– 84 years were bothered more than were males by sensitive teeth necks. The differences were statistically significant (Table 5).
Discussion
Method discussion
The primary strength of the study was its large and
randomly selected sample, which enables
generalization to the wider population [14]. Another strength was the high response rate and a low amount of missing data. According to Vuorisalmi et al. [19], self-rated health has been recognized as a valid and reliable measure of health among older adults. The World Health Organization [11] has recommended this indictor to verify health in population-based studies of older adults. However, it may have been preferable to divide the group aged 65–79 years into two groups, because factors may differ for a 65-year-old (the normal retirement age in Sweden) compared
to a 79-year-old, which may have influenced the self-rated health measures. However, this study followed the age groupings used in national population surveys in Sweden, allowing comparisons between counties and various measurements over time. This study has an important value and is relevant to health care policy and clinical care. Use of questionnaires in which participants use response categories may have limitations but this applies to most questionnaires. However, participants were given an opportunity to comment with free text at the end of the questionnaire.
General health
The majority of participants aged 65–79 years rated their general health as good, which decreased to neither good nor poor for those aged 80–84 years. Marques et al. [20] studied older adults’ subjective health, social status and age identification across different countries. Their study demonstrated that subjective health was stronger in countries where older adults’ social status was perceived as being higher, such as Sweden, the other Nordic countries, Switzerland, Great Britain, Belgium and Germany.
Table 5. Older adults’ dental health during the last year across age groups and gender
Variables Older adults n = 13922
65-79 years 80-84 years
Problems with
Male n = 5,926 Female n = 5,755 Male n = 1,033 Female n = 1,208 Yes
n (%) Yes n (%) p Yes n (%) Yes n (%) p
Caries 1,067 (18) 921 (16) .005 165 (16) 169 (14) .294 Bleeding gums 533 (9) 518 (9) .686 41 (4) 60 (5) .081 Loss of teeth 533 (9) 460 (8) .327 114 (11) 109 (9) .220 Chewing 415 (7) 415 (7) .822 124 (12) 133 (11) .491 Sensitive teeth necks 889 (15) 1,439 (25) .000 93 (9) 230 (19) .000 Teeth grinding 415 (7) 518 (9) .000 31 (3) 60 (4) .075
There were significant health differences, with fewer females than males rating their health as good or very good. This result agrees with several national studies reporting that women rate their health as being poorer than do men [21, 22]. Af Sillén et al. [10] indicate that males compare their health mainly to that of other males, who they often deem as having poorer health than their own. Females, in contrast, tend to rate their health based on how their whole family feels. With this in mind, it is important to individualize person-oriented care in which both men and women are considered unique and treated individually [13] with the understanding that health is a process that a person creates and experiences in daily life [12].
The majority of participants aged 65–79 years stated that they had no problems with movement, though there were significant health differences between genders in both age groups. A larger proportion of females than males stated that they had some difficulty with movement. Yong et al. [22] showed gender differences in poorer walking and position transitions among females 75 years and older. In the current study, few participants aged 65–79 years needed help with their daily hygiene but the rate increased for both males and females aged 80–84 years. Regardless of age group, a large proportion of participants reported that they could handle their daily activities. This compares favourably with the findings of Thorslund and Parker [3] who showed that regardless of methodological differences or statistical representativeness, older adults’ ability to manage activities of daily living has improved, while at the
same time a greater proportion of older adults have specific health problems [3].
The majority of males and females in both age groups reported experiencing moderate pain or discomfort. There were significant gender differences, with more females than males reporting moderate to severe problems with pain. Although the definition of pain may differ according to the study [23], chronic pain has been shown to increase with age [24). The prevalence of chronic pain among older adults has been reported to vary from 50% (25) to 83% (26). Older adults with pain are more likely to rate their health as poor (27). However, as Collies and Waterfield [23] noted, there is a distinction between having pain and having a problem with pain.
Karlsson [13] showed that compared with older adults’ self-reporting, health professionals tended to rate their patient as having less pain. According to Josefsson [28], there is a great deal of ignorance about pain among older adults. Pain may be existential, meaning it is a social or spiritual form that may manifest itself in emotions such as anxiety, fatigue or sadness. It is important that health professionals can appreciate whether their patient is experiencing existential pain, so they can determine the correct course of action.
Our results show significant health differences in anxiety and / or depression between males and females. More females than males rated that they felt anxiety or depression. These feelings may be related to females experiencing more pain and discomfort, which can lead to poorer self-rated health. According
to Tai-Seale et al. [29], little time is spent on older adults’ mental health in primary care. Resources should be available in primary care to promote mental health, given an aging population [1] and that a large proportion of older adults have problems with anxiety or depression. Peace of mind is reported to be a main factor in older adults’ experience of their health [8].
Diseases and problems
Among participants aged 65–79 years, one in three men and women reported having long-term diseases or problems lasting longer than six months. This proportion increased with age, especially among females, among whom almost half of those aged 80– 84 years reported chronic diseases or problems. Josefsson [28] reported that a person’s age is strongly associated with disease. However, although age changes are often due to normal aging, they may lead to increased sensitivity. The reduction in older adults’ reserves can mean they have a reduced resistance to diseases and environmental stresses. This may be one reason why old age leads to increased risk for diseases or problems.
The most common long-term diseases and symptoms during the past year reported by males were cardio-vascular disease, hypertension, tinnitus, hearing loss and physical disabilities. Compared with males, females aged 65–79 years reported more chronic diseases. Both males and females reported hearing loss, which, according to Josefsson [28] is the most common disorder among older adults. Hearing loss is a natural aging process of the inner ear. From [7] showed that older adults’ health was related to their ability to adapt to and compensate for their disabilities. Thus, it is essential that older adults and their health professionals know the differences between natural and pathological age-related changes, to allow correct assessment and action.
There were also significant differences between males and females on short-term problems or symptoms during previous three months. More than one in three females were plagued by pain in their shoulders, neck, back or hips occasionally or almost all the time, compared with males among whom one in four had the same problems. Compared with males, females had more problems with sleep, fatigue and weakness,
anxiety and worry during the previous three months. Borglin et al. [30] suggested that females who rated their health as worse had a greater problem with decrease in power and mobility, as suggested by their low physical activity. Older adults with an unaddressed decrease in power and mobility may end up in a vicious circle; they may be too tired to cope with daily life and thus move less, which leads to stiffer joints and even more immobility.
Mental health
There were significant mental health differences between males and females. A larger proportion of females than males aged 65–79 years reported that they had trouble sleeping due to anxiety, feeling tense, not managing their problems, feeling dejected and depressed, and losing faith in themselves. This is consistent with Yong et al. [22], who reported poorer mental health among older females compared with males. The prevalence of mental diseases among older adults is common and increasing rapidly [29]. Because the global population is aging rapidly [1], good geriatric care is critical, including older adults’ mental health and gender differences. However, little time is spent on mental health care for older adults [29].
More than half the participants aged 65–79 years had a very or fairly optimistic view of their own future. There was a significant gender difference in sense of coherence (SOC) with more males than females aged 65–79 years reporting a high SOC. It is positive that participants reported a high SOC, given the connection between experienced health and well-being [12]. However, females had a lower SOC than males. It is therefore particularly important to promote a sense of coherence among females by having them take advantage of their resources, strengths and abilities [7, 12].
Dental health
Seven out of 10 older adults aged 65–79 years reported good or very good dental health and six out of 10 aged 80–84 years reported having good or very good dental health. Participants’ common dental problems were caries and sensitive teeth. There were
significant gender differences in the group aged 65–79 years, with more males reporting caries and more females reporting trouble with sensitive teeth and teeth grinding. However, these older adults’ dental health was good compared with the study by Morales-Suarez-Varela et al. [31] who reported that a large proportion of their sample had trouble with dental health. Andersson et al. [6] note that there is little knowledge in primary care about how dental health affects older adults’ well-being. Dental health and well-being-associated primary care should pay greater attention to older adults’ dental health rather than leaving dental care to dentistry. Because no one agency can tackle all issues, the promotion of healthy aging requires a multi-agency response.
Conclusions
Most participants aged 65–79 years rated their general health as good, while health ratings decreased in the group aged 80–84 years. Females reported a lower sense of coherence than did males. Females rated their physical and mental health worse than did males, which was clearer in the group aged 65–79 years. Gender differences tended to level off in the group aged 80–84 years. The fact that older females perceived their health as lower than did older males is of importance. Health policies and programmes need to promote healthy aging equitably.
Acknowledgements
We are grateful to the CDUST-counties, consisting of the counties of Uppsala, Värmland, Västmanland, Örebro and Södermanland who gave us permission to use data from Life & Health.
References
1. United Nations. World Population Ageing: 1950-2050. [Accessed 2015 12 14]. United Nations; 2002. Available from:
http://www.un.org/esa/population/publications/worldage ing19502050/
2. Statistics Sweden. Statistisk årsbok 2014 [Statistical Yearbook]. Stockholm: Statistics Sweden; 2014. Swedish.
3. Thorslund M, Parker MG. Hur mår egentligen de äldre? Motstridiga forskningsresultat tyder på både förbättrad och försämrad hälsa. [How do the elderly feel actually? Contradictory research results indicate both improved and impaired health]. Läkartidningen. 2005; 43:3119– 3124. Swedish.
4. Public Health Agency of Sweden. Folkhälsan i Sverige [Public health in Sweden]. Stockholm: Public Health Agency of Sweden; 2014. Swedish.
5. Public Health Agency of Sweden. Folkhälsan i Sverige, årsrapport 2012 [The public health in Sweden, annual report 2012]. Stockholm; Public Health Agency of Sweden: 2012. Swedish.
6. Andersson K, Furhoff A-K, Nordenram G, Wårdh I. Oral health is not my department. Perceptions of elderly patients’ oral health medical practitioners in primary health care centers: a qualitative interview study. Scand J Caring Sci. 2007; 21:1261–33.
7. Lezwijn J, Vaandrager L, Naaldenberg J, Wagemakers A, Koelen M, van Worekum C. Healthy ageing in a salutogenic way: Building the HP 2.0 framework. Health Soc Care Comm. 2011; 191:43–51.
8. From I. Health and quality of care from older people's and formal caregivers' perspective. [dissertation]. Karlstad; Karlstad University: 2012.
9. Fogelholm M, Valve R, Absetz P, Heinonen H, Uutela A, Patja K, Karisto A, Konttinen R, Mäkelä T, Nissinen A, Jallinoja P, Nummela O, Talja, M. Rural-urban differences in health and health behaviour: A baseline description of a community health-promotion programme for the elderly. Scand J Public Health. 2006; 34:632−40.
10. Af Sillén U, Nilsson J-Å, Månsson N-O, Nilsson PM. Self-rated health in relation to age and gender: Influence on mortality risk in the Malmö Preventive Project. Scand J Public Healt. 2005; 33:183−89.
11. World Health Organization. WHO definition of Health. [Accessed 2015 12 14]. World Health Organization;
1948. Available from:
http://www.who.int/about/definition/en/print.html 12. Antonovsky A. Health, Stress and Coping. San
Francisco: Jossey-Bass; 1979.
13. Karlsson S, Edberg A-K, Rahm Hallberg I. Professional’s and older person’s assessments of functional ability, health complaints and received care and service. A descriptive study. Int J Nurs. Stud. 2010; 47:1217−27.
14. Polit DF, Beck CT. Nursing research. Generating and Assessing Evidence for Nursing Practice. Lippincott Williams & Wilkins; 2012.
15. Sörmland County Council. Liv & hälsa 2008 - en undersökning om hälsa, levnadsvanor och livsvillkor [Life & Health 2008 – a survey about health, lifestyles and living conditions]. Sörmland County Council; 2008. Swedish.
16. Declaration of Helsinki. World Medical Association Declaration of Helsinki. [Accessed 2015 12 14]. Declaration of Helsinki; 2008. Available from: http://www.slf.se/upload/30780/DoH-Oct2008.pdf 17. Swedish Research Council. Forskningsetiska principer
[Research Ethical Principles]. [Accessed 2015 12 14]. Swedish Research Council; 2002. Available from: http://www.codex.vr.se/texts/HSFR.pdf). Swedish. 18. Altman DG. Practical Statistics for Medical Research.
London: Chapman & Hall; 1997.
19. Vuorisalmia M, Sarkealaa T, Hervonena A, Jylhä M. Among nonagenarians, congruence between self-rated and proxy-rated health was low but both predicted mortality. J Clin Epidemiol. 2012; 65:553−59.
20. Marques H.J, Swift C-M, Vauclair M, Lima L, Bratt C, Abrams D. ‘Being old and ill’ across different countries: Social status, age identification and older people’s subjective health. Psychol. Health. 2015; 30:699−714. 21. Singh L, Arokiasamy P, Singh PK, Rai RK.
Determinants of gender differences in self-rated health among older population: Evidence from India. SAGE Open. 2013; 3:1−12.
22. Yong V, Saito Y, Chan A. Gender differences in health and health expectancies of older adults in Singapore: An examination of diseases, impairments, and functional disabilities. J Cross Cult Gerontol. 2011; 26:189−203. 23. Collis D, Waterfield, J. The understanding of pain by
older adults who consider themselves to have aged successfully. Musculoskeletal Care. 2015; 13:19−30. 24. Donald I, Foy C. A longitudinal study of joint pain in
older people. Rheumatology. 2004; 43:1256−60. 25. Tsai Y, Li-Ling L, Chung, S. Pain prevalence,
experiences, and self-care management strategies among the community-dwelling elderly in Taiwan. J Pain Symptom Manage. 2010; 40:575−81.
26. Depp C, Jeste D. Definitions and predictors of successful aging: A comprehensive review of larger quantitative studies. Am J Geriatr Psychiatry. 2006; 14:6-20. 27. Sjögren P, Ekholm O, Peuckmann V, Grönbæk M.
Epidemiology of chronic pain in Denmark: An update. Eur J Pain. 2009;13:287−92.
28. Josefsson K. Sjuksköterskan i kommunens äldrevård och äldreomsorg [The registered nurse in municipal health and social care]. Stockholm: Gothia förlag; 2009 Swedish.
29. Tai-Seale M, McGuire T, Colenda C, Rosen D, Cook MA. Two-minute mental health care for elderly patients: Inside primary care visits. J Am Geriatr Soc. 2007;5512:1903−11.
30. Borglin G, Jakobsson U, Edberg A-K, Rahm Hallberg I. Older people in Sweden with various degrees of present quality of life: their health, social support, everyday activities and sense of coherence. Health Soc Care Community. 2006; 142:136−46.
31. Morales-Suárez-Varela, M, Ibáñez-Cabanell P, Gimeno-Clemente N, Roig-García JM, Adoracíon Nieto-García M, Llopis-González A. Oral and dental health of non-institutionalized elderly people in Spain. Arch. Gerontol. Geriat. 2010; 52:159−63.