Carbon tetrachloride removal from a hetrogeneous porous medium by two soil vapor extraction techniques
11
0
0
Full text
(2) Oostrom et al.. 188. rachloride. These contaminants can occur in the liquid phase as free, residual, and/or trapped (Lenhard et al., 2004); in the solid phase by means of adsorption, especially to organic matter; in the aqueous phase when dissolved; and/or in the gas phase. Mass transfer between the different phases has been described based on the local equilibrium assumption or by a first-order kinetic approach. Substantial tailing in the gaseous concentration has been observed, however, when free liquid DNAPL is no longer present (e.g., Grathwohl et al., 1990). Fischer et al. (1996) attributed tailing solely to diffusion in interparticle water which suggested that local non-equilibrium conditions prevailed. When present as a dissolved constituent only, Fischer et al. (1996) found that mass removal of NAPLs decreases with increasing water content. Because of local non-equilibrium conditions and the reduced efficiency in the removal of VOCs during tailing, it has been suggested that pulsed pumping be considered (Crow et al., 1987). For homogeneous porous media, and as long as the DNAPLs only occur in the unsaturated part of the soil, vapor extraction can remove close to 100% of a VOC. Liang and Udell (1999) showed that the process of through-flow venting is responsible for removal of contaminants in the high-permeability regions of the vadose zone. In that process, air preferentially moves through the high-permeability zones and the removal rates of VOCs are primarily determined by their volatilities. Evaporation rates are relatively high and mass transfer resistances low. On the other hand, VOCs located in low-permeability zones are bypassed by the moving air. Recovery rates in this case are governed by diffusion, through the aqueous or gas phase, from low to high permeability zones. Liang and Udell (1999) refer to this process, where evaporation rates are small, as bypass-flow venting. Remaining challenges in the removal of DNAPLs from porous media include the removal of trapped DNAPL from the vadose zone and the removal of DNAPL present below the capillary fringe, i.e., the region where only DNAPL and water are present. Solutions suggested for the removal below the capillary fringe and trapped contaminants in the vadose zone include the use of surfactants to mobilize trapped globules and to increase the dissolution into the aqueous phase; air sparging, which increases aerobic biodegradation and promotes the physical removal of organics by direct volatilization; biodegradation, in which enhanced microbial action is used to degrade organic contaminants into harmless metabolic products; chemical reactions to destroy the NAPL; and thermal treatment. Although SVE is one of the most applied remediation techniques for removal of VOCs from the vadose zone, to our knowledge no intermediate-scale flow cell experiment has been conducted to demonstrate the features of the technique in a heterogeneous porous medium contaminated with a DNAPL mixture. Based on some of our knowledge gaps and desirability to enhance our understanding of DNAPL fate in the environment and subsequent cleanup using SVE, we formulated the following objectives for the intermediate-scale experiment: (1) Investigate the infiltration and redistribution of a multicomponent DNAPL in a variably saturated, layered porous medium, (2) Verify whether the expected through-flow and bypass-flow principles of SVE would 188.
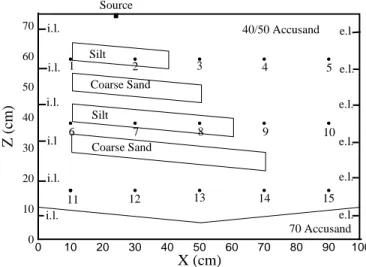
(3) Carbon tetrachloride removal from a heterogeneous porous medium by two soil vapor extraction techniques. occur, (3) Investigate the effectiveness of residual carbon tetrachloride removal from the vadose zone by means of SVE with moist air; and (4) Investigate whether trapped DNAPL from the vadose zone and pooled DNAPL present in the saturated zone can be removed by the combined effects of water table reduction and SVE with dry air.. 2. Materials and Methods The experiment was performed in a 100 cm long by 80 cm high by 5.5 cm wide flow cell. The flow cell and the packing arrangement are shown in Fig. 1. It was packed with four porous media, viz., 40/50 mesh Accusand, 70 mesh Accusand, and a silt and coarse sand obtained at the Hanford site. It should be noted that the V-shaped bottom layer consisted of a fine sand (70 Accusand) to prevent DNAPL from reaching the bottom of the flow cell. The bulk of the remaining material consisted of a medium sand (40/50 Accusand) in which two coarse and two fine sloped layers were embedded. All porous materials were either packed under water or under a slight suction to allow the proper slopes to be implemented. Before the cover was placed on the flow cell, a layer of kaolinite paste was placed on top of the porous medium to ensure that no preferential air flow could occur between the porous medium and the flow cell cover. The water table was then lowered to z = 2 cm. After static equilibrium conditions were obtained, the flow cell was scanned with a dualenergy gamma system to determine the aqueous phase saturation distribution before the introduction of the DNAPL.. Source 70. i.l.. 40/50 Accusand Silt. 60. i.l. 1. 3. 2. 4. 5 e.l.. Coarse Sand. 50. Z (cm). e.l. i.l.. e.l. Silt. 40. i.l. 30. 7 Coarse Sand. 8. 9. 10. 13. 12. 11. 10. 14. 15 e.l. 70 Accusand. i.l. 0. e.l. e.l.. i.l.. 20. 0. 6. 10. 20. 30. 40. 50. 60. 70. 80. 90. 100. X (cm) Figure 1.. Overview of intermediate-scale flow cell (i.l = injection location; e.l.=extraction location). The DNAPL mixture used in the experiment is representative of the approximately 750 m3 of DNAPL disposed at the Hanford site between 1955 and 1972. The mixture consisted of 70% (by volume) carbon tetrachloride, 8% tributyl phosphate, 14% dibutyl butylphosphate, 3% Peacock lard oil, and. 189.
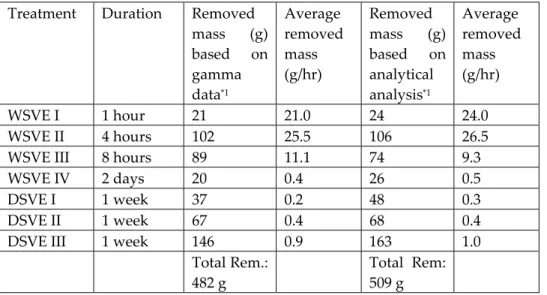
(4) Oostrom et al.. 190. 5% iodo-heptane. The latter component was added to ensure increased attenuation coefficients after removal of the carbon tetrachloride. All components of the mixture, expect for carbon tetrachloride, are considered to be nonvolatile. For observational purposes, the mixture was dyed with 0.1 g/L Sudan IV dye. The spill was introduced under a constant head from a source area located on top of the 40/50 mesh Accusand (Fig. 1). The liquid was poured into a rectangular 5.5 by 2.5 cm stainless steel sleeve, which covered the 5.5 cm inside width of the flow cell, while maintaining a head of approximately 3 cm. During infiltration and initial redistribution of the DNAPL photographs were obtained to document its behavior. Once static equilibrium of both water and DNAPL had been obtained, gamma radiation attenuation was used to determine liquid saturations (Dane et al., 1992; Oostrom et al., 1995; Oostrom et al., 1998) at 1710 locations. Higher density distributions were used in the vicinity of the embedded layers and near the source. Additional gamma radiation scans were obtained to quantify the removal of carbon tetrachloride and water after the various SVE treatments. Table 1. SVE treatment duration and carbon tetrachloride removal Average Average Treatment Duration Removed Removed mass (g) removed mass (g) removed based on mass based on mass (g/hr) (g/hr) gamma analytical data*1 analysis*1 WSVE I 1 hour 21 21.0 24 24.0 WSVE II 4 hours 102 25.5 106 26.5 WSVE III 8 hours 89 11.1 74 9.3 WSVE IV 2 days 20 0.4 26 0.5 DSVE I 1 week 37 0.2 48 0.3 DSVE II 1 week 67 0.4 68 0.4 DSVE III 1 week 146 0.9 163 1.0 Total Rem.: Total Rem: 482 g 509 g *1The initial carbon tetrachloride mass in the system is approximately 543 g. *2Between WSVE IV and DSVE I, the water table was lowered from z = 2 to z = -10 cm.. Carbon tetrachloride was initially removed from the flow cell using four SVE treatments with moist air followed by with three treatments with dry air. An overview of these periods is provided in Table 1. The SVE with moist air is referred to as “wet” SVE and the acronym WSVE will be used for this technique in this paper. The SVE with dry air is referred to as “dry” SVE, for which the acronym DSVE has been used. Air flow was produced by a diaphragm air sampling pump. For the WSVE periods, the dry and clean air was humidified by passing it through a 1-m long column filled with de-ionized water. The total flow rates during the WSVE and DSVE were 0.6 and 2.5 L/minute, respectively. Using air flow meters, 20% of the rate was applied separately to each of the five upper injection ports (Fig. 1, i.1 through i.6). 190.
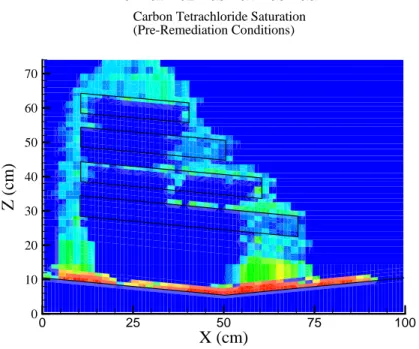
(5) Carbon tetrachloride removal from a heterogeneous porous medium by two soil vapor extraction techniques. The lowest injection port (i.6) was not used because the saturated conditions of the porous medium adjacent to the port. The air exited the flow cell through the opposite end chamber and a series of exit ports (Fig. 1, e.1 through e.6)), which were combined into a common outlet. In between the WSVE and the DSVE treatments, the water table was lowered from z = 2 cm to z = -10 cm. After a waiting period of 7 days, a gamma scan was obtained to determine the carbon tetrachloride and aqueous phase saturation before the DSVE remediation.The concentration of the carbon tetrachloride in the gaseous effluent was determined as a function of time during the SVE treatments. In between SVE treatments gamma radiation scans were carried out to determine liquid saturations and quantify the removal of carbon tetrachloride. When the removal of carbon tetrachloride by vapor extraction had essentially become limited by diffusion through the aqueous phase, we relied upon reduction of the water table accompanied by desiccation (dry soil vapor extraction) to remove the remaining carbon tetrachloride.. 3. Results and Discussion Initially, the DNAPL infiltrated very much as a sphere, similarly to the infiltration of water from a point source into a dry soil. A similar wetting behavior for the infiltration of PCE into an unsaturated zone was reported by Hofstee et al. (1998). Once the DNAPL reached the upper silt layer it started to spread to the left and to the right and edged over both ends. Some minor infiltration into the upper part of the silt layer was observed. Apparently the capillary forces were still very dominant as the DNAPL even moved over the higher end of the fine layer. During the subsequent redistribution, the DNAPL continued to move more or less straight downward on the left side of the flow cell (high ends of the layers), but followed a more intriguing path at the lower ends. The first coarse sand layer, which was unsaturated, accepted the DNAPL after some spreading occurred at the boundary, again indicating that the DNAPL moved as a wetting fluid in the unsaturated zone. Once the infiltration has ceased, residual DNAPL start to form at locations where the DNAPL was on a draining path. At the same time, the effect of the DNAPL on the surface tension of water became apparent as the top of the capillary fringe started to collapse. The final DNAPL distribution, for which we assumed static equilibrium, is shown in Fig. 2. It clearly shows the collapse of the capillary fringe, which was partially attributed to a reduction of the surface tension of water caused by DNAPL diffusion in the liquid phase, but more likely and more importantly by advective vapor flux (density driven). This picture also shows the accumulation of DNAPL in the V-shaped region below the capillary fringe, where two phases exist, and the distribution of the DNAPL at higher elevations, where 3 phases exist. This distribution is the initial condition for the remediation process using SVE. A gamma scan depicting carbon tetrachloride saturations are shown in Fig. 3.. 191.
(6) Oostrom et al.. 192. Figure 2. Final DNAPL distribution.. 0. 0.1. 0.2. 0.3. 0.4. 0.5. 0.6. Carbon Tetrachloride Saturation (Pre-Remediation Conditions) 70 60. Z (cm). 50 40 30 20 10 0. 0. 25. 50. 75. 100. X (cm) Figure 3. Measured carbon tetrachloride saturations for equilibrium distribution following the spill.. 192.
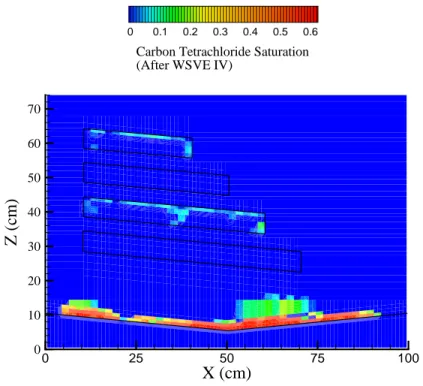
(7) Carbon tetrachloride removal from a heterogeneous porous medium by two soil vapor extraction techniques. 3.1 Soil Vapor Extraction with Moist Air A total of four WSVE treatments were included with extraction times of 1 hr, 4 hrs, 8 hrs, and 48 hrs, respectively (Table 3). After WSVE I, some of the carbon tetrachloride was removed from the left side of the flow cell. The saturations in the rest of the flow cell were not affected. All carbon tetrachloride to the left of the four layers and considerable amounts within the two coarse sand layers had been removed during WSVE II, which lasted four hours. Most carbon tetrachloride located in the silt layers had not been volatilized. After this remediation period, there were still no through-flow venting pathways (Liang and Udell, 1999) in which the carbon tetrachloride had been completely removed. Air, moving from the injection to the extraction ports, still encountered liquid carbon tetrachloride at some points in its path. After WSVE III, an 8-hour long extraction treatment, several clean through-flow venting pathways were present. In the unsaturated zone, a few pockets of carbon tetrachloride remained in the 40/50 mesh Accusand. Most of the carbon tetrachloride in the finer-grained silt layers had not yet been affected during this treatment. During WSVE IV, which lasted for 48 hours, the last remaining carbon tetrachloride was removed from the unsaturated 40/50 mesh Accusand, but the carbon tetrachloride saturations in the silt layers decreased only slightly (Fig. 4).. 0. 0.1. 0.2. 0.3. 0.4. 0.5. 0.6. Carbon Tetrachloride Saturation (After WSVE IV) 70 60. Z (cm). 50 40 30 20 10 0. 0. 25. 50. 75. 100. X (cm) Figure 4.. Measured carbon tetrachloride saturations after WSVE IV.. Vapor outflow concentrations data show that during WSVE I and II, the air flowing out of the flow cell was saturated with carbon tetrachloride vapor. During WSVE III, the outflow concentrations dropped gradually after 2 hours of venting. At the end of this venting period, the concentrations have dropped 193.
(8) Oostrom et al.. 194. two orders of magnitude. At this point in time, the carbon tetrachloride in the air was coming from the liquid carbon tetrachloride still present in the silt layers and from the DNAPL pool in the capillary fringe. In the latter case, carbon tetrachloride in the pool slowly dissolved into the aqueous phase and the dissolved component was then transported by diffusion to the gas-aqueous phase interface where it partitioned into the gas phase. The removal process had now become rather slow and was likely limited by the diffusion of dissolved carbon tetrachloride through the aqueous phase. The outflow concentration data were integrated over time to compute the amount of carbon tetrachloride that had been removed during each remediation treatment. The computed amounts are listed in Table 3. In addition, the carbon tetrachloride saturation saturations after each period were volumeintegrated to determine how much carbon tetrachloride was present after each remediation treatment. This information was used to compute how much was removed during each treatment (Table 1). The values in Table 3 show that the integrated gamma and vapor concentration data are reasonably close for each of the four WSVE periods. The average removal rates show that the remediation was most effective during WSVE I and II, and that the effectiveness dropped considerably during WSVE III, IV. 3.2. Water Table Reduction and Soil Vapor Extraction with Dry Air After it became apparent that the WSVE was no longer effective in removing the remaining carbon tetrachloride in the capillary fringe and the silt layers, additional remediation was conducted using DSVE after a lowering of the water table from z = 2 cm to z = -10 cm. The DSVE consisted of three treatments of one week each. After each treatment a gamma scan was obtained. Carbon tetrachloride and water saturations after the treatment III, are shown in Figs. 5 and 6, respectively. After DSVE I was completed the upper coarse sand had completely dried out, but only about half of the lower coarse sand had been desiccated. In general, the desiccation front in the lower part of the flow cell was behind the observed front in the upper part. The reason of the difference is that the aqueous saturations in the lower part of the flow cell were larger, increasing the time that was needed to dry out this region. At this point in time, the inflowing air was not directly accessing the pooled DNAPL and mass transfer from the pool into the gas phase was likely to be rate limited. During DSVE II, the desiccation zone had developed further to the right. Both coarse sand layers were now dry, while the upper silt layer appeared, based on the color change, to have undergone some drying too. During this treatment, the capillary fringe was reduced due to evaporation. During this treatment, the removed mass of carbon tetrachloride was 67 g, which was considerably more than during treatment DSVE I (Table 3). During the final DSVE period, dry air breakthrough was observed on the downstream end of the flow cell (Fig. 4). The carbon tetrachloride scan (Fig. 5) shows additional removal of the pooled carbon tetrachloride and complete removal in the silt layers. The carbon tetrachloride removal during this treatment was computed to be 146 g, corresponding to an average rate of 0.9 g/hr, which is more than double the rate observed during DSVE II (Table 3). Some 194.
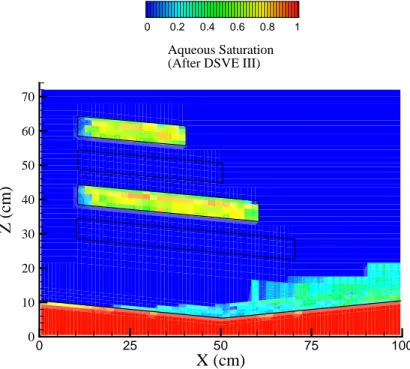
(9) Carbon tetrachloride removal from a heterogeneous porous medium by two soil vapor extraction techniques. 0. 0.1. 0.2. 0.3. 0.4. 0.5. 0.6. Carbon Tetrachloride Saturation (After DSVE III) 70 60. Z (cm). 50 40 30 20 10 0. 0. 25. 50. 75. 100. X (cm) Figure 5.. Measured carbon tetrachloride saturations after DSVE III.. 0. 0.2. 0.4. 0.6. 0.8. 1. Aqueous Saturation (After DSVE III) 70 60. Z (cm). 50 40 30 20 10 0. 0. 25. 50. 75. X (cm) Figure 6.. Measured water saturations after DSVE III.. 195. 100.
(10) Oostrom et al.. 196. DNAPL infiltration into the fine sand was observed. The reason for this infiltration is the water desaturation of the fine sand, which was also measured with the gamma radiation system (Fig. 5). The movement of DNAPL into the fine sand can be viewed as an undesirable effect of the desiccation process. The total mass of carbon tetrachloride present in the flow cell after all SVE remediation treatments was, according to the final gamma scan, 61 g, or 11% of the original mass.. 4. Summary and Conclusions It was observed that the spilled DNAPL largely by-passed the silt layers but easily moved in the coarse sand layers. Residual DNAPL was formed in the medium-grained sand matrix. The DNAPL caused a distinct reduction of the capillary fringe. Most of the DNAPL ended up in a pool on top of the Vshaped fine sand. Through four treatments with moist air soil vapor extraction, most residual carbon tetrachloride was removed from the medium-grained matrix and the coarse sand layers. The carbon tetrachloride in these highpermeability zones is in direct contact with the moving air and its volatility, in combination with the air flow velocity, determined the initial removal rate. However, the soil vapor extraction with moist air was not able to remove the carbon tetrachloride present in the silt layers and in the pool. The removal rates for DNAPL located in the silts were primarily determined by diffusion through the vapor and aqueous phases. This behavior was consistent with the through-flow venting in permeable zones and the bypass-flow venting in lower permeable zones discussed by Liang and Udell (1999). The WSVE was not able to remove carbon tetrachloride from the inundated pool located on top of the fine-grained sand in the capillary fringe. The WSVE treatments demonstrate clearly that the technique can be effectively used to remove volatile DNAPL components from permeable materials but that the method is not effective in removing DNAPL located in fine-grained materials and from inundated pools. Through a water table reduction and subsequent soil vapor extraction with dry air, the carbon tetrachloride in the silt layers and in the pool was effectively removed. Over time, water removal through desiccation allowed increased direct contact between the flowing air and the DNAPL, making the remediation more efficient. As a result of desiccation, the underlying fine sand started to desaturate, allowing some of the DNAPL to infiltrate. Overall, almost 90% of the carbon tetrachloride was removed from the flow cell. Acknowledgements. Pacific Northwest National Laboratory (PNNL) is operated by the Battelle Memorial Institute for the Department of Energy (DOE) under Contract DE-AC06-76RLO 1830. This research is part of the Groundwater/Vadose Zone Integration Project funded through the DOE’s Richland Operations Office. The experiment described in this paper was performed in the Environmental Molecular Sciences Laboratory, a national scientific user facility sponsored by the DOE's Office of Biological and Environmental Research and located at PNNL.. 196.
(11) Carbon tetrachloride removal from a heterogeneous porous medium by two soil vapor extraction techniques. References Crow, W.L., E.P. Anderson and E.M. Minugh. 1987. Subsurface venting of vapors emanating from hydrocarbon products in the ground water. Ground Water Monit. Rev. 7:54-57. Dane, J.H., M. Oostrom, and B.C. Missildine. 1992. An improved method for the determination of capillary pressure-saturation curves involving TCE, water and air. J. Contam. Hydrol.11:69-81. Fischer, U., R. Schulin, and M. Keller. 1996. Experimental and numerical in vestigation of soil vapor extraction. Water Resour. Res. 32:3413-3427. Grathwohl, P., J. Farrell and M. Reinhard. 1990. Desorption kinetics of vola tile organic contaminants from aquifer materials. In F. Arendt, M. Hinsenveld and W.J. van den Brink (eds.). Contaminated Soil ‘90. pp. 343-350. Kluwer Academic. Norwell, Mass. Hofstee, C., M. Oostrom, J.H. Dane, and R.C. Walker. 1998. Infiltration and redistribution of perchloroethylene in partially saturated, stratified porous media. J. Contam. Hydrol. 34:293-313. Lenhard, R.J., M. Oostrom and J.H. Dane. 2004. A constitutive model for air- NAPL-water flow in the vadose zone accounting for immobile, non-occluded (residual) NAPL in strongly water-wet porous media. J. Contam. Hydrol. 71:262-282. Liang, H-C., and K.S. Udell. 1999. Experimental and theoretical investigation of vaporization of liquid hydrocarbon mixtures in water-wetted porous media. Water Resour. Res. 35: 635-649. Oostrom, M., J.H. Dane, B.C. Missildine, and R.J. Lenhard. 1995. Error analysis of dualenergy gamma radiation measurements. Soil Sci. 160:28-42. Oostrom, M. C. Hofstee, J.H. Dane, and R.J. Lenhard. 1998. Single-source gamma radiation procedures for improved calibration and measurements in porous media. Soil Sci. 163:646-656.. 197.
(12)
Figure
+2
Related documents
Activated carbon, AC, is a porous material derived from a feedstock containing carbon that has been
Soil was collected from three locations: an urban garden with a diverse range of vegetables, weeds and wild millet; a monoculture plantation of Japanese cedar and Hinoki cypress;
The physical properties and the chemical composition of the starting material, as well as the methods and process conditions employed for activation, determine the pore
A comprehensive set of biochar mineralisation experiments in soil was retrieved by Lehmann (2015) which includes results from various biochar samples (feedstock, production
A very powerful tool for investigating electropermutation processes with and without conducting spacer in the feed compartment was obtained by in- corporating the enhanced
The maximum adsorption was observed at 0.233 g/L am- Al(OH) 3 (low As(III) to sorbent ratio group) under neutral pH conditions, where the amount of adsorbed As(III)
Figure 125: Slope coefficients between common, biomass burning and fossil fuel black carbon concentration and durations of fog on different days in January with standard errors
This adsorbent has the lowest capacity of phosphate retention (0.016 mg/g taking an average of the adsorption in solution 2 and 4) of the studied adsorbents, despite having used
