Research on Characteristics of Groundwater Recharge in Weishan
Irri-gated District Based on Bromide Tracer
Xin Cong
School of Resources and Environment, University of Jinan
Zhenghe Xu 1
School of Resources and Environment, University of Jinan Tong Wang
School of Resources and Environment, University of Jinan
Abstract. It is of great theoretical and practical significance to determine the vertical infiltration recharge of groundwater by Bromide tracer technology, which reveals the spatial variation rule of groundwater recharge and improves the theory and method of groundwater resource evaluation. Bromide was used as tracer in Weishan Irrigated District to determine the groundwater recharge as well as to evaluate the impacts of different irrigation basin location, irrigation regime and crop types on the recharge. The comprehensive recharge coefficient and the Kringing Spacial Interpolation methods were used to distinguish the effects of precipitation and surface water irrigation on groundwater recharge rate. The results showed that the recharge rates ranged from 85.8 to 243 mm/a, with an average of 168 mm/a; the average recharge rate in the upstream district was greater than that in the downstream; the average recharge rate of irrigated land (193 mm/a) is greater than that of non-irrigated land (110 mm/a). The recharge rate of winter wheat-summer maize and cotton fields with irrigation was 210 mm/a and 140 mm/a, respectively while it was 115 mm/a and 94.1 mm/a under no irrigation conditions. The comprehensive recharge coefficient of groundwater in the upstream irrigation area was larger than that in the downstream. By comparing the spatial distribution of groundwater level and comprehensive recharge coefficient, it was found that there was an inverse relationship between the groundwater level and the comprehensive recharge coefficient.
1. Introduction
Since mid-80s of the last century, researchers began using different methods to study groundwater recharge mechanisms (Allison et al., 1983; Athavale et al., 1983). There are four methods which are most influential and representative (Scanlon et al., 2002; Rueedi et al., 2005; Wang et al., 2008): Physical Method (the water-balance, water table fluctuation), Chemical Tracer Method, Lysimeter, and Numerical Simulation Methods. The spatial-temporal variations of groundwater are too complicated, which may make methods such as lysimeter, physical method less efficient in finding out the evolution characteristics of groundwater recharge in the study area. In comparison to these methods, the artificial tracer method has the advantage of not requiring a large volume of hydrological data and obtaining data more easily. So, it usually be chosen to estimate groundwater recharge and simultaneously determine the recharge sources, the flow speed, the migration time and
1 Water Resources, Hydrologic and Environmental Sciences Division
School of Resources and Environment University of Jinan
No. 336, West Road of Nan Xinzhuang Tel: 13805314691
identify preferred flow paths (Beyer et al., 2016; Bonner et al., 2017; Thomas et al., 2017). In addition, the artificial tracer has the characteristic of wide selectivity, any material with high water solubility, chemical stability, low environmental pollution, simple measurement, high precision, low testing expense, etc., can be used as a tracer.
Therefore, researchers have adopted artificial tracer method to study the correlation characteristics of groundwater recharge for a long time. Zimmermann et al. (1966) pioneered the use of neon as a tracer to study soil water transport. Then neon was widely used as an applied tracer (Porro et al., 1993; Sukhija et al., 1996; Chand et al., 2004). Afterwards, many researchers used bromide as a tracer to study soil solute transport. However, it was rare to use bromine tracer to study groundwater recharge, Rice et al. (1986) used bromine tracer technique to evaluate the recharge rate of bare land under rainfall and irrigation conditions (45 cm). These studies usually put tracers on the surface, which reduced the reliability of the evaluation results. Subsequently, artificial tracers were put to the surface or underground at a certain depth, which could overcome the effects of soil roots and large voids. Rangarajan et al. (2000) analyzed the recharge rate of several basins and watersheds in India by the tritium injection method, which showed the recharge rate ranged from 24 to 198 mm yr−1 or 4.1 to 19.7% of the local average seasonal rainfall. Multiple age tracers were measured to estimate groundwater residence times in the regional aquifer system underlying southwestern Oman, which proved that the age of the confined groundwater was longer in the Dhofar Mountains (Müller et al., 2016). WU et al. (2014) and Tan et al. (2016) took the North China Plain and the Central Plain as an example, using the tracer method to study the groundwater recharge under the conditions of irrigation and non-irrigation.
The main objectives of this study are to 1) evaluate the influence of different irrigation district location, irrigation regime and crop types on the groundwater recharge in Weishan Irrigated District, 2) establish the relationship between the groundwater recharge and the irrigation and rainfall, and 3) develop the relationship between the groundwater level and the comprehensive recharge coefficient.
2. Materials and Methods
2.1. Background of the research area
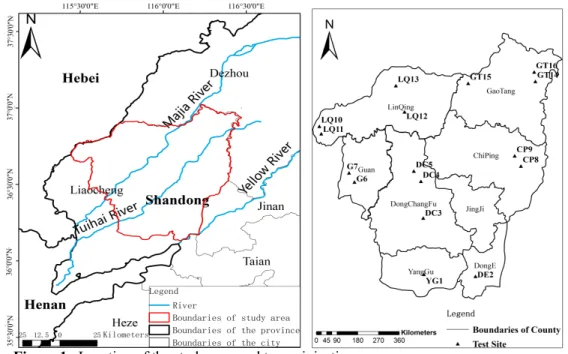
The study area Weishan Irrigated District, the largest Yellow River irrigation area in the lower reaches of the Yellow River, is located in Liaocheng City, Shandong Province. It extends from 113°E to 118°E longitude and 34°N to 36°N latitude with a total area of 5,400 km2. The scale of irrigation area ranks fifth in the whole country, 3600 km2 of which is designed irrigation area. Tuhai River and Majia River passes through from the middle of irrigation area (figure 1), irrigation and precipitation are the main sources of recharge through the shallow groundwater.
In this experiment, the tracer test area was selected by the preliminary investigation, and the bromide was injected on February 9-11, 2015 and sampled on July 25-29, 2015 and May 3-7, 2016. According to the attributes of the testing site, such as spatial location, irrigation, crop planting and so on, a total of 16 sites were selected for particular research (table 1 and figure 1). However, among which 2 sites were abandoned due to the construction of house and road.
Figure 1. Location of the study area and tracer injecting Table 1. Summary of bromide tracing sites.
Administrative
areas Sampling number
Irrigation regime Crop types
Non-irrigated land Irrigated land Winter wheat-
summer maize Cotton Other types
Dongchangfu 3 DC4 DC3、DC5 DC4、DC5 DC3
Linqing 4 LQ11、LQ12 LQ10、LQ13 LQ10、LQ12 LQ13 LQ11
Yanggu 1 YG1 YG1
Chiping 2 CP8 CP9 CP8、CP9
Donge 1 DE2 DE2
Guan 2 G6 G7 G6、G7
Gaotang 3 GT15 GT14、
GT16 GT14、GT16 GT15
Total 16 6 10 12 2 2
* other types mainly include woodland, wasteland etc. 2.2. Background of the research area
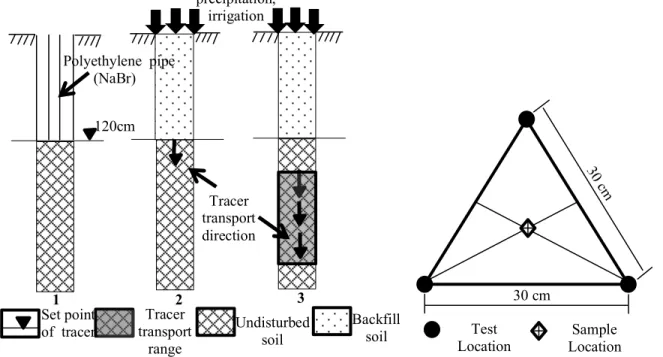
2.2.1 Principles of bromide tracer. The procedure for determining groundwater recharge by tracers is as follows: put in tracers at a known depth, under natural conditions, the tracer will move downward with the precipitation and irrigation water. Because of the different velocity of tracer movement, tracer enrichment will occur under different conditions. The procedure and principle are shown in figure 2.
After a certain period of time, samples are collected to monitor the change of tracer concentration in the section, then the groundwater recharge rate is calculated by observing the downward movement of the tracer peak with the following equation
(1) = r z R v t q q ´ D = ´ D
Where, Rr is the recharge rate (mm/d); v is the vertical infiltrating velocity of soil water
(mm/d); Δt is the time between tracer injection and sampling (d); ΔZ is the depth of tracer peak (mm); and θ is the average soil moisture content within the depth interval ΔZ during
Δt.
Comprehensive recharge coefficient (Rc) is used to study the intensity of the
precipitation or irrigation entering into the groundwater, which can be described as (2)
Where, Rc is comprehensive recharge coefficient (%); P is precipitation during Δt, (mm);
and I is irrigation during Δt, (mm).
Figure 2. The procedure of tracing sites. Figure 3. Schematic figure of testing and sampling location.
2.2.2 Methods of bromide tracer. To ensure a relatively uniform tracer mass concentration distribution at the different depth of the tracer, a tracer was injected using a porous deep injection method, as shown in figure 3. Three holes (2 cm in diameter and 120 cm deep) at the vertices of a 30 cm equilateral triangle were drilled with a sampler for bromine injecting. 50 g NaBr (the bromide tracer) was injected at the holes through a conduit, then buried with raw soil and subjected to soil compaction at intervals of 5 cm. Soil samples were collected at the midpoint of the three injecting points.
2.3. Analysis methods 1) Soil Sampling
At each sampling site, soil samples at different depths (0-4.0 m) were collected by an undisturbed soil sampler. The sampling depth intervals were 20 cm from 0 m to 1.2 m and 10 cm from 1.2 m to 4.0 m. Each soil sample was stored in a plastic bag to minimize evaporation and soil water content was measured using portable electronic balances.
2) Moisture Content
Moisture content was measured by stoving method. As soon as the samples were sent to the laboratory, the soil samples for measuring soil moisture content was put into an oven
100% c Rr t R P I ´ D = ´ + 120cm Polyethylene pipe (NaBr) precipitation, irrigation Tracer transport direction 1 2 3 Set point of tracer Tracer transport range Undisturbed soil Backfill soil 30 cm 30 cm Test
at 105℃ for 24 h. After drying, the quality of the soil was measured by electronic balance, and then the soil water content was obtained by conversion.
3) Bromide Concentration
Bromide concentration was measured by an ion electrode method (Model: Rex
PBr-1-01; Manufactor: BeiJing TongRunYuan Electromechanical Technology Co Ltd). Briefly,
100 mL of deionised water was added to 20 g of drying sample and shaken for 3 h. Then the mixture was placed to separate into layers. The resulting solution was filtered through filter and stored in a polyethylene bottle until analysis.
2.4. Statistical analysis
The recharge characteristics of groundwater under different factors were analyzed by maintaining other effect factors constant. The linear correlation analysis was carried out to study the relationship between the irrigation or precipitation and the recharge rate. The relationship between the groundwater level and the comprehensive recharge coefficient was analyzed using the Kriging Spatial Interpolation method.
3. Results and Discussion
3.1. Bromide concentration and moisture content in the typical sites
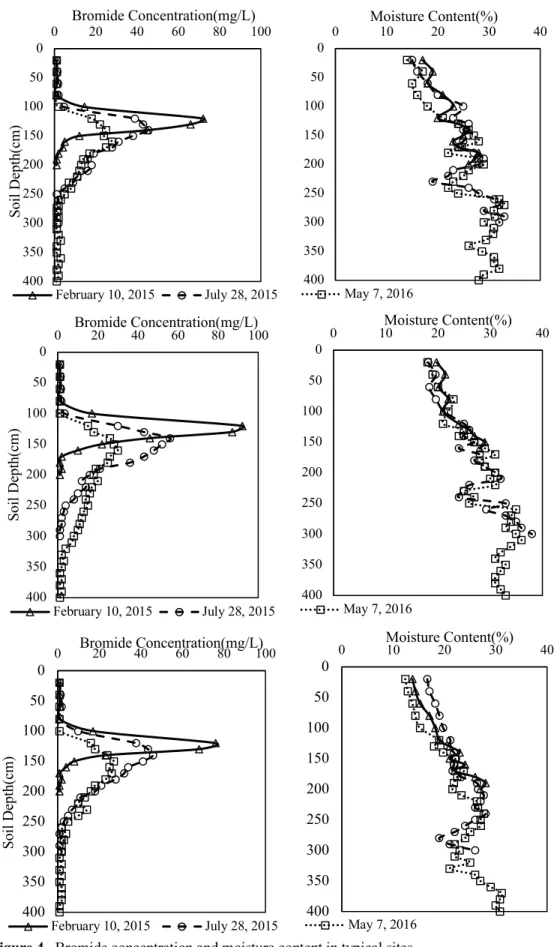
According to the condition of precipitation data and field irrigation, 4 typical sites was selected, which were irrigated district (YG1) and non-irrigated district (DC4) in the upstream; irrigation district (GT14) and non-irrigated district (GT15) in the downstream. The determination results were shown in figure 4.
It can be seen that under the influence of precipitation and surface water, water moves downward to recharge soil moisture and groundwater. Bromide concentration distribution varies considerably at different depths, and has a peak that moves downward gradually with increasing time. Moreover, the velocity of bromine in irrigation area is greater than that in non-irrigated area.
The interannual change trends of soil moisture content at each site are similar, with no significant change and showing a similar distribution. The soil moisture content in
irrigation area is larger than that in non-irrigated area, while the difference of soil moisture content for deep soils was smaller.
400 350 300 250 200 150 100 50 0 0 20 40 60 80 100 Soi l D ept h( cm ) Bromide Concentration(mg/L) February 10, 2015 July 28, 2015 400 350 300 250 200 150 100 50 0 0 Moisture Content(%)10 20 30 40 May 7, 2016
Figure 4. Bromide concentration and moisture content in typical sites. 400 350 300 250 200 150 100 50 0 0 20 40 60 80 100 Soi l D ept h( cm ) Bromide Concentration(mg/L) February 10, 2015 July 28, 2015 400 350 300 250 200 150 100 50 0 0 Moisture Content(%)10 20 30 40 May 7, 2016 400 350 300 250 200 150 100 50 0 0 20 40 60 80 100 Soi l D ept h( cm ) Bromide Concentration(mg/L) February 10, 2015 July 28, 2015 400 350 300 250 200 150 100 50 0 0 10Moisture Content(%)20 30 40 May 7, 2016 400 350 300 250 200 150 100 50 0 0 20 40 60 80 100 Soi l D ept h( cm ) Bromide Concentration(mg/L) February 10, 2015 July 28, 2015 400 350 300 250 200 150 100 50 0 0 10 20 30 40 Moisture Content(%) May 7, 2016
Based on the above analysis, the tracer test results are reasonable except individual testing points where the peak of bromide ion concentration distribution curve did not appear or move up, which cannot objectively reflect the characteristics of groundwater recharge by precipitation and irrigation in the studying district. It is indicated that the tracer test results can be used for preliminary study of groundwater recharge characteristics in Weishan Irrigated District.
3.2. The recharge rate
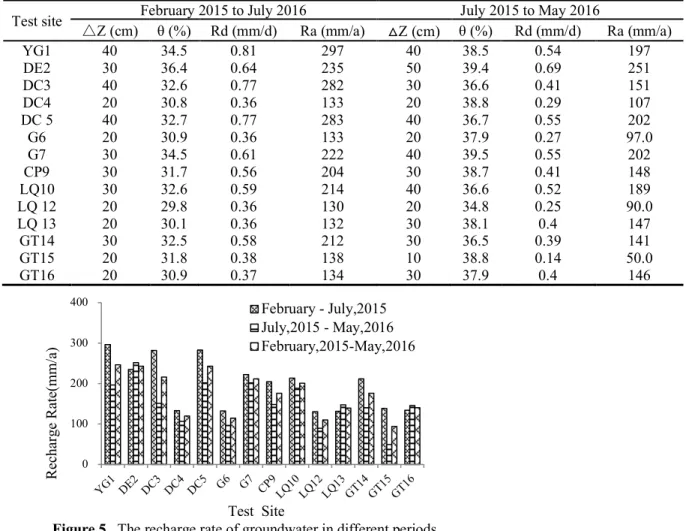
The annual recharge rate for different sites and time in the Weishan Irrigated District were determined by equation (1) based on the tracing test, which is shown in table 2 and figure 5.
Table 2. The recharge rate of groundwater.
Test site △ February 2015 to July 2016 July 2015 to May 2016
Z (cm) θ (%) Rd (mm/d) Ra (mm/a) △Z (cm) θ (%) Rd (mm/d) Ra (mm/a) YG1 40 34.5 0.81 297 40 38.5 0.54 197 DE2 30 36.4 0.64 235 50 39.4 0.69 251 DC3 40 32.6 0.77 282 30 36.6 0.41 151 DC4 20 30.8 0.36 133 20 38.8 0.29 107 DC 5 40 32.7 0.77 283 40 36.7 0.55 202 G6 20 30.9 0.36 133 20 37.9 0.27 97.0 G7 30 34.5 0.61 222 40 39.5 0.55 202 CP9 30 31.7 0.56 204 30 38.7 0.41 148 LQ10 30 32.6 0.59 214 40 36.6 0.52 189 LQ 12 20 29.8 0.36 130 20 34.8 0.25 90.0 LQ 13 20 30.1 0.36 132 30 38.1 0.4 147 GT14 30 32.5 0.58 212 30 36.5 0.39 141 GT15 20 31.8 0.38 138 10 38.8 0.14 50.0 GT16 20 30.9 0.37 134 30 37.9 0.4 146
Figure 5. The recharge rate of groundwater in different periods.
It can be seen that the annual recharge rate from 2015 to 2016 were 85.5-243 mm/a (0.23-0.66 mm/d), with an average in different sites of 168 mm/a. The recharge rates were influenced by irrigation district location, irrigation types and crop types.
3.2.1 Effect of irrigation district locations. Conditions of YG1, DE2, DC5, CP9, GT14, and GT16 (irrigation, winter wheat -summer maize) were almost the same except the irrigation district location. The recharge rates of YG1 and DE2, (upstream district) were 246 mm/a and 243 mm/a, respectively. The recharge rates of DC5, CP9 (midstream) were 242 mm/a and 177 mm/a, respectively. The recharge rates of DT14 and DT16 (downstream) were 176 mm/a and 140 mm/a, respectively. The results showed that the recharge rates for upstream irrigated cropland were greater than those for downstream
0 100 200 300 400 YG1 DE2 DC3 DC4 DC5 G6 G7 CP9LQ10LQ12LQ13GT14GT15GT16 Re ch ar ge Ra te (m m /a ) Test Site February - July,2015 July,2015 - May,2016 February,2015-May,2016
irrigated cropland. The same was true for sites with non-irrigation and the same crops (DC4 and LQ12 as shown in figure 6). Underpinning this phenomenon is that the soil texture in the upstream district was much coarser than that in the downstream, resulting in more rainfall and irrigation water infiltrated into the underground.
Figure 6. The recharge rate of groundwater in different irrigated district location.
3.2.2 Effect of irrigation regime. In the two-year experiment, comparison in paired locations (DC5 and DC4, G7 and G6, DT14 and LQ12, LQ13 and GT15) having nearly the same irrigation district location and crop types showed that there was generally greater recharge in irrigated lands (DC5, G7, DT14 and LQ13, with an average of 192.5 mm/a) than in non-irrigated lands (DC4, G6, LQ12and GT15, with an average of 109.7 mm/a) (figure 7) It is indicated that the utilization rate of irrigation water in irrigated cropland was low and considerable quantity of irrigation water seeped to recharge the groundwater.
3.2.3 Effect of crop types. The influence of different crops on recharge rate was analyzed by comparing groundwater recharge rate of irrigation and non-irrigation testing sites. From figure 7, it appeared that the recharge rate of winter wheat-summer maize (the first three groups) was higher than those of cotton (the fourth group). The recharge rate of the two crops under irrigation condition was 210 mm/a and 140 mm/a, respectively, and was 115 mm/a and 94.1 mm/a under non-irrigation condition. It can be concluded that the soil water use efficiency of cotton was greater than that of winter wheat-summer maize.
Figure 7. The recharge rate of groundwater in different periods in irrigated cropland and non-irrigated land.
3.3. Comprehensive recharge coefficient analysis
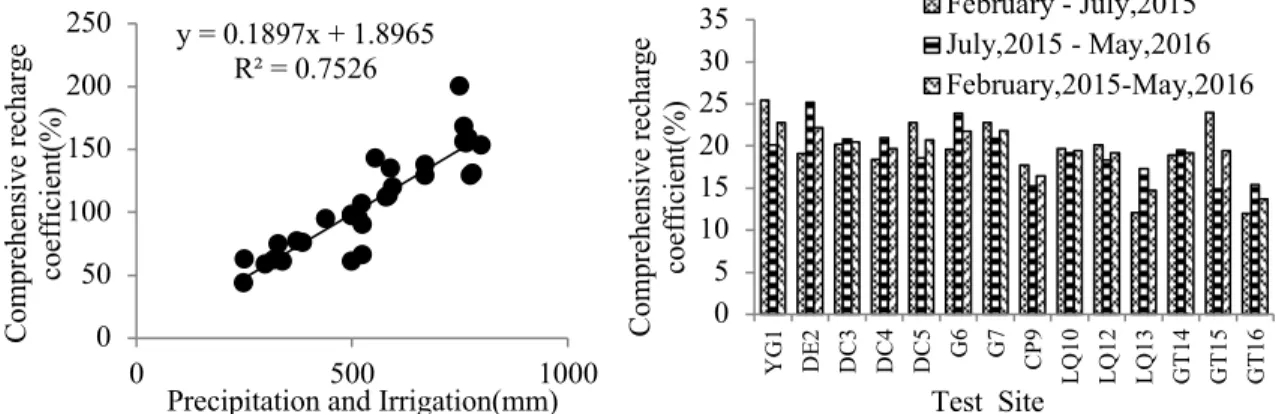
3.3.1 Relationship between recharge coefficient and precipitation and irrigation. In the tracer test, the groundwater recharge was affected by precipitation and surface water irrigation, and the two factors cannot be distinguished. So, the comprehensive recharge coefficient was adopted to determine the spatial distribution characteristics of groundwater
0 100 200 300 YG1 DE2 DC5 CP9 DC4 GT14 GT16 LQ12 Re ch ar ge Ra te (m m /a ) Test Site Irrigation Non-irrigation 0 100 200 300 DC5/DC4 G7/G6 GT14/LQ12 LQ13/GT15 Re ch ar ge Ra te (m m /a ) Test Site Irrigation Non-irrigated
recharge rate in the irrigation area, which can separate the atmospheric precipitation from the infiltration coefficient. According to the average result of bromide tracing, the effects of precipitation or irrigation on the recharge were quantificationally analyzed. There was a linear relationship between the groundwater recharge and the precipitation and irrigation (R2=0.7526, P<0.05), which is shown in figure 8. The linear relationship by least-squares
fitting was R=0.1897(P+I)+1.8965, where R is the comprehensive recharge coefficient (mm/a), P is the precipitation (mm) and I is the irrigation (mm).
Figure 8. Recharge versus precipitation and irrigation. Figure 9. The recharge coefficient of groundwater in different periods. 3.3.2 Spatial variability of recharge coefficients. The precipitation data was provided by Liaocheng Hydrological Bureau, and the amount of surface water irrigation was obtained through investigation. Investigation indicated that the cropland irrigation all adopt border irrigation with irrigation quota of 80 m3 for farmland however, the irrigation quota was relatively small for orchards. Four irrigations were carried out each year between March to May and September to October, so from February 2015 to July 2015, the irrigation water amount was 240 mm for farmland and 180 mm for orchard. According to the tracer test results, the comprehensive recharge coefficient of each testing site was calculated during different testing periods (table 3 and figure 9).
Table 3. The recharge coefficient of groundwater.
test site February 2015 to July 2016 July 2015 to May 2016
P+I (mm) Rc (%) P+I (mm) Rc (%) YG1 543 25.4 768 20.1 DE2 571 19.1 780 25.2 DC3 644 20.2 529 20.8 DC4 334 18.4 369 21 DC 5 574 22.8 789 18.6 G6 315 19.6 317 23.9 G7 455 22.8 757 20.9 CP9 536 17.7 766 15.2 LQ10 497 19.7 761 19.2 LQ 12 297 20.1 381 18.3 LQ 13 497 12.1 661 17.3 GT14 515 18.9 561 19.5 GT15 265 24 261 14.9 GT16 515 12 741 15.4
The average recharge rate determined by bromide tracing tests for different sites varied from 12.0-25.4% and 14.9-25.2%, with the average of 19.5% and 19.3%, respectively. From table 3 and figure 9 it can be seen that the recharge rates changed with the location, irrigation regimes and crop cultivation. The irrigated cropland with winter wheat-summer
y = 0.1897x + 1.8965 R² = 0.7526 0 50 100 150 200 250 0 500 1000 Co m pr eh en si ve r ec ha rg e co ef fi ci en t( % )
Precipitation and Irrigation(mm)
0 5 10 15 20 25 30 35 YG1 DE 2 DC 3 DC 4 DC 5 G6 G7 CP9 LQ 10 LQ 12 LQ 13 GT 14 GT 15 GT 16 Co m pr eh en si ve r ec ha rg e co ef fi ci en t( % ) Test Site February - July,2015 July,2015 - May,2016 February,2015-May,2016
maize in the upstream (YG1) showed the highest recharge rate. The recharge rate of winter wheat-summer maize fields with irrigation (LQ12, DC5) was higher than that of cotton fields with irrigation (LQ13) and cropland with non-irrigation (DC4) in the same location.
The experimental data were spatially interpolated by Kringing Spacial Interpolation methods to analyze the spatial distribution of groundwater recharge characteristics in Weishan Irrigated District, with results shown in figure 10.
Figure10. Spatial distribution map of comprehensive coefficient.
From figure 10 and table 3 it can be seen that the comprehensive recharge coefficient in the upstream district was larger than that in the downstream, which ranged from 20.7% to 22.4% in Yanggu, Dong’e and Liaocheng and from 13.7% to 16.2% in Linqing and Gaotang . This is because the amount of surface water irrigation in the upstream irrigation district is larger than that in the downstream. The other reason is the higher utilization rate of groundwater in the downstream, which is because the soil texture is mostly clay and sandy loam, and the crops are mainly cotton.
3.3.3 Analysis of influencing factors. The difference in precipitation, as well as aquifer lithology and crops lead to the difference in groundwater recharge produced by precipitation. In the study area, the amount of irrigation water decreased gradually from the upstream to the downstream, which resulted in the spatial difference of groundwater recharge produced by irrigation. Moreover, the groundwater recharge was also affected by the buried depth of groundwater level, and a negative correlation was found between them. When the buried depth of groundwater level was deeper, the precipitation and irrigation were mainly consumed by evapotranspiration (figure 11).
Based on the measured data of 25 monitoring wells from 2015 to 2016, the spatial distribution map of groundwater level in the irrigation area was obtained using the method of mathematical statistics and Kriging Spatial Interpolation. Figure 11(a) showed the groundwater level ranged from 20 to 36 m, and the distribution pattern agreed well with the terrain, namely gradually decreasing from the southwest to the northeast. Most importantly, the distribution pattern was approximately the same as that of the recharge coefficient, which was consistent with the rule that the deeper the groundwater table, the smaller the recharge coefficient. The spatial distribution map of evapotranspiration was also obtained by Kriging Spatial Interpolation method, according to the evaporation
capacity of each county during the irrigation season. Figure 11(b) showed that the evaporation ranged from 1085 mm to 1158 mm, which increased gradually from the south to the north. This change pattern agreed with the fact that there was an inverse relationship between the groundwater level and the evaporation.
(a) (b)
Figure11. Spatial distribution map of (a) groundwater level and (b) evapotranspiration.
3.3.4 Temporal variability of the recharge rate. By comparing and analyzing the results of the two tracer tests, the average recharge rates of February-July, 2015 (196 mm/a) was greater than that of July, 2015-May, 2016 (153 mm/a). This is mainly due to the fact that the first test interval of 168 days mainly occurred in the period of spring irrigation and flood irrigation with more concentrated precipitation and surface water irrigation, which resulted in larger infiltration of groundwater recharge. While in the second test interval of 286 days, the precipitation and the irrigation are more dispersed, which led to less recharge of groundwater. The recharge rate of the first test is 20% higher than that of the second time on an average, and the results in this study are consistent with those of Shuai et al. (2014). It is showed that this tracer test is reliable.
4. Conclusions
Bromide was used as tracers in Weishan Irrigated District to determine groundwater recharge, as well as to evaluate the impacting factors of groundwater recharge. The results showed that the variation in recharge rates were affected by the irrigation district location, irrigation regime and crop species and comprehensive recharge coefficient was affected by the buried depth of groundwater level.
(1) The average recharge rate and recharge coefficient determined by bromide tracing for different sites from 2015 to 2016 were 85.5-243 mm/a and 13.7%-22.4%, respectively.
(2) The recharge rate of the upstream district was greater than that of the downstream district, which mainly due to the difference in the soil texture. The coarser the soil texture is, the more the recharge of precipitation and irrigation water to the ground.
(3) The utilization rate of irrigation water in irrigated cropland is low, which led to the recharge rate of irrigated croplands (with an average of 193 mm/a) is far greater than those of non-irrigated lands (with an average of 110 mm/a).
(4) Different crop type resulted in different soil water use efficiency. The average recharge rates of winter wheat-summer maize fields with or without irrigation was 210 mm/a and 115 mm/a, respectively, while those of cotton fields were 140 mm/a and 94.1 mm/a, respectively.
(5) The comprehensive recharge coefficient in the upper and middle district of irrigation area is larger than that in the downstream. The buried depth of groundwater level is inversely proportional to the comprehensive recharge coefficient.
Acknowledgements. Research funding was provided by the Shandong Province Water Conservancy science and technology project (grant no. SDSLKY201606.
References
Allison G B, and Hughes M W, 1983: The use of natural tracers as indicators of soil-water movement in a temperate semi-arid region. Hydrogeology Journal, 60 (1): 157-173.
Athavale R N, Chand R, and Rangarajan R, 1983: Groundwater recharge estimates for two basins in the Deccan Trap Basalt formation. Hydrological Sciences Journal, 28 (4): 525-538.
Beyer M, Jackson B, Daughney C, Morgenstern U, and Norton K, 2016: Use of hydrochemistry as a standalone and complementary groundwater age tracer. Journal of Hydrology, 543: 127-144.
Bonner R, Aylward L, Harley C, Kappelmeyer U, and Sheridan C M, 2017: Heat as a hydraulic tracer for horizontal subsurface flow constructed wetlands. Journal of Water Process Engineering, 16: 183-192. Chand R, Chandra S, Rao V A, Singh V S, and Jain S C, 2004: Estimation of natural recharge and its
dependency on sub-surface geoelectric parameters. Journal of Hydrology, 299 (1): 67-83.
Müller T, Osenbrueck K, Strauch G, Pavetich S, and Al-Mashaikhi K S, 2016: Use of multiple age tracers to estimate groundwater residence times and long-term recharge rates in arid southern Oman. Applied
Geochemistry, 74: 67-83.
Porro I, and Wierenga P J, 1993: Transient and steady-state solute transport through a large unsaturated soil column. Ground Water, 31 (2): 193-200.
Shuai P, Shi L S, Cai S Y, and Yang J Z, 2014: Application of Bromide Tracer on Estimating Groundwater Recharge in North China Plain. Journal of Irrigation and Drainage, 33 (02): 11-16.
Rueedi J, Brennwald M S, Purtschert R, Hofer M, and Kipfer R, 2005: Estimating amount and spatial distribution of groundwater recharge in the Iullemmeden basin (Niger) based on 3H, 3He and CFC-11 measurements. Hydrologilcal Processes, 19 (17): 3285-3298.
Rangarajan R, and Athavale R N, 2000: Annual replenishable ground water potential of India-an estimate based on injected tritium studies. Journal of Hydrology, 234 (1-2): 38-53.
Rice R C, Bowman R S, and Jaynes D B, 1986: Percolation of water below an irrigated field. Soil Science
Society of America Journal, 50 (4): 855-859.
Scanlon B R, Healy R W, and Cook P G (2002). Choosing appropriate techniques for quantifying groundwater recharge. Hydrogeology Journal, 10 (1): 18–39.
Sukhija B S, Reddy D V, Nagabhushanam P, Hussain S, and Giri V Y, 1996: Environmental and injected tracers methodology to estimate direct precipitation recharge to a confined aquifer. Journal of Hydrology, 177 (1-2): 77-97.
Thomas Vienken, Emanuel Huber, Manuel Kreck, Peter Huggenberger, and Peter Dietrich, 2017: How to chase a tracer -combining conventional salt tracer testing and direct push electrical conductivity profiling for enhanced aquifer characterization, Advances in Water Resources, 99: 60-66.
Tan X C, Yang J Z, Song X H, and Zha Y Y, 2013: Estimation of groundwater recharge in North China Plain. Advances in Water Science, 24 (1): 73-81.
Wang B G, Jin M G, Nimmo J R, Yang L, and Wang W F, 2008: Estimating groundwater recharge in Hebei Plain, China under varying land use practices using tritium and bromide tracers. Journal of Hydrology, 356 (1-2): 209-222.
Wu Q H, Zhang W, Lin W J, Zhang F W, and Wang G L, 2014: The Estimation of Groundwater Recharge and Preferential Flow Based on the Applied Tracers: A Case Study of Luancheng and Hengshui Areas in Hebei Province. Acta Geoscientica Sinica, 34 (4): 495-502.
Zimmermann U, Mã¼Nnich KO, Roether W, Kreutz W, and Schubach K, 1966: Tracers determine movement of soil moisture and evapotranspiration. Science, 152 (3720): 346-347.