Population size of Scandinavian
bears (Ursus arctos)
HELENA PURANEN-LI, CAROLINE SOLLEVI AND PER SJÖGREN-GULVE
ISSN 0282-7298
Swedish EPA SE-106 48 Stockholm. Visiting address: Stockholm – Valhallavägen 195, Östersund – Forskarens väg 5 hus Ub. Tel: +46 10-698 10 00,
fax: +46 10-698 10 99, e-mail: registrator@naturvardsverket.se Internet: www.naturvardsverket.se Orders Ordertel: +46 8-505 933 40,
orderfax: +46 8-505 933 99, e-post: natur@cm.se Adress: Arkitektkopia AB, Box 110 93, SE-161 11 Bromma. Internet: www.naturvardsverket.se/publikationer
Swedish EPA SE-106 48 Stockholm. Visiting address: Stockholm - Valhallavägen 195, Östersund - Forskarens väg 5 hus Ub, .
Tel: +46 10 698 10 00, fax: +46 10 698 10 99, e-mail: registrator@swedishepa.se Internet: www.swedishepa.se Orders Ordertel: +46 8 505 933 40,
orderfax: +46 8 505 933 99, e-mail: natur@cm.se Address: CM Gruppen, Box 110 93, SE-161 11 Bromma. Internet: www.swedishepa.se/publications
The authors assume sole responsibility for the con-tents of this report, which
therefore cannot be cited as representing the views of the Swedish EPA.
Population size of Scandinavian
bears
(Ursus arctos)
Denna rapport är ett av de vetenskapliga underlagen inom Natur-vårdsverkets bedömning av referensnivån (FRP) för björn i artikel-17-rapporteringen 2013. Rapporten är skriven på engelska och redovisar kompletterande analyser av den skandinaviska populationen av björn för att bedöma minsta livskraftiga populationsstorlek i relation till två olika genetiska kriterier.
Analyserna gjordes med datorsimuleringar baserade på data från tidigare sårbarhetsanalyser (Rapport 6549) och med ny model-lering av björnhannars reproduktionsframgång, och undersökte hur snabbt den skandinaviska björnstammen förlorar genetisk variation vid olika populationsstorlekar och utan invandring från östligare björnbestånd.
This is one of the scientific reports underpinning the Swedish Environmental Protection Agency’s Article-17 reporting in 2013 of Favourable Reference Population for the brown bear in Sweden. It presents complementary population viability analyses of the Scandinavian population of brown bear (Ursus arctos) to quantify minimum viable population size (MVP) estimates in relation to two criteria for genetic viability.
The analyses were based on simulations without immigration, using demographic data from empirical studies of the Scandinavian population also used in a previous SEPA report (6549), but with updated scientific data on the reproductive success of male bears.
ISSN 0282-7298
HELENA PURANEN-LI, CAROLINE SOLLEVI & PER SJÖGREN-GULVE
Swedish EPA SE-106 48 Stockholm. Visiting address: Stockholm - Valhallavägen 195, Östersund - Forskarens väg 5 hus Ub, .
Tel: +46 10 698 10 00, fax: +46 10 698 10 99, e-mail: registrator@swedishepa.se Internet: www.swedishepa.se Orders Ordertel: +46 8 505 933 40,
orderfax: +46 8 505 933 99, e-mail: natur@cm.se Address: CM Gruppen, Box 110 93, SE-161 11 Bromma. Internet: www.swedishepa.se/publications
The authors assume sole responsibility for the con-tents of this report, which
therefore cannot be cited as representing the views of the Swedish EPA.
Population size of Scandinavian
bears
(Ursus arctos)
Denna rapport är ett av de vetenskapliga underlagen inom Natur-vårdsverkets bedömning av referensnivån (FRP) för björn i artikel-17-rapporteringen 2013. Rapporten är skriven på engelska och redovisar kompletterande analyser av den skandinaviska populationen av björn för att bedöma minsta livskraftiga populationsstorlek i relation till två olika genetiska kriterier.
Analyserna gjordes med datorsimuleringar baserade på data från tidigare sårbarhetsanalyser (Rapport 6549) och med ny model-lering av björnhannars reproduktionsframgång, och undersökte hur snabbt den skandinaviska björnstammen förlorar genetisk variation vid olika populationsstorlekar och utan invandring från östligare björnbestånd.
This is one of the scientific reports underpinning the Swedish Environmental Protection Agency’s Article-17 reporting in 2013 of Favourable Reference Population for the brown bear in Sweden. It presents complementary population viability analyses of the Scandinavian population of brown bear (Ursus arctos) to quantify minimum viable population size (MVP) estimates in relation to two criteria for genetic viability.
The analyses were based on simulations without immigration, using demographic data from empirical studies of the Scandinavian population also used in a previous SEPA report (6549), but with updated scientific data on the reproductive success of male bears.
ISSN 0282-7298
HELENA PURANEN-LI, CAROLINE SOLLEVI
& PER SJÖGREN-GULVE
Complementary analyses
of genetic Minimum Viable
Population size of Scandinavian
bears (Ursus arctos)
HELENA PURANEN-LI, CAROLINE SOLLEVI AND PER SJÖGREN-GULVE
REPORT 6644 • DECEMBER 2014
Complementary analyses
of genetic Minimum Viable
Population size of Scandinavian
bears
(Ursus arctos)
REPORT 6644 • DECEMBER 2014 HELENA PURANEN-LI, CAROLINE SOLLEVI
SWEDISH ENVIRONMENTAL PROTECTION AGENCY
Scandinavian bears (Ursus arctos)
by Helena Puranen-Li, Caroline SolleviInternet: www.naturvardsverket.se/publikationer
The Swedish Environmental Protection Agency
Phone: + 46 (0)10-698 10 00, Fax: + 46 (0)10-698 10 99 E-mail: registrator@naturvardsverket.se
Address: Naturvårdsverket, SE-106 48 Stockholm, Sweden Internet: www.naturvardsverket.se
ISBN 978-91-620-6644-4 ISSN 0282-7298 © Naturvårdsverket 2014 Print: Arkitektkopia AB, Bromma 2014
Cover photo: Magnus Nyman
NORDIC ECOLABEL
Contents
FÖRORD 4 SAMMANFATTNING 5 SUMMARY 6 INTRODUCTION 7 METHODS 11 RESULTS 15 DISCUSSION 17Immigration – gene flow 17
Demographic vs. genetic MVP estimates 18
Acknowledgements 18
REFERENCES 19
APPENDIX: PEER-REVIEW STATEMENTS 21
Dr Sean Hoban (National Institute for Mathematical & Biological Synthesis,
University of Tennessee, USA): 21
Dr Torbjörn Nilsson (County Administrative Board of Värmland, Sweden): 21
Prof. Jon Swenson (Norwegian University of Life Sciences) &
4
Förord
Med anledning av ett regeringsuppdrag 2012–2013 gav Naturvårdsverket Torbjörn Nilsson (fil. dr. i zooekologi) i uppdrag att genomföra kvantitativa sårbarhetsanalyser för att bedöma minsta livskraftiga populationsstorlek (MVP, minimal viable population) för björn, järv och lo baserade på IUCN:s kriterium E. Dessa sårbarhetsanalyser utfördes med programmet VORTEX och omfattade även andra beräkningar som kunde underlätta Naturvårds-verkets fortsatta arbete med att bedöma arternas referensvärden för gynnsam bevarandestatus i Sverige.
I den vetenskapliga granskningen av Nilssons rapport blev modelleringen av björn kritiserad. Det påpekades att kompletterande simuleringar och genetiska MVP-analyser behövdes, då högre reproduktionsframgång hos björn hannarna än värdena som Nilsson använde dokumenterats i publicerad forskning. Denna rapport presenterar dessa kompletterande analyser som utförts av Helena Puranen-Li och Caroline Sollevi vid Stockholms universitet tillsammans med Per Sjögren-Gulve, Naturvårdsverket och docent i naturvårds biologi. Den sist-nämnde var också projektledare för analyserna. Rapporten har genomgått extern granskning av utomstående expertis.
Författarna svarar själva för rapportens innehåll varför det inte kan åbero-pas som Naturvårdsverkets ståndpunkt. Naturvårdsverket framför ett varmt tack till de externa vetenskapliga granskarna för deras granskning och kom-mentarer.
Naturvårdsverket, december 2014
Eva Thörnelöf
Sammanfattning
Den här rapporten är ett av de vetenskapliga underlagen rörande minsta livskraf-tiga populationsstorlek (Minimum Viable Population size; MVP) för Naturvårds-verkets bedömning av Sveriges referensnivå (Favourable Reference Population; FRP) för björn (Ursus arctos) i artikel-17-rapporteringen 2013. Här redovisas kompletterande analyser av den skandinaviska populationen av björn för att bedöma MVP i relation till två olika genetiska kriterier. Analyserna gjordes med datorsimuleringar, baserade på data från tidigare sårbarhets analyser (Nilsson 2013), med ny modellering av björnhannars reproduktions framgång, och under-sökte hur snabbt den skandinaviska björnstammen förlorar genetisk variation vid olika populationsstorlekar, utan mutation och utan invandring från östligare björnbestånd.
Den tidigare analysen (Nilsson 2013) använde resultaten från en analys av skillnad i genetisk variationsgrad (heterozygotigrad) mellan 22 björnar som först undersöktes och 127 björnar som undersöktes 14–16 år senare (Tallmon m.fl. 2004) för att beräkna hur många av björnhannarna som reproducerade sig per år. Beräkningen gav en siffra (3,3% per år) som var betydligt lägre än vad annan forsk-ning om björnhannars reproduktionsframgång visat, både för den skandinaviska björnpopulationen (21,4% per år i södra skandinaviska studieområdet och 56,8% per år i norra studieområdet; Zedrosser m.fl. 2007), samt för grizzlybjörn (Ursus
arctos horribilis; 49%, Craighead m.fl. 1995) och amerikansk svartbjörn (14% per
år; Costello m.fl. 2009). Swenson och Kindberg, som var två av de vetenskapliga granskarna av Nilssons (2013) rapport, kritiserade Nilssons siffra och menade att den var för låg och att kompletterande MVP-analyser behövdes med data på repro-duktionsframgången från Zedrosser m.fl.s undersökningar (2007).
Följaktligen genomfördes kompletterande analyser med den ålderspecifika reproduktionsframgång som Zedrosser m.fl. (2007) uppmätt i det södra studie-området av den skandinaviska populationen. Den södra delens värden använ-des dels eftersom Nilssons (2013) analyser visade att MVP-värdena baserade på modellering och data från den södra populationsdelen i samtliga fall även var gil-tiga för den norra populationsdelen, och dels eftersom betydligt fler björn hannar undersökts i södra (44 st) än i det norra studieområdet (24 st). Den ålders specifika modelleringen av björnhannarnas reproduktionsframgång var det enda som skilde från de input-data som Nilsson (2013) använde för VORTEX-simuleringarna av björn. Analyserna gjordes med respektive utan effekter av sällsynta katastrofer, precis som i Nilssons rapport (2013), och utan invandring av björnar från östli-gare populationer (Finland, Ryssland). Analyserna visade att det genetiska MVP-värdet motsvarande mindre än 5% förlust av genetisk variationsgrad på 100 år motsvarades av minst 400 björnar när sällsynta katastrofer fanns med, och minst 380 björnar om katastrofer ej fanns med. MVP-värdet motsvarande den gene-tiskt effektiva populationsstorleken (Ne) minst 500, blev minst 2350 när sällsynta
katastrofer fanns med och minst 2250 om katastrofer ej kunde ske. Resultaten diskuteras bland annat i relation till huruvida den skandinaviska populationen är isolerad eller ej från östligare populationer, till de skandinaviska björnarnas gene-tiska särprägel, och till tänkbara FRP-värden.
6
Summary
This short report presents the results of analyses and assessment of genetic Minimum Viable Population size of Scandinavian bears (Ursus arctos) that complement the population viability analyses already performed by Torbjörn Nilsson (2013).
This is one of the scientific reports underpinning the Swedish Environmental Protection Agency’s Article-17 reporting in 2013 of Favourable Reference Population size for the brown bear in Sweden. It presents complementary pop-ulation viability analyses of the Scandinavian poppop-ulation with the VORTEX software to quantify minimum viable population size (MVP) estimates in rela-tion to two criteria for genetic viability. The analyses were based on simularela-tions without immigration and mutation, and using the same demographic data from empirical studies of the Scandinavian population as were used in a previous SEPA report (6549), except for the updated data on the reproductive success of males.
The genetic MVP corresponding to < 5% loss of genetic variability (i.e. heterozygosity) in 100 years was estimated at > 380 bears when effects of catastrophes were not simulated, and at > 400 bears when effects of rare catastrophes were included. The genetic MVP corresponding to an effective population size (Ne) of > 500 was estimated at > 2250 bears when effects of catastrophes were not simulated, and at > 2350 bears when rare catastrophes were included. The study approach and results are discussed, for example, in relation to the two MVP criteria, FRP, and to the degree of genetic differen-tiation and isolation of the Scandinavian bear population.
Introduction
Population viability analyses of the Scandinavian populations of brown bear (Ursus arctos), Eurasian lynx (Lynx lynx) and wolverine (Gulo gulo) were recently presented by Torbjörn Nilsson (Nilsson 2013). The analyses and scientific report were part of a government commission on Minimum Viable Population (MVP) estimates, and also intended to form support for further development of the management plans for the species in Sweden. The analyses included estimates of MVP based on empirical data and simulations.
The MVP estimates for the brown bear (Table 1) were questioned in the peer review of the report (Swenson & Kindberg 2013). The annual mating success value of 3.3% that Nilsson calculated from a reported change in hetero-zygosity between generations in the population quantified by repeated sam-pling by Tallmon et al. (2004) and applied to all adult males, was criticized for being too low. Swenson and Kindberg argued that analyses based on mea-sured reproductive success (Zedrosser et al. 2007) should also have been per-formed to compare with Nilsson’s results. Zedrosser et al. (2007) used genetic paternity analyses to determine which male bears of known age sired offspring that had survived to yearling age in both the southern and northern parts of the Scandinavian population and which ones did not. They found that, on average, 21.4% of the adult male bears (n = 44) produced young that became yearlings per year in the southern part and 56.8% in the northern (n = 24), i.e. much higher than the 3.3% estimated to have reproduced by Nilsson from Tallmon et al.’s (2004) results. The results of Zedrosser et al. (2007) are con-servative, because they estimated the age-specific siring of young that survived to be yearlings. Their estimates would probably have been higher if they had been able to document the percentage of the males that sired young-of-the-year. Also other studies on reproduction success of male bears have demonstrated higher values: 49% of male grizzly bears (Ursus arctos horribilis) bred success-fully (Craighead et al. 1995), and 14% of the males reproduced per year in a black bear (Ursus americanus) population (Costello et al. 2009).
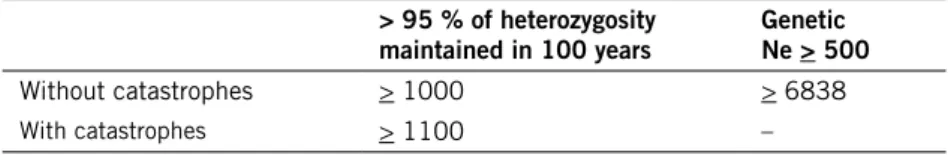
Table 1. MinimumViable Population size estimates presented by Nilsson (2013) based on the southern brown bear population in Sweden.
> 95 % of heterozygosity
maintained in 100 years Genetic Ne > 500
Without catastrophes > 1000 > 6838
With catastrophes > 1100 –
Nilsson chose his approach based on the assumption that the reproduction rate of the sampled individuals in Zedrosser et al. (2007) was not representa-tive for the entire male population. This conclusion was based on the finding that bears in Sweden were found in core and peripheral areas, with higher female density in the core areas and younger adult males primarily in the
8
periphery (Swenson et al. 1998). Thus these males would have much fewer opportunities to reproduce. However, comments by Swenson & Kindberg (2013) and personal communication (Swenson, Kindberg & Zedrosser, pers. comm.) regarding the distribution of the bear population yielded a clearer and updated picture of the current distribution. The female core areas have expanded and both males and females in lower density areas have larger home range sizes (Dahle & Swenson 2003), indicating that very few males currently reside in areas without females (Figure 1); consequently Swenson & Kindberg (pers. comm.) concluded that Zedrosser et al’s data (2007) are representative for bears in Sweden today.
Figure 1. The distribution range of bears in Sweden has changed since 1998. The dotted lines
show the core areas as they were shown in Swenson et al. (1998). The spots represent females (red spots) and males (blue spots) shot by hunters between 1981 and 2010. The female core areas have expanded resulting in very few males residing in areas without females (Kindberg et al. 2009, Swenson & Kindberg, pers. comm. 2013).
The Swedish Environmental Protection Agency initiated further analyses to deal with these comments. This report presents genetic MVP values for the Scandinavian bear population using demographic data from its southern part (“southern bear population”) and VORTEX simulations with the same data set as Nilsson (2013), but with the age-specific yearly reproductive success values (YRS) presented by Zedrosser et al. (2007), instead of 3.3%. We chose to focus on the southern bear population, because Nilsson’s (2013) results con-sistently showed higher MVP values with demographic data from the southern part of the population than with data from the northern part, i.e. the MVP values based on data from the southern part were consistently valid also for the northern demographic scenarios. Furthermore, Zedrosser et al.’s (2007) YRS values from the southern study area were based on a greater number of male bears than in the northern area and were lower, thus yielding MVP esti-mates which would err on the conservative side, i.e. also apply, in the northern part of the population.
Nilsson (2013) carried out sensitivity tests of the VORTEX models for all three species and input scenarios. Regarding effects on heterozygosity loss, he found that increased catastrophe severity and reduced proportion of males breeding had the strongest effects on heterozygosity loss. Thus we anticipated that changing the annual percentage of males breeding (a nearly seven-fold increase) would affect the MVP estimates.
The genetic MVP criteria used were: (A) the population size at or above which the population’s genetic effective size (Ne) is > 500 (Franklin 1980; long-term MVP in Nilsson 2013). At this effective population size, the loss of overall heterozygosity – and to the same extent quantitative genetic variation in poly-genic characters – is expected to be counterbalanced by the heterozygosity cre-ated by mutations, i.e. the level of overall polygenic variability is maintained in the long term; and (B) the population size at or above which the simulated population loses less than 5% of its heterozygosity in 100 years (Allendorf & Ryman 2002; short-term genetic MVP in Nilsson 2013).
Methods
All simulations were performed with the program VORTEX version 9.99c (Lacy et al. 2005), which is available at http://www.vortex9.org/vortex.html. The program is described in detail by Miller & Lacy (2005).
MVP values were estimated based on two different criteria: (A) the mini-mum population size fulfilling a genetic effective population size Ne > 500 (long-term MVP), and (B) the minimum population size at which 95 % or more of the initial heterozygosity remains after 100 years (short-term MVP). VORTEX does not include mutation in its simulations. Thus, to find the population size meeting the criterion of Ne > 500, we calculated the expected heterozygosity after 100 years according to:
= 1 − 2N1 e t
(
(
(
(
Ht HoEquation 1. Ht/Ho describes the remaining proportion of heterozygosity after t generations,
Ne = the (harmonic mean) effective population size, t = number of generations.
Nilsson (2013) showed that the generation time of the bears in the southern subpopulation was 10.97 years, yielding that 100 years equal 9.116 generations (t = 9.116). Thus, equation 1 predicts that when Ne = 500, the proportion of remaining heterozygosity after 100 years [i.e. (1–1/1000)9.116] is expected to be
0.991. We subsequently used VORTEX simulations to find the minimum popu-lation size at which such a proportion of the initial heterozygosity remained, on average, after 100 years and which would correspond to Ne = 500.
We modelled two different scenarios, with and without catastrophes. In the catastrophe scenario the probability of catastrophes was set at 1 % per year, so on average there was one catastrophe per simulation run of 100 years, similar as was done in Nilsson (2013). During a catastrophe year, the individ-ual survival of all bears was reduced by half and all reproduction failed.
Instead of using a mean reproduction rate for all males (3.3%; Nilsson 2013), we used age-specific reproduction data collected for males whose ages were known, based on the results of a genetic paternity analysis (Figure 2; Zedrosser et al. 2007). To assess if the results were applicable despite some young males residing outside the study area, which could produce uncer-tainty in the reproductive rates of younger males (age 3–5), we also performed simulations with reduced reproduction by 25% and 50% for these three age classes. Except for the values of age-specific %Males Successfully Producing Offspring (function used in VORTEX1) gathered from Zedrosser et al. (2007),
we used the same input values as in Nilsson’s (2013) Base scenario (Table 2). For more detailed information, see Nilsson (2013).
1 Function used in Vortex as age-specific percentage of males successfully siring offspring (A = age):
=((A=3)*4.8)+((A=4)*11.4)+((A=5)*15.2)+((A=6)*15.6)+((A=7)*29.6)+((A=8)*30.4)+((A=9)*27.3)+ (((A=10)OR(A=11)OR(A=12)OR(A=13)OR(A=14))*23)+((A>=15)*34.9)
12
Figure 2. Annual percentage of male brown bears successfully siring offspring that lived to become
yearlings at different ages in the southern study area documented by Zedrosser et al. (2007) using genetic paternity analysis.
Inbreeding depression is measured in terms of lethal equivalents (LE), which represents the quantity of deleterious recessive alleles in the population. Similar to Nilsson’s (2013) Base Scenario simulations, LE was set to 6.5.
We ran 2500 or 10000 simulations with various initial population sizes N0 = K (carrying capacity, maximum population size), similar to Nilsson (2013), to find the population size meeting the respective MVP criteria. The initial population size (N0) in the search of the short-term MVP was set in intervals
of 10 animals, whereas the simulations for the long-term MVP were done with N0-intervals of 50 animals.
Table 2. Demographic input data used in simulations of the southern bear population. Table copied from Nilsson (2013) with bold values showing the modified age-specific reproduction success among males used in this study.
Reproduction Southern area,
Base scenarios Values taken from or calculated from data in
Age of 1st offspring for females 4 Zedrosser et al. 2009, table 1 & 3
Age of 1st offspring for males 3 Zedrosser et al. 2007
Maximum age of reproduction 27 Zedrosser et al. 2007
Max litter size 4 Zedrosser et al. 2009
Mean litter size 2.289 Zedrosser et al. 2009, table 2
SD litter size 0.884 Zedrosser et al. 2009, table 2
Sex ratio at birth, % males 50 Jon Swenson, pers.comm.
% adult females breeding 57.5 Zedrosser et al. 2009, table 2
SDEV in # breeding females 17.8 Nilsson (2013)
% of males breeding a certain year
From age 3 to 4 4.8 Zedrosser et al. 2007
From age 4 to 5 11.4 Zedrosser et al. 2007
From age 5 to 6 15.2 Zedrosser et al. 2007
From age 6 to 7 15.6 Zedrosser et al. 2007
From age 7 to 8 29.6 Zedrosser et al. 2007
From age 8 to 9 30.4 Zedrosser et al. 2007
From age 9 to 10 27.3 Zedrosser et al. 2007
From age 10 to 14 23 Zedrosser et al. 2007
From age 15 to 27 34.9 Zedrosser et al. 2007
Mortality rates (%)
Female mortality from age 0 to 1 35 Swenson et al. 2001
SDEV in 0 to 1 female mortality 27.6 Nilsson (2013)
Female mortality from age 1 to 2 17.7 Bischof et al. 2009, table 2 SDEV in 1 to 2 female mortality 13.5 Nilsson (2013)
Female mortality from age 2 to 3 6 Bischof et al. 2009, table 2 SDEV in 2 to 3 female mortality 2.2 Nilsson (2013)
Female mortality from age 3 to 4 6 Bischof et al. 2009, table 2 SDEV in 3 to 4 female mortality 1.1 Nilsson (2013)
Female mortality from age 4 to 5 6 Bischof et al. 2009, table 2 SDEV in 4 to 5 female mortality 0.54 Nilsson (2013)
Female annual mortality after age 5 6.6 Bischof et al. 2009, table 2 SDEV in female mortality after age 5 0.59 Nilsson (2013)
Male mortality from age 0 to 1 35 Swenson et al. 2001
SDEV in 0 to 1 male mortality 27.6 Nilsson (2013)
Male mortality from age 1 to 2 8.6 Bischof et al. 2009, table 2
SDEV in 1 to 2 male mortality 6.5 Nilsson (2013)
Male mortality from age 2 to 3 18.3 Bischof et al. 2009, table 2
SDEV in 2 to 3 male mortality 6.6 Nilsson (2013)
Male mortality from age 3 to 4 18.3 Bischof et al. 2009, table 2
SDEV in 3 to 4 male mortality 3.3 Nilsson (2013)
Male mortality from age 4 to 5 18.3 Bischof et al. 2009, table 2
SDEV in 4 to 5 male mortality 1.6 Nilsson (2013)
Male annual mortality after age 5 10.7 Bischof et al. 2009, table 2 SDEV in male mortality after age 5 0.96 Nilsson (2013)
Expected annual growth rate (λ)
Results
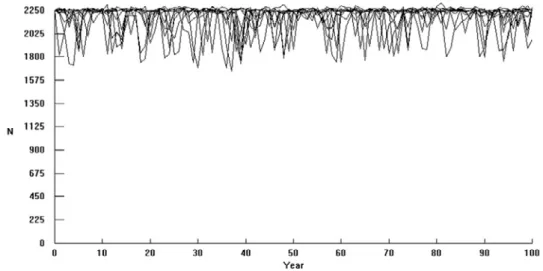
The criterion Ne > 500 yielded MVP estimates of 2250 and 2350, without (Figure 3) and with catastrophes, respectively (Table 3). The population size required to maintain > 95% heterozygosity in 100 years was estimated to be 380 without catastrophes and 400 with catastrophes (Figure 4; Table 3). These MVP-values did not change when simulations were performed with reduced reproduction rates for 3–5 year-old males. Extinction did not occur in any of the simulations.
Figure 3. A demonstration of how population size (N) may fluctuate over 100 years in the simulations
without catastrophes.
Figure 4. VORTEX simulation showing how a Scandinavian brown bear population with N0 = 400 can fluctuate during 100 years when affected by catastrophes. Stars (*) indicate when a catastro-phe has occurred.
16
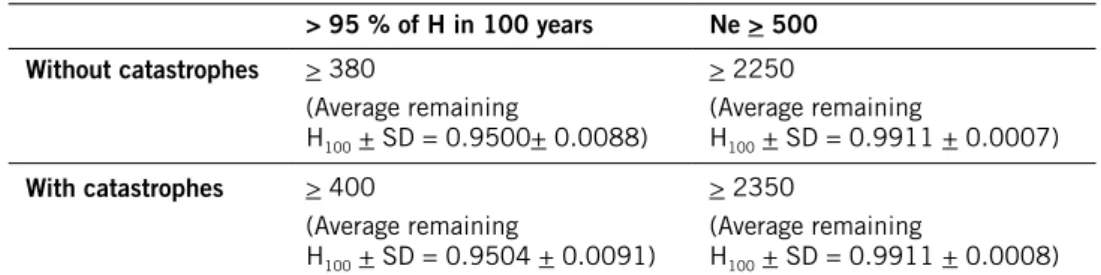
Table 3. Population sizes required to meet the Minimum Viable Population (MVP) criteria Ne > 500
and > 95% remaining heterozygosity in 100 years, respectively, with and without catastrophes. In the final simulations, we ran 10000 replicates to assess the MVP with > 95% heterozygosity retained in 100 years, and 2500 replicates to assess Ne > 500. SD is the standard deviation in
the remaining heterozygosity (H) after 100 years among the replicates. Population extinction did not occur in any of the simulations (Pext < 0.0005 during 100 years).
> 95 % of H in 100 years Ne > 500 Without catastrophes > 380 (Average remaining H100 + SD = 0.9500+ 0.0088) > 2250 (Average remaining H100 + SD = 0.9911 + 0.0007) With catastrophes > 400 (Average remaining H100 + SD = 0.9504 + 0.0091) > 2350 (Average remaining H100 + SD = 0.9911 + 0.0008)
Discussion
From a genetic perspective, a well-established goal for long-term population viability is an effective population size (Ne) of > 500 (Franklin 1980). Our
analy-ses indicated that a minimum population size of 2350 was required to meet this criterion with the demographic rates for the southern brown bear population with catastrophes. To retain more than 95% of the heterozygosity in 100 years, on the other hand, the Scandinavian bear population must have a minimum of 400 individuals. Both MVP values assume an approximately stable age distri-bution in the population.
The noticeable difference between our bear MVP estimates (2350 and 400) and those in Nilsson’s (2013) report (6838 and 1100, respectively) is explained by the change of one particular parameter, male reproductive success, as pre-dicted e.g. by the model sensitivity analyses by Nilsson (2013). This illustrates the impact of male reproductive success on the MVP estimates. The expected annual population growth rate (λ) was estimated at 1.142 in Nilsson’s report (“Base sce-nario”) and 1.145 using our data. No population extinction occurred at the pop-ulation levels for the genetic MVP estimates, either in his simpop-ulations or in ours.
The reproductive success estimated by Nilsson originates from an empiri-cally measured change in genetic variation (Tallmon et al. 2004). This change might have been unrepresentative due to sampling error. In the study popula-tion of approximately 700 bears, Tallmon et al.’s sample in the first generapopula-tion (n1 = 22) was not large and may have suffered from sampling bias to a much greater extent than the second sample (n2 = 127), taken 14–16 years later. We
cannot exclude the possibility that the heterozygosity of the 22 sampled bears may have been biased high. Tallmon et al.’s (2004) study would have produced more reliable results if the first genetic sample also had included in the order of 100 individuals and not merely 22.
Our supplementary analyses with reduced reproduction rate (25% and 50%) for young males (age 3–5) did not have a noticeable effect on the MVP values. This indicates that despite the fact that some males might have resided outside the study area, which might yield an over-estimated reproductive rate for young males (3–5 years old), such young males’ reproduction did not have a strong effect on the genetic MVP estimates.
Immigration – gene flow
The results of Manel et al. (2007; their Fig. 6b) indicate that long-range dispersal by some individual bears may occur within Scandinavia, but Kopatz et al. (2014; their Fig. 4b) found no bears with Finnish or Russian genetic characteristics (putative migrants) in Scandinavia (n = 181). We thus modeled the Scandinavian bear population as having no immigration from more eastern populations.
Using 12 microsatellite markers, Schregel et al. (2012) reported that bears from Västerbotten (Sweden) had lower heterozygosity (H–obs = 0.69) than conspe-cifics from Troms (0.74), Pasvik (0.80) and Karelia (0.78). The FST-values
(averaged over loci) among the bear populations in their study were 0.091** < FST < 0.12** suggesting moderate genetic connectivity. But Schregel et al.’s
18
Bayesian analysis (BayesAss), on the other hand, indicated ongoing limits to gene flow towards the west, and the existence of barriers to migration between the eastern and western brown bear populations of Northern Europe. FST values require many generations to approach an equilibrium situation and also exhibit great sampling error. Whitlock & McCauley (1999; their Fig. 3) showed that at effective population sizes of 100–1000 and a migration rate 0.001 < m < 0.01 (i.e. combinations ranging from 0.1 to 10 genetically effective migrants per generation; cf. Mills & Allendorf 1996), from 100 to more than 1000 generations is required for equilibrium. And the generation time of the Scandinavian bears is 11 years (Nilsson 2013). Thus, we think the above FST values should be interpreted with
caution and are likely to reflect the past, rather than the present, situation. A similar study on the North-European lynx (Lynx lynx; Hellborg et al. 2002) demonstrated slightly higher FST values (0.136*** < FST < 0.291***) and also that clustering based on Nei’s genetic distance D classified the Scandinavian and the Finnish-Baltic lynxes as two distinct groups. Schregel et al. (2012) did not present any neighbor-joining analysis but their Figure 3 (PCA) and Table 5 (Bayesian analysis) indicated a similar overall pattern as in Hellborg et al. (2002). Therefore, we believe it is more cautious to view the Scandinavian bears as not being coherent with the more eastern North European populations at pre-sent. Thus, we view our modeling results as applying to the Scandinavian rather than to a Fennoscandian or pan-North-European population.
Demographic vs. genetic MVP estimates
Regarding the choice of MVP value in relation to criteria for assessment of Favourable Reference Population (FRP; Evans & Arvela 2011, Laikre et al. 2009) for the Scandinavian bears, it is important to consider that 100 years cover only 9 bear generations. Thus, using a MVP that quantifies loss of heterozygosity during 100 years is not enough to evaluate long-term viability. For the Scandinavian bears, we therefore consider the Ne > 500 criterion is more appropriate for the FRP assessment. This will also help conserve the genetic characteristics of the population to a larger extent (cf. Schregel et al. 2012).
The large difference between the estimated MVP values presented in this report compared to those presented by Nilsson (2013) demonstrates that accu-rate knowledge about male reproductive success may also be important when estimating genetic MVPs. For this assessment of the Scandinavian bears, we chose a precautionary approach, using the demographic data from the south-ern part of the population, which had lower average male reproductive success (Zedrosser et al. 2007) and the MVP-values of which also applied to the bears in the northern part (Nilsson 2013). Future research – e.g. within the Scandinavian Bear Project – might investigate this issue further. The analyses and results in this report are based on the best information currently available.
Acknowledgements
We are very grateful for the help and the provisioning of input data by the Scandinavian Bear Project, especially Andreas Zedrosser, and for the review comments by Sean Hoban, Jonas Kindberg, Torbjörn Nilsson and Jon Swenson.
References
Allendorf FW & Ryman N (2002). The role of genetics in population viability analysis. In: Population viability analysis. Eds. Beissinger SR & McCullough DR. University of Chicago Press. Pp. 50–85.
Bischof R, Swenson JE, Yoccoz NG, Ysterud A & Gimenez O (2009). The magnitude and selectivity of natural and multiple mortality causes in hunted brown bears. Journal of Animal Ecology, 78(3), 656–665.
Costello CM, Creel SR, Kalinowski ST, Vu VN & Quigley HB (2009). Determinants of male reproductive success in American black bears.
Behavioural Ecology and Sociobiology, 64, 125–134.
Craighead L, Paetkau D, Reynolds HV, Vyse ER & Strobeck C (1995) Microsatellite analysis of paternity and reproduction in Arctic Grizzly bears.
Journal of Heredity, 86(4), 255–261.
Dahle B & Swenson JE (2003). Seasonal range size in relation to reproductive strategies in brown bears Ursus arctos. Journal of Animal Ecology, 72, 660–667.
Evans D & Arvela M (2011). Assessment and reporting under Article 17
of the Habitats Directive – Explanatory Notes & Guidelines for the period 2007–2012. Final version July 2011. European Topic Centre on Biological
Diversity. https://circabc.europa.eu/sd/d/2c12cea2-f827-4bdb-bb56-3731c9fd8b40/Art17%20-%20Guidelines-final.pdf
Franklin IA (1980). Evolutionary change in small populations. In: Conser
vation Biology – An EvolutionaryEcological Perspective. Eds. Soulé ME &
Wilcox BA. Sinauer Associates, Sunderland, Massachusetts. Pp. 135–150. Hellborg L, Walker CW, Knispel Rueness E, Stacy JE, Kojola I, Valdmann H, Vilà C, Zimmermann B, Jakobsen KS & Ellegren H (2002). Differentiation and levels of genetic variation in northern European lynx (Lynx lynx) populations revealed by microsatellites and mitochondrial DNA analysis. Conservation
Genetics, 3(2), 97–111.
Kindberg J, Ericsson G & Swenson JE (2009). Monitoring rare or elusive large mammals using effort-corrected voluntary observers. Biological Conservation, 142, 159–165.
Kopatz A, Eiken HG, Aspi J, Kojola I, Tobiassen C, Tirronen KF, Danilov PI & Hagen SB (2014). Admixture and Gene Flow from Russia in the Recovering Northern European Brown Bear (Ursus arctos). PLoS ONE, 9(5): e97558. doi:10.1371/journal.pone.0097558.
Lacy RC, Borbat M & Pollak JP (2005). VORTEX: A Stochastic Simulation
20
Laikre L, Nilsson T, Primmer CR, Ryman N & Allendorf FW (2009).
Importance of genetics in the interpretation of Favourable Conservation Status.
Conservation Biology, 23(6), 1378–1381.
Manel S, Berthoud F, Bellemain E, Gaudeul M, Luikart G, Swenson JE, Waits LP & Taberlet P (2007). A new individual-based spatial approach for identifying genetic discontinuities in natural populations. Molecular Ecology, 16, 2031–2043. Miller PS & Lacy RC (2005). VORTEX: A Stochastic Simulation of the Extinc
tion Process. Version 9.50 User’s Manual. Apple Valley, MN: Conser vation
Breeding Specialist Group (SSC/IUCN). http://www.vortex9.org/v950manual.pdf. Mills LS & Allendorf FW (1996). The One-Migrant-per-Generation rule in con-servation and management. Concon-servation Biology, 10(6), 1509–1518.
Nilsson T (2013). Population viability analyses of the Scandinavian populations of bear (Ursus arctos), lynx (Lynx lynx) and wolverine (Gulo gulo). Swedish
Environmental Agency Report 6549.
Schregel J, Kopatz A, Hagen SB, Brøseth H, Smith ME, Wikan S, Wartiainen I, Aspholm PE, Aspi J, Swenson JE, Makarova O, Polikarpova N, Shneider M, Knappskog PM, Ruokonen M, Kojola I, Tirronen KF, Danilov PI & Eiken HG (2012). Limited gene flow among brown bear populations in far Northern Europe? Genetic analysis of the east–west border population in the Pasvik Valley. Molecular Ecology, 21(14), 3474–3488.
Swenson J & Kindberg J (2013). Appendix 2 in Population viability analyses of the Scandinavian populations of bear (Ursus arctos), lynx (Lynx lynx) and wolverine (Gulo gulo). Swedish Environmental Agency Report 6549. Pp. 74–78. Swenson JE, Sandegren F, Brunberg S & Segerström P (2001). Factors associated with loss of brown bear cubs in Sweden. Ursus, 12(1), 69–80.
Swenson JE, Sandegren F & Söderberg A (1998). Geographic expansion of an increasing brown bear population: evidence for presaturation dispersal. Journal
of Animal Ecology, 67(5), 819–826.
Tallmon DA, Bellemain E, Swenson JE & Taberlet P (2004). Genetic monitoring of Scandinavian brown bear effective population size and immigration. Journal
of Wildlife Management, 68(4), 960–965.
Whitlock MC & McCauley DE (1999). Indirect meaures of gene flow and migration: FST ≠ 1/(4Nm+1). Heredity, 82, 117–125.
Zedrosser A, Bellemain E, Taberlet P & Swenson JE (2007). Genetic estimates of annual reproductive success in male brown bears: the effects of body size, age, internal relatedness and population density. Journal of Animal Ecology, 76(2), 368–375.
Zedrosser A, Dahle B, Støen O-G & Swenson JE (2009). The effects of primi parity on reproductive performance in the brown bear. Oecologia, 160(4), 847–854.
Appendix: Peer-review statements
Dr Sean Hoban (National Institute for
Mathematical & Biological Synthesis,
University of Tennessee, USA):
The “Complementary analyses of genetic Minimum Viable Population size of Scandinavian bears (Ursus arctos)” by Puranen-Li et al. provides a valuable addendum to the full PVA analysis performed by Nilsson. Puranen-Li et al. contribute insightful commentary as well as an additional simulation of viabil-ity using different assumptions than those used by Nilsson. This additional simulation results in a revised (downward) estimate of MVP (minimum viable population) size that should be considered along with the main PVA report. The complementary analyses are well-explained, concise, and well-written.
The authors have nicely addressed the critiques from my peer review of the document. Foremost, in response to my principal consideration, the authors included better explanations of parameter choice and more references from other bear reproduction studies. Thus I am more or less convinced that the higher proportion of male reproductive success is plausible and even probable. The analysis of Puranen-Li et al is now very suitable due to these explanations and references.
It is also good that the authors are quite clear about exactly the parameter that was changed (age 3–5 year old males). I think the parameterization is inno-vative and useful. It is a pity that, regarding my third suggestion, the authors cannot provide a temporal map of the range. But I understand the time con-straint, and the Figure is not necessary. It is also a pity that the authors do not perform more modeling of possible catastrophes e.g. from climate-induced fire, disease, or food shortage. It would be highly interesting and important to explore sensitivity of the population to catastrophes. Though I understand this is probably outside the study scope.
I think the section on migration is also quite good, clear and a useful sum-mary, and I appreciate the sentences on research needs, e.g. more accurate estimates via the Scandinavian Brown Bear Project, mentioned in the closing par-agraph. A very good conclusion. Overall I’m quite pleased with the result and support final publication of this report. I would categorize it as “very good.”
Dr Torbjörn Nilsson (County Administrative
Board of Värmland, Sweden):
This is a well-performed and well-written study. It complements my study (Nilsson 2013) by assessing MVP values for bear in Scandinavia, according to long-term and short-term genetic MVP criteria, in a way that I might have preferred to do it unless an empirical measurement of the rate of heterozygo-sity loss had been available for one of the subpopulations within Scandinavia.
22
To my knowledge, the present study may be the first Vortex-based PVA where the annual probability of reproducing in males is modeled as a function of age. This is interesting as a demonstration of the increased flexibility of the more recent versions of the PVA package Vortex. Comparing the results between the present study and mine is interesting because the difference clearly illustrates how strong effect the proportion of males taking part in reproduction may have on the rate of loss of heterozygosity, and hence also on the Ne/N ratio and on genetic MVP values. This supports and reinforces one of the clusions from the sensitivity analyses in my study. I agree with the general con-clusion in the present report that knowledge about how reproductive success is distributed among males may be important when estimating genetic MVPs. At the same time, I disagree with the claim that the results of the present
report would be based on the best information currently available. The
pre-sent modeling study disregards the empirical results found by Tallmon et al. (2004), and I think the arguments for this disregarding are weak. The authors of the present study argue that the first sample analyzed by Tallmon et al. was small (n = 22). However, the uncertainty caused by small sample sizes is described by estimating confidence intervals (CI). The upper 95 % CI for Ne presented by Tallmon et al. were 73.2 or 117.2, if the time between the genetic samples was one or two generation times, respectively. Interpolating between these values and calculating in the same way as in Table 7 of Nilsson (2013) yields Ne = 87, Ne/N = 0.1243, and long-term MVP = 4023. Hence, the
MVP values estimated in the present study are not only far lower than those stemming from the estimates of Tallmon et al., but also much lower than the lowest MVP that can be calculated from the confidence intervals presented by Tallmon et al.
There are several biological reasons to suspect that the present study may underestimate the rate of heterozygosity loss, and therefore also may under-estimate the genetic MVP values:
• The proportion of males taking part in reproduction was here taken from data collected within core areas where sex ratio is approximately even, without accounting for the fact that a certain fraction of male bears reside in peripheral areas where few females are found.
• A male bear reproducing in one year probably has a higher chance of reproducing also the following year, and then over a series of years the proportion of males taking part in reproduction will be lower than if mating success in one year were random with regard to mating success in previous years.
• Among male bears within core areas, and also among those actually taking part in reproduction a certain year, the distribution of reproductive success may be more than randomly uneven, e.g. due to a correlation with body size (cf. Zedrosser et al. 2007).
For these reasons, I think my MVP estimates based on the available empirical measurement of heterozygosity change are still the MVPs that best reflect the information currently available.
In this statement, I assume that the genetical and statistical methodology applied by Tallmon et al. were correct. Neither the authors of the present study, nor Swenson & Kindberg (2013) who previously criticized my approach, have demonstrated that there would be anything erroneous in the genetical or statis-tical procedures used by Tallmon et al. The best way to resolve this issue would probably be to repeat the study of Tallmon et al. with a new and larger sample from the same subpopulation.
Prof. Jon Swenson (Norwegian University of
Life Sciences) & Dr Jonas Kindberg (Swedish
University of Agricultural Sciences):
We are pleased that the Swedish Environmental Protection Agency followed our advice and repeated the Minimum Viable Population (MVP) Analysis in a supplementary report by Puranen-Li et al. (2014), using the paternity rates published in Zedrosser et al. (2007, J. Anim. Ecol.) and the additional informa-tion we provided. We note that following our recommendainforma-tions changed the long- and short-term Minimum Viable Populations, as defined in the original report by Nilsson (2013), dramatically.
We do not have any specific comments on the report by Puranen-Li et al. (2014), other than we feel much more confident about using the best available empirical data and knowledge about the distribution of bears in Sweden to estimate MVPs, which Puranen-Li et al. (2014) did in their report.
Population size of Scandinavian
bears (Ursus arctos)
HELENA PURANEN-LI, CAROLINE SOLLEVI AND PER SJÖGREN-GULVE
ISSN 0282-7298
Swedish EPA SE-106 48 Stockholm. Visiting address: Stockholm – Valhallavägen 195, Östersund – Forskarens väg 5 hus Ub. Tel: +46 10-698 10 00,
fax: +46 10-698 10 99, e-mail: registrator@naturvardsverket.se Internet: www.naturvardsverket.se Orders Ordertel: +46 8-505 933 40, Swedish EPA SE-106 48 Stockholm. Visiting address: Stockholm - Valhallavägen 195, Östersund - Forskarens väg 5 hus Ub, .
Tel: +46 10 698 10 00, fax: +46 10 698 10 99, e-mail: registrator@swedishepa.se Internet: www.swedishepa.se Orders Ordertel: +46 8 505 933 40, The authors assume sole responsibility for the con-tents of this report, which
therefore cannot be cited as representing the views of the Swedish EPA.
Population size of Scandinavian
bears
(Ursus arctos)
Denna rapport är ett av de vetenskapliga underlagen inom Natur-vårdsverkets bedömning av referensnivån (FRP) för björn i artikel-17-rapporteringen 2013. Rapporten är skriven på engelska och redovisar kompletterande analyser av den skandinaviska populationen av björn för att bedöma minsta livskraftiga populationsstorlek i relation till två olika genetiska kriterier.
Analyserna gjordes med datorsimuleringar baserade på data från tidigare sårbarhetsanalyser (Rapport 6549) och med ny model-lering av björnhannars reproduktionsframgång, och undersökte hur snabbt den skandinaviska björnstammen förlorar genetisk variation vid olika populationsstorlekar och utan invandring från östligare björnbestånd.
This is one of the scientific reports underpinning the Swedish Environmental Protection Agency’s Article-17 reporting in 2013 of Favourable Reference Population for the brown bear in Sweden. It presents complementary population viability analyses of the Scandinavian population of brown bear (Ursus arctos) to quantify minimum viable population size (MVP) estimates in relation to two criteria for genetic viability.
The analyses were based on simulations without immigration, using demographic data from empirical studies of the Scandinavian population also used in a previous SEPA report (6549), but with updated scientific data on the reproductive success of male bears.
ISSN 0282-7298
HELENA PURANEN-LI, CAROLINE SOLLEVI & PER SJÖGREN-GULVE
Swedish EPA SE-106 48 Stockholm. Visiting address: Stockholm - Valhallavägen 195, Östersund - Forskarens väg 5 hus Ub, . The authors assume sole responsibility for the con-tents of this report, which
therefore cannot be cited as representing the views of the Swedish EPA.
Population size of Scandinavian
bears
(Ursus arctos)
Denna rapport är ett av de vetenskapliga underlagen inom Natur-vårdsverkets bedömning av referensnivån (FRP) för björn i artikel-17-rapporteringen 2013. Rapporten är skriven på engelska och redovisar kompletterande analyser av den skandinaviska populationen av björn för att bedöma minsta livskraftiga populationsstorlek i relation till två olika genetiska kriterier.
Analyserna gjordes med datorsimuleringar baserade på data från tidigare sårbarhetsanalyser (Rapport 6549) och med ny model-lering av björnhannars reproduktionsframgång, och undersökte hur snabbt den skandinaviska björnstammen förlorar genetisk variation vid olika populationsstorlekar och utan invandring från östligare björnbestånd.
This is one of the scientific reports underpinning the Swedish Environmental Protection Agency’s Article-17 reporting in 2013 of Favourable Reference Population for the brown bear in Sweden. It presents complementary population viability analyses of the Scandinavian population of brown bear (Ursus arctos) to quantify minimum viable population size (MVP) estimates in relation to two criteria for genetic viability.
The analyses were based on simulations without immigration, using demographic data from empirical studies of the Scandinavian population also used in a previous SEPA report (6549), but with updated scientific data on the reproductive success of male bears.
ISSN 0282-7298
HELENA PURANEN-LI, CAROLINE SOLLEVI
& PER SJÖGREN-GULVE
Complementary analyses
of genetic Minimum Viable
Population size of Scandinavian
bears (Ursus arctos)
HELENA PURANEN-LI, CAROLINE SOLLEVI AND PER SJÖGREN-GULVE
REPORT 6644 • DECEMBER 2014
Complementary analyses
of genetic Minimum Viable
Population size of Scandinavian
bears
(Ursus arctos)
REPORT 6644 • DECEMBER 2014 HELENA PURANEN-LI, CAROLINE SOLLEVI