Mailing address:
Visiting address:
Phone:
Box 1026
Gjuterigatan 5
036-10 10 00 (ex)
551 11 Jönköping
Concept Develop-
ment of Stroller
Wheel
SUBJECT: Mechanical Engineering AUTHOR: Erik Bengtsson
SUPERVISOR:Marcus Eriksson
Mailing address:
Visiting address:
Phone:
Box 1026
Gjuterigatan 5
036-10 10 00 (ex)
This thesis has been performed at the School of Engineering, Jönköping University, in the subject area Mechanical Engineering. The author answers for opinions, conclusions and results.
Examiner: Magnus Andersson
Supervisor: Marcus Eriksson
Scope: 15 credits
Abstract
Stroller wheels are the base to a stroller with good comfort, both for the kid and parent. The wheels in combination with the suspensions are the components that absorb shock and unevenness during strolling at different ground types. Thules multisport- and bike trailer, Thule Chariot CAB, can be used for four different activities. When the trailer is configurated for walk mode, the stroller is equipped with two front wheels in addition to the rear wheels. The front wheels are mounted on rigid forks that don’t have suspension. This makes that Thule Chariot CAB doesn’t adapt to the ground and bounces more during strolling at uneven surfaces. The purpose of the thesis work was to produce an evaluation method for how Thule Chariot CAB’s front wheel should be verified regarding increased comfort. Furthermore, a concept study should be performed, where the goal was to create a wheel that can achieve increased comfort.
By an experimental analysis, the evaluation method for improved comfort of Thule Chariot CAB was determined. The experimental analysis was executed in help of Irregular Surface Test and its association to real usage of a stroller. By comparing Thule Chariot CAB’s original rigid front fork with a front fork including suspension, the target point for what improved comfort could be determined. Thereafter, concepts were generated and verified by the evaluation method. A concept turned out to have better comfort than both other concepts and the original wheel. However, there was a lack of quality on other requirements.
Sammanfattning
Sammanfattning
Barnvagnshjul är grunden till en barnvagn med god komfort, både för barnet och föräldern. Hjulen i kombination med fjädring är de komponenter som absorberar stötar och ojämnheter vid körning på olika marktyper. Thules multisport- och cykelvagn, Thule Chariot CAB, kan användas för fyra olika aktiviteter. När vagnen är konfigurerad för promenadläge, är vagnen utrustad med två framhjul utöver bakhjulen. Framhjulen är monterade på stela framgafflar som inte har någon stötdämpning. Detta gör att Thule Chariot CAB inte anpassar sig till markens underlag och studsar mer vid ojämnheter.
Syftet med examensarbetet var att framställa en utvärderingsmetod för hur Thule Chariot CABs framhjul skall verifieras angående ökad komfort. Dessutom skulle en konceptstudie genomföras där målet var att skapa ett hjul som kan uppnå ökad komfort.
Studien resulterade i att en utvärderingsmetod, för vad som är förbättrad komfort av Thule Chariot CABs framhjul, bestämdes genom ett experiment. Experimentet utfördes med hjälp utav oregelbundet ytprov och dess association till verklig användning av en barnvagn. Genom att jämföra Thule Chariot CABs originella styva framgaffel med en framgaffel som har fjädring, kunde målet för vad som är förbättrad komfort bestämmas. Därefter genererades koncept och verifierades utav utvärderingsmetoden. Ett koncept visade sig ha bättre komfort än både andra koncept och originalhjulet. Dock fanns det bristande kvalitéer på andra krav.
Table of content
1
Introduction ...1
1.1
Background ... 1
1.2
Problem description ... 2
1.3
Purpose and aim ... 2
1.4
Delimitations ... 2
1.5
Outline ... 2
2
Theoretical framework ...4
2.1
Connection between aim and theory ... 4
2.2
EN-1888 Irregular surface test (IrregularST) ... 4
2.3
Connection between Thule's customers and IrregularST ... 5
2.4
Mathematical formulas ... 5
2.5
Product development ... 6
2.6
Materials ... 7
2.7
Feasibility Evaluations (Gut Feel) ... 8
3
Method ...9
3.1
Connection between aim and method ... 9
3.2
Methods for pilot study... 9
3.2.1
Experimental analysis ...9
3.2.2
Benchmarking ...9
3.2.2.1 Measurement tools, Accelerometer - Science Journal by Google ... 9
3.2.2.2 Use of accelerations ... 10
3.2.3
Quality Function Deployment – QFD ... 10
3.3
Methods for concept generation and elimination ... 12
3.3.1
Brainstorming ... 12
3.3.2
Idea sketching ... 13
3.3.3
Rapid prototyping ... 13
3.3.4
Pugh’s matrix ... 13
3.4
Validity and reliability ... 14
4
Implementation and result ... 15
4.1
Pilot study ... 15
4.1.1
Experimental analysis ... 15
Table of content
4.1.2.1 Benchmarking setup ... 17
4.1.2.2 Benchmarking result ... 18
4.1.3
Quality function deployment (QFD) ... 19
4.2
Concept generation and rapid prototyping ... 21
4.2.1
Brainstorming ... 21
4.2.2
Idea sketching ... 21
4.2.3
Concepts ... 21
4.2.3.1 Concept 1 ... 21 4.2.3.2 Concept 2 ... 21 4.2.3.3 Concept 3 ... 22 4.2.3.4 Concept 4 ... 224.2.4
Rapid prototyping ... 22
4.3
Concept elimination ... 23
4.3.1
Testing the wheels ... 23
4.3.1.1 Testing result ... 23
4.3.2
Pugh’s matrix ... 24
5
Analysis ... 26
5.1
Thesis question 1 ... 26
5.2
Thesis question 2 ... 26
6
Discussion and conclusions ... 27
6.1
Implications ... 27
6.2
Conclusions and recommendations ... 27
6.3
Future work ... 27
6.4
Reliability and Validity ... 27
6.5
Project reflections ... 28
References ... 29
Appendices ... 31
Appendix 1. Gantt ... 31
Appendix 2. Benchmarking ... 31
Appendix 3. Brainstorming ... 32
Appendix 4. Inspiration picture ... 33
Appendix 5. Idea sketching ... 33
Appendix 7. Benchmarking result ... 35
Appendix 8. Testing result ... 37
Introduction
1
Introduction
In this thesis work, a concept study of new stroller wheels has been performed at Thule Sweden AB in Hillerstorp. The aim of the study is to achieve a stroller wheel with more comfort than already existing wheels.
This bachelor thesis consists of 15 credits, and it is a part of the program Mechanical Engineering with the orientation of Product development and Design at Jönköpings Tekniska Högskola.
1.1 Background
Thule is a global company where some collection of brands is managed under the name Thule Group. The company’s passion is to facilitate for people with an active life. Thule stands for quality and safe products that make it easier for the transportation of important things in life. Stroller category has been developed in Canada since 2011and the focus has mostly been multisport and bike trailers. 2018 was one ongoing development of city stroller relocated from Canada to Thule’s Swedish development site in Hillerstorp. Since then, knowledge has been built up within the product category, and the development of new models is ongoing. The company’s stroller portfolio can be divided into two categories, city strollers and multisport- bike trailers. These different strollers can be seen in the figures below. [1]
Figure 1. City stroller, Thule Sleek. Reference [1], Thule
1.2 Problem description
Stroller wheels are the base to a stroller with good comfort, both for the kid and parent. The wheels in combination with the suspensions are the components that absorb shocks and unevenness during strolling on different grounds. Thule’s multisport trailer, Thule Chariot CAB, can be used for four different activities as cycling, cross country skiing, running and walking. In the configuration for stroller mode (see Figure 2) the stroller has two front wheels in addition to the rear wheels. They are mounted on rigid front forks that don’t have suspension in order to among other things minimize the manufacturing cost. This makes that Thule Chariot CAB doesn’t adapt to the ground and it bounces more during strolling at uneven surfaces, which seems to be uncomfortable.
To improve the multisport trailer’s comfort characteristics, ought either add front suspension or examine whether it is possible to improve the wheels. Thule wants to examine whether it is possible to improve the wheels. The wheels have to be soft enough so that it can remove the worst bumps. At the same time, the wheels can’t be too soft because it would impair the driving characteristics. Important is also that the wheels outer material, often made of rubber shall be durable over a long time. All of this puts higher demands on the design of the front wheels in order to state good comfort properties. Thule wants, therefore, to produce a new front wheel to Thule Chariot CAB that possibly could provide increased comfort.
To ensure that the concept-generated wheels improve the comfort of the trailer, it must be verified. In the current situation, there is no test method for how stroller wheels shall be evaluated regarding comfort improvement at Thule. However, other internal tests are carried out on strollers to verifies the strength, endurance and functions.
1.3 Purpose and aim
The purpose of this study is to produce a simple evaluation method for how the front wheel of Thule Chariot CAB should be tested and evaluated. Further shall a concept study be performed, where the goal is to achieve a front wheel that contributes to increased comfort.
- How shall Thule Chariot CAB’s front wheel regarding comfort improvement be evaluated?
- Which concept of a new front wheel can improve comfort?
1.4 Delimitations
The work will only be performed at Thule’s product development site in Hillerstorp, where all material and test equipment will be available. Subjective data in the form of interviews and experiment execution from people at Thule that test and evaluate the comfort will not occur due to their lack of time. Instead, objective data in the form of tests where values are collected will be performed, since I can do most of the work by myself. When collecting data, a non-calibrated measuring tool in the form of a smartphone will be used, and the evaluation will only be based on z-directions measurements.
Further, it is only concept development of non-pneumatic wheels of the size 7.8 inches that will be considered in the concept study. Because the outer rubber material of the wheel is highly durable, it should remain untouched. The concept generation will, therefore, be mainly focused on the design of the wheel regarding hub, spokes and rim. The study does not take potential patent into account which should be avoided. Also, this study will not contain the last three steps in product development process phases, which are configuration and detail design,
prototypes and adapt for manufacturing.
1.5 Outline
In this chapter, the reader has got an understanding of the thesis work. Thule as a company has been introduced, and a background to the problem has been presented. After the background, the purpose and aim were defined, followed by the project’s delimitations.
Introduction
The report proceeds with a theoretical framework where relevant theories that have been used during this study are presented and explained. Methods used for this thesis work that is based on the theories will be presented under the method chapter. Further, in the implementation and result chapter, the approach and outcome of the used methods will be presented.
The report ends with an analysis of the results that answers the thesis questions and is followed by a discussion and conclusion.
2
Theoretical framework
2.1 Connection between aim and theory
To do relevant conclusions about how to test and evaluate the wheel, this study will refer to three theories. Theory 2.2, EN-1888 Irregular surface test, is a European test standard for strength- and durability test of strollers. Theory 2.3 will describe the connection between the use of a stroller and the European standard test, Irregular surface test. Finally, theory 2.4 will present mathematical formulas used to analyze data.
The thesis concept study has been done in help of theory 2.5, product development, by following its different phases. Therefore, it can be good for the reader to get an understanding of what the different phases mean. Further, different material contacted in this study is described under theory 2.6. When it comes to making decisions that have been done in the thesis, a first feeling is often the gut feel, and more of that is described in theory 2.7.
2.2 EN-1888 Irregular surface test (IrregularST)
According to safety standards for strollers, Irregular surface test (IrregularST) must be run. The stroller should be mounted on a treadmill. The treadmill has two different obstacles mounted to it, and they are defined according to the test’s standards (see Figure 3). The speed should be 5±0.1 km/hand the stroller must pass over the obstacle’s configuration (see Figure 4) 72 000 times. The purpose of IrregularST is to expose the stroller for lifetime use. By doing these types of test, the stroller doesn’t need to be used for a lifetime by the owner to see if it last and not breaks. [2, pp. 58-59]
Requirements for passing the test:
- There should be no breakage or damage to the stroller that would impair safety. - Locking mechanism and accessories devices should still be functional as expected. - Connections such as car seat, pram body and seat units shall not become loosened,
disconnected, or damaged during or after testing.
Figure 3. Obstacles for IrregularST. Reference [3], Heida international
Theoretical framework
2.3 Connection between Thule's customers and IrregularST
Thule’s strollers are tested according to Thule’s internal test requirement and EN-1888 test standards. These tests are suggested procedures for testing durability, safety, strength and more, where IrregularST is a part of them. An earlier study has been conducted at Thule to investigate the connection between a typical Thule user and Thule’s internal test standards as well as EN-1888 standards. The test that was compared in the study was the European standard test IrregularST and Thule’s own two different outdoor test tracks. The purpose of the study was to see if the current EN-1888 test standard, IrregularST and Thule’s two test tracks reflect the use of Thule’s customers. [4]
The study consists of a customer survey where a typical Thule user exposes the stroller for a walk as they would use it for. These different terrain types were mapped and compared to Thule’s own two test tracks to see if those were comparable. The stroller was then tested and compared with IrregularST. The researcher used accelerometers to collect data from different tests. To use accelerometers, loads that occur during strolling over obstacles can be measured. These loads can be described as acceleration, or movement, in different directions. [4]
The result of the study shows that there were some similarities between IrregularST, a typical Thule user and Thule’s own two different outdoor test tracks, but no conclusions were drawn. Instead, the author describes both the similarities and difference between the tests. The researcher means that IrregularST only corresponds to ground types like small gravel, forest ground and curbstones. During Thule’s two outdoor tracks, there are stairs that contribute to higher acceleration than IrregularST can match. [4]
2.4 Mathematical formulas
This theory will present mathematical equations that form a basis for how the measurement tool is used.
Equation 1 - Work-Energy Equation, Potential energy:
U´1-2 is the total work done by all external forces (except gravitation and springs) that acting
on a particle during that the particle moves from point A to point B. The equation below describes that the total of work, U´1-2, equals the corresponding change in kinetic energy plus the change in potential energy. The advantage of using this formula is that the work can be decided by focusing attention to the particles end-point.
𝑈′1−2= ∆𝑇 + ∆𝑉
[5, pp. 174]
Equation 2 - Kinetic Energy:
Kinetic energy, T, is the total of work needed to move a particle from a state of rest to a velocity
v. Regardless of the direction of the velocity v, kinetic energy is always positive.
𝑇 =1 2𝑚𝑣
2
[5, pp. 158]
Equation 3 – Gravitational Potential Energy:
Gravitational potential energy is the energy a particle has because of its position in a gravitational field. The gravitational’s attraction is constant (9,81m/s^2). The gravitational potential energy Vg of a particle is defined as the work mgh has done against the gravitational field to elevate the particle a height h above a reference plane.
𝑉𝑔= 𝑚𝑔ℎ
Equation 5 – Velocity and acceleration:
The final velocity equals acceleration times time.
𝑎 =𝑑𝑣 𝑑𝑡 𝑎∆𝑡 = 𝑣 [5, pp. 23]
2.5 Product development
The book “Produktutveckling – Effektiva metoder för konstruktion och design” presents the different phases of the product development phases. This is a process used both for the development of existing products as well as new products. The authors explain that there is an iterative process where the different phases can be implemented many times. Depending on which type of product development project that is done, the number of process steps may vary. [6, pp. 115]
Figure 5. Illustration over the different phases. Reference [6]
Pilot study
In a pilot study, the problem is analyzed, and the background material is collected. It will be the basis for new product development. Important is that the pilot study observes different competencies to clarify the problem and minimize the risk of unnecessary constructions- and testing work. [6, pp. 115]
Product specification
The goal with product specification is to do a specification of WHAT to do, which is a result of what the design process should lead to. This is done of the information that is collected in earlier phases and become a starting point for the searching of a design solution. The specification shall also be used as a reference when evaluating the concepts and the final product solution. The product specification can be updated and developed during the design process, wherever the knowledge of the product being developed increases. A completed product specification shall contain all criteria that have been given explicitly and implicitly from the previous phases in the assignment. Even criteria that have been developed during clarification of the task, as well as those that have been taken during design decisions, must also be included. The criteria can be divided into two groups, those that relate to the expected function of the product and those that permitted product solutions. [6, pp. 117]
Strategy Market analysis
Pilot study Product
specification
Concept generation Product concept
Evaluation/ concept selection
Layout Detailed construction Prototype
Prototype
Theoretical framework
Concept generationThe authors explain how the word “concept” is defined. They explain that a product concept is a first approach to solving a design problem. A concept should include a preliminary product layout, cost estimation, description of technical solutions, properties about the product specification, and compilation of completed estimate calculations. The authors argue that this is not enough to create a functional prototype that they consider to be a first manufactured product. In that case, the concept must be further developed. The authors write that there are different ways to generate concept, but that the most common methods are creative methods, (including brainstorming most common), and systematic methods.
[6, pp. 119-120]
Concept elimination
In the phase of evaluation, each concept alternative should be analyzed to determine its value/ quality in relation to the requirements formulated in the product specification. The authors explain that the phase is based on evaluating/ weighting the concept you have and then choose the solution/ concept that has the highest value/ quality to then continue work with. The authors also explain that the backside with concept evaluation is that the value/ quality of the concept is influenced by different properties, as well as the properties have different significance. Also, the stakeholders value the properties differently, and that certain properties are considered qualitatively, while others are assessed quantitatively. In this phase, support methods can be very helpful. In many cases, the evaluation can be simpler by making simpler calculations or testing of “simple” prototypes. [6, pp. 120-122]
Configuration and detail design
The concept solution chosen in the previous phase must be further developed into a product that meets the requirements stated in the product specification. During this phase, a draft in the form of a prototype must be developed which can be tested, verified according to function and use. The phase includes detailing the product, which includes selecting standard components, dimensioning, describing the layout of the product, designing new details and selecting materials. [6, pp. 122]
Prototypes
The author writes that there are different prototypes for many different purposes and that it is most common today with virtual prototyping, which is computer-based modeling and simulation. The purpose of virtual prototyping is to be able to see the detail from different angles before physically building up a component. In addition to computer-based modeling and simulations, one makes physical models to be able to ensure functionalism and quality through completed tests. [6, pp. 124]
Adapt for manufacturing
In this phase, the product must be designed so that it can be manufactured and assembled with suitable manufacturing methods. [6, pp. 125]
2.6 Materials
This theory will present facts about materials that has been used in the thesis work.
EPDM - Ethylene-Propylene-Diene-Monomer rubber
EPDM is a copolymer of ethylene, propylene and diene. The rubber is a synthetic material that is used mainly outdoors for details such as building lists and car parts. The material has good properties in contact with high temperatures. [7] The hardness of the material is measured in hardness [shore] (force needed to deform the material). [8]
EVA – Ethylene-Vinyl acetate
EVA is a copolymer of ethylene and vinyl acetate. The plastic is harmless as long as no hazardous additives are added. EVA is a flexible and bendable plastic, almost as rubber. A clean and harmless EVA is mainly used for flexible/ soft hoses (vacuum cleaners) and electrical installations. Plastic sandals, as well as yoga mats, can also be manufactured by EVA because of its elastic properties. [9]
PA – Polyamides
Polyamides are thermoplastics that has very good wear-, mechanical- and fatigue properties. There are many different types of polyamides, but most common are PA6 and PA66. The choice of right polyamide depends on the desired performance and cost limitations. Also, the polyamides can also be reinforced with fiberglass, which further increases the stiffness of the material. This means that polyamides can now replace many metals. [10]
PA6 + 30% GF:
This polyamide has high strength and stiffness properties at high temperatures. This plastic also has good impact strength at low temperatures. The material also has an excellent surface appearance, which makes it suitable for exterior plastic in various design situations. The reinforced glass fiber makes the plastic stiffer. PA6 is the best performance/ cost ratio, of all polyamide materials. [10]
PA12:
PA12 is the first-class polyamide if demand for endurance is requested. The material has very long-lasting performance even in contact with high temperatures, pressure chemicals, etc. The plastic can be used for noise and vibration damping. Polyamide 12 has good processability and is a versatile 3D-print material. [10]
2.7 Feasibility Evaluations (Gut Feel)
“Gut feel” is based on earlier experience stored as design knowledge. When a concept is generated, usually the designer immediately gets three reactions:
1. It is not possible to implement it, it will never work 2. It might work if some adjustment is done to it 3. It is worth considering doing it
These judgments are based on the “gut feel.” The reliability deepens on how much design experience the engineer has. “Gut feel” is a simple and fast way to eliminate early ideas in a concept generation. [11, pp. 235]
Method
3
Method
3.1 Connection between aim and method
The used methods are adapted to follow the described theory 2.5 Product development. The methods can be divided into two parts, an information-gathering part, and a concept-creation/ evaluation part. From the information-gathering part, methods like experimental analysis and
Benchmarking are presented because these are the basis for how Thule Chariot CAB’s front
wheel should be evaluated. Quality function deployment, QFD, were used in order to weigh the specification requirements that were set on the product. Further, all concepts were evaluated by Pugh’s matrix.
3.2 Methods for pilot study
3.2.1
Experimental analysis
This method is used to see whether something is happening or lacking in any situations. By looking and document the sequence of events, requirements can be obtained. The method may need some test- equipment, measurement instrument, photographing or video- technics that can register what is happening and makes it possible to review afterward. The advantage with the method is that quick or complicated registration of event in real-time can be observed afterward by some of the test- equipment. One disadvantage can be to gain a test situation that doesn’t explain the events you want to study. For example, this method is used when studying manikins when crash testing cars. [12, pp. 149]
3.2.2
Benchmarking
Benchmarking is a method where already existing- or competitor products are described that fulfills the same need as the project’s product is going to do. The method can be applied in a different stage of the product development phases, and the goal is to understand a design problem. The purpose of doing benchmarking is to create a learning of what already exists, and also it reveals opportunities to improve on what already exists. In benchmarking for new development, advantageously each competing product needs to be compared with customer’s requirements. If any competing product achieves all the requirement, it could be a good inspiration for the development project. Thus, various patent must be kept in mind.
If the development is a redesigning of an already existing product, the current product could be a benchmark, reference point. If some features helped to meet an important requirement, the features shouldn’t be changed. Benchmarking is done in order to avoid needless work in the future. [11, pp. 158-160]
3.2.2.1
Measurement tools, Accelerometer - Science Journal by Google
Objects tend to keep moving if they are moving. This phenomenon is called inertia. Newton expresses this formally by his first law: “An object continues in its state of motion or rest unless acted on by an unbalanced force” [12]. Acceleration is when this unbalanced force does cause an object to move, the object will accelerate. The objects speed will therefore change, either by speeding up, slowing down, or changing direction. Acceleration is measured in meters per second squared (m/s^2). [13]
The phone has a device called accelerometer that measure these changes in motions (accelerations). Inside an accelerometer, small masses have the freedom to move. Changes in motions cause the masses to shift, and by measuring these inertial shifts, the accelerometer can detect changes in motions. [13]
The phone’s accelerometer measures the accelerations 16 times per second. By measuring accelerations, analyzing how an object is moving can be done. The phone measures the direction of the acceleration according to Figure 6 below (see Figure 6).
Figure 6. Directions of measurable accelerations. Reference, [13]
3.2.2.2
Use of accelerations
A derived equation from all equations in theory chapter 2.4 Mathematical formulas, which can describe the bounce height.
From Equation 1, both Equation 2 and Equation 3 can be inserted. Since there will be no external forces counted in this study, the work (U´1-2) is going to be zero.
0 =1 2𝑚𝑣
2+ 𝑚𝑔ℎ
Then, the gravitational potential energy can be moved to the other side and the masses, m, become eliminated. Division by g gave the result:
(−)ℎ =𝑣
2
2𝑔 Replace velocity (v) with acceleration (a) times time (t). Equation 6:
(−)ℎ =(𝑎∆𝑡)
2
2𝑔
From all of the equations above, a derived expression for the calculated height of a bounce has been performed. The negative sign before h doesn´t matter since the height can´t be negative anyway.
3.2.3
Quality Function Deployment – QFD
This method is used as a tool during the product development to compare two or more existing products, alternatively further development of established concepts. The purpose of the method is to translate the markets needs to technical requirements and specifications. Beyond that, the method also includes benchmarking. All information is collected and structured into a matrix that is divided into eight steps. Because of its appearance (see Figure 7), QFD is usually called “The house of quality”. The result of QFD:
- Systematical translation of customer needs to technical requirement specification - Benchmarking
- Target management to meet requirement specifications - Documentation and traceability
Method
Figure 7. Shows QFD matrix. Reference [11]
Step 1 – Who are the customer? (Who)
During step one, the goal is to identify the customers. For most design problems, there is more than one customer. Often the most important customer is the consumer, the people that buy and use the product. Sometimes though, the purchaser of the product isn’t the same as its user, but it is still a large customer base. For every product, it is important to consider all customers, the purchaser and the user as well as people in the organization since these people, designers, manufacturers, and sellers also can state requirements on the product. [11, pp. 151]
Step 2 – What do the customer want? (What)
In this step, the consumer’s needs are going to be set. Typically, the consumers want a product that works as it should, and over a long time. It should also be easy to maintain and looks good. Production customer wants the product to be easily manufactured and assembled instead. The key to this step in the QFD is to collecting information from customers as well as other stakeholders. Commonly used methods for this are surveys, observations and focus groups. Often, new products are redesigned of existing products, so many requirements can be found by observing people using these products and also using commonly manufacturing technics. [11, pp. 151-153]
Step 3 – Determine relative importance of the requirements (Who vs. What)
Next step is to evaluate the importance of each requirement, which is done by generating a weighting factor. Step 2 results in several requirements that are not possible to fulfill similarly. Therefore, this step is done to judge which requirement is the most important. It is done by all stakeholders that weighting the requirements individually. Traditionally, the weighting has been done by customers that rate the requirements from value 1 (unimportant) to 10 (important). Often this led to every requirement get scored 8-10 and everything become important. Better is if the customer has several points, for example, 100 points to distribute among the requirements. By that, the customer needs to do decision for what is important or not. [11, pp. 157-158]
How vs How
What Who vs. What vs. How
What
How
How much
Now vs. What
Step 4 – How satisfied are the customer now? (Now, Now vs. What)
The goal during this step is to determine how the customer perceives the competitor’s ability to meet each requirement. [11, pp. 158] Our product, as well as competitor’s products, should be compared requirement by requirement by the customer’s perspective. [12, pp. 84]
Step 5 – How will the customer’s requirements be met? (How)
During step 5, the goal is to create engineering specifications from the customer’s requirements. These engineering specifications consist of parameters that can be measured and have target values. For example, a customer’s requirement can be easy to attach, which is not clear enough since it can be interpreted differently between users. In this case, “easy” can be changed to a measurable parameter; for example, the number of steps to attach it shouldn’t exceed 3. [11, pp. 160-165]
Step 6 – Relate customer’s requirement to engineering specifications (What vs. How)
In what vs. how, the strength of the relationship is measured between engineering specification and customer’s requirements. The relations are specified with numbers, 0 = no relation at all, 1 = weak relationships, 3 = medium relationship and 9 = strong relationship. Every customer’s requirement should have at least one engineering specification with a strong relationship. [11, pp. 166]
Step 7 – Set engineering specification targets and importance (How much)
During this step of the QFDs, all targets are set and determined how important it is to meet all of them. To do that, three steps can be followed:
1. Calculation of the importance of the specification – During product development, it is difficult to meet all targets during the intended time. If one target is more important than another, more effort has to be spent to achieve it.
2. Measure how well the competitor meets the specification – Values obtained by measure competitors forms the basis to establish the targets.
3. Develop specification targets – It is important to set targets early in product development. Better is if the targets have some tolerance, so it doesn’t eliminate new ideas. Some companies make concept development to refine their targets and make them firm later.
[11, pp. 166-169]
Step 8 – Identify relationships between engineering specifications (How vs. How)
In many cases, engineering specifications are independent of each other. This can lead to both positive and negative results. When working to meet one specification, at the same time, one other specification either fulfills or fails. This step in QFD makes the connection between engineering specification clear early in the development process to avoid unnecessary work later. [11, pp. 169-171]
3.3 Methods for concept generation and elimination
3.3.1
Brainstorming
Brainstorming is a method for idea creation, used in concept generation. The method works well in a group consisting of 3-6 persons. Better is if the persons have different interest and working orientation to get as many variations on the ideas as possible. The goal is to achieve as many ideas as possible. To get an efficient brainstorming, the time shouldn’t last longer than 60 minutes. In this method, evaluates idea quantity before idea quality. Criticism on any idea during the process is forbidden. The method, therefore, uses four basics rules.
- Criticism is prohibited (comments, as well as positive or negative isn’t allowed) - Many ideas are sought (large width of ideas gives better results)
- Think outside the box (crazy ideas are welcome) - Combine and complements the ideas
Method
3.3.2
Idea sketching
With the help of idea sketching, searching for solutions to the different requirements that are stated in the requirement specification. The idea sketching can be done at different levels and with different tools. Usually, the whole concept is sketched before start detail sketching. In use of pen and paper, 2D sketches can quick and easily explain the solution/ functions. In order to visualize the solution more clearly, a 3D tool in the form of computer software can be useful. The sketches are later discussed with users, designers, engineers and others in order to change something if it does not match or work. The goal is to find principle solutions for the entire design problem in a clear and simple way. [12, pp. 39]
3.3.3
Rapid prototyping
Rapid prototyping is more common in product development this day. Rapid prototyping or additive manufacturing is when the form is built layer by layer by a nozzle that for example jets out melt plastic. Another common word for rapid prototyping is 3D-printing. [12, pp.96-97]
3.3.4
Pugh
’s matrix
Pugh’s decision matrix is a method used to eliminate and compare alternative concepts. The purpose of the method is to score each concept in relation to one reference in their ability to meet the requirements. The reference is often well known, or it has the ability to state good performance. [6, pp. 184] Comparison of scoring gives information about which concept to continue working with. Pugh’s matrix can be divided into five steps (see Figure 8). [11, pp. 240]
Figure 8. Shows Pugh’s matrix. Reference [11]
Step 1 – Select the different concept to be compared (Alternatives)
In this row, all concepts have to be stated. Better is if they are equally presented. It means that all concepts have to be described in the same language, and if they are sketched, all others should be sketched too. [11, pp. 241]
Step 2 – Choose requirements for comparison (Requirements)
In the QFD that was described in the chapter 3.2.3 Quality Function Deployment – QFD, engineering specification was developed. These engineering specifications and targets will be used in this section. [11, pp. 241]
Step 3 – Develop relative importance weightings (Importance)
During Step 3 of the QFD, the relative importance of the requirement was developed. These weightings factors will be used in this section in Pugh’s matrix. [11, pp. 241]
Evaluation Alternatives
Requirements Importance
Step 4 – Evaluate alternative concepts (Evaluation)
In this step, a reference is first selected. The reference is usually already a product or probably a concept that will work. Then, the alternative concepts are judged by the rate of the requirements individually against the reference. Each concept will be scored for every requirement:
+1 if it is better than the reference 0, if it performs equally as the reference -1, if it is worse than the reference [11, pp. 241-242]
Step 5 – View the outcome and decide what to do next (Results)
From step 4, the alternative concepts will get a number of scores and in this section, the total weighting can be calculated. The total weighting is the sum of each score multiplied by the importance of weighting. Important is that this result must not be treated as absolute values, only a guideline for which direction the project will take. [11, pp. 242]
3.4 Validity and reliability
To ensure the quality of the content in any research, validity and reliability requires to be good. Validity means that measurements that are made intend the studied objective we want to measure, and reliability means that it is performed with accuracy. [14]
This study will not include data collected by users feeling of comfort, which seems to be invalid. However, all wheels are evaluated by good reliability since they are tested on IrregularST were all settings are the same. The concept study is going to be done in help of well- proven methods that have a connection to theory 2.5, which is going to be good for the study’s validity. Further, the concepts are going to be evaluated and verified by the evaluation method and Pugh’s matrix, which will strengthen the reliability.
Implementation and result
4
Implementation and result
4.1 Pilot study
A pilot study was executed to gather information about Thule Chariot CAB’s front wheel and how the wheel should be evaluated and compared to other wheels. To determine how the wheel would be evaluated, an experimental analysis was performed, where theory and test standards were included. Furthermore, a benchmarking was performed to map possible competitor wheels and measure those performances. At first, a Gantt-schedule was done to clarify and plan all individual parts in the project. The Gantt-schedule can be seen in (Appendix 1. Gantt).
4.1.1
Experimental analysis
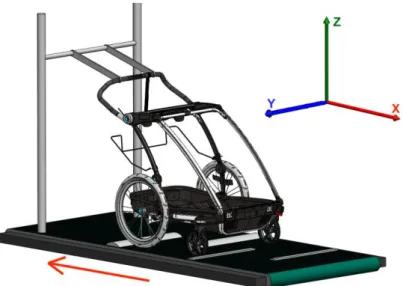
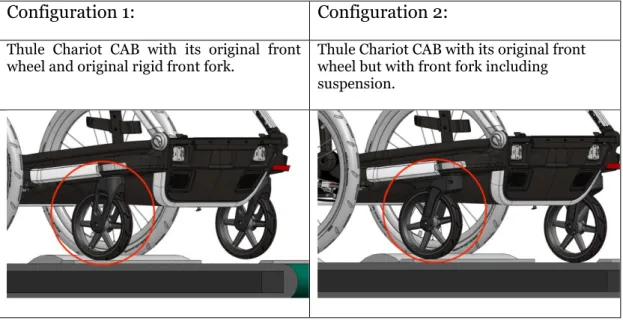
Before it was possible to improve the comfort of the front wheel, decisions were made on what possible increased comfort could be throughout an experimental analysis. Because Thule Chariot CAB doesn’t have front fork suspension, an experiment was performed to test the stroller with front suspension. By doing that, possible differences of the stroller’s behavior may occur and be inspected. To ensure that the stroller’s two different setups were tested properly and comparable, the stroller was driven on the IrregularST. Thereby, there was no difference at the test tracks obstacles, speed and how the stroller should have been driven by its user. The experiment can be divided into two different test configurations (see Table 1).
- Configuration 1: Thule Chariot CAB with its original front wheel and original rigid front fork.
- Configuration 2: Thule Chariot CAB with its original front wheel but with front fork including suspension.
The purpose of the experiment was to see how the two different configurations differ in performance and behave differently when it rolls over obstacles. By doing this experiment, estimation of what possible improved comfort is, could be determined.
The setup for both configuration:
- Thule Chariot CAB was loaded to its maximum weight capacity (44kg).
- The treadmill had a speed of 5±1km/h in the direction of the red arrow (see Figure 9). - Thule Chariot CAB was mounted freely in the handle, so it could move in all directions. - Thule Chariot CAB was driven six cycles over the configuration of obstacles.
Configuration 1:
Configuration 2:
Thule Chariot CAB with its original frontwheel and original rigid front fork. Thule Chariot CAB with its original front wheel but with front fork including suspension.
Table 1. Shows the difference between the two configurations. Reference, own
Result of experimental analysis:
The result of the experimental analysis was that configuration 1, with an original rigid fork, bounces more and faster, it gave the stroller more movement in all directions than configuration 2 did, and overall it looked jerkier. Configuration 2, with a front fork including suspension, was more flexible and adaptive to the treadmill and therefore considered as more comfortable. Significant differences between the two configurations:
- Configuration 2 has fewer bounces than configuration 1 - Configuration 2 bounces lower than configuration 1 - Configuration 2 bounces slower than configuration 1
The results of doing this experimental analysis were that the reference point for comfort was determined. The reference point for comfort is Thule Chariot CAB equipped with front fork including suspension.
4.1.2
Benchmarking
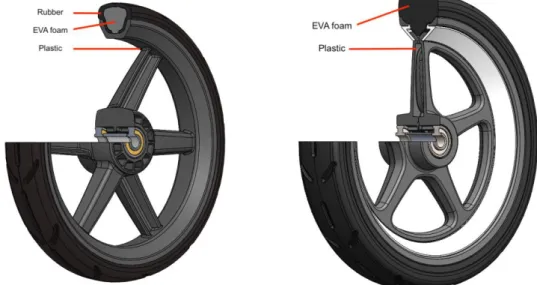
Thule Chariot CAB’s literal competitors are other multisport- and bike trailers. Because the focus of this project was to increase the comfort of the front wheel, other stroller wheels of nearly the same size were selected for benchmarking. The competitors’ front wheels found in Thule’s development site in Hillerstorp was used, because of the opportunity to test them. Information about market cost was found under the brand’s own online store. All of the wheels that were compared in this benchmarking are constructed in two different ways. In the section views (see Figure 10), the different constructions of front wheels can be seen. The main difference between these constructions is that there is one extra material of rubber that encloses and protects the inner core of soft material (EVA). The extra material of rubber (EPDM) also increases the strength and durability of the wheel. For material information, see chapter 2.6 Materials. Other comparisons can be seen in (Appendix 2. Benchmarking).
Implementation and result
Figure 10. Shows the two different construction of wheels.
4.1.2.1
Benchmarking setup
Before the benchmarking was performed, a test equipment was developed to make the benchmarking process both faster and easier. From the experimental analysis, the assessment was made that if the wheels bounce fewer times, and the movements in the z-direction decreases (see Figure 9), it will improve the comfort characteristics. Decisions to stabilize x- and y-direction to make the measurements in z-y-direction more clearly was made. The equipment was also made so that the measurement can be done near to the wheel and only regard the wheel. By doing that, no movement is disappearing throughout the body of the stroller itself, and the measurement on the wheel becomes more accurate. To collect data and measure how the different wheels behaved when pass obstacles, the wheels were measured with an accelerometer. By measure accelerations, the difference bounce height can be analyzed by the derived equation from chapter 3.2.2.2 Use of accelerations. Accelerations were measured by attaching a smartphone on top of the test equipment. By an app named google science journal (3.2.2.1 Measurement tools, Accelerometer - Science Journal by Google), the accelerations were recorded and saved so it could be analyzed afterward. Since the accelerations can be interpreted in different ways, all wheels were video recorded so conclusions could be drawn afterward. Ability to remove fork was created for fast switch between the whole system (fork and wheel), to speed up the process. Also, it was made so it could easily be loaded with different weight. The test equipment was built so that all concepts wheels can be evaluated in the same procedure later as this benchmark. The test equipment is presented below (see Figure 11).
The setup for all wheels:
- The test equipment was loaded over the wheel at corresponding weight as a maximum loaded Thule Chariot CAB’s front wheel.
- The treadmill had a speed of 5±1km/h.
- No settings were adjusted when switching wheels.
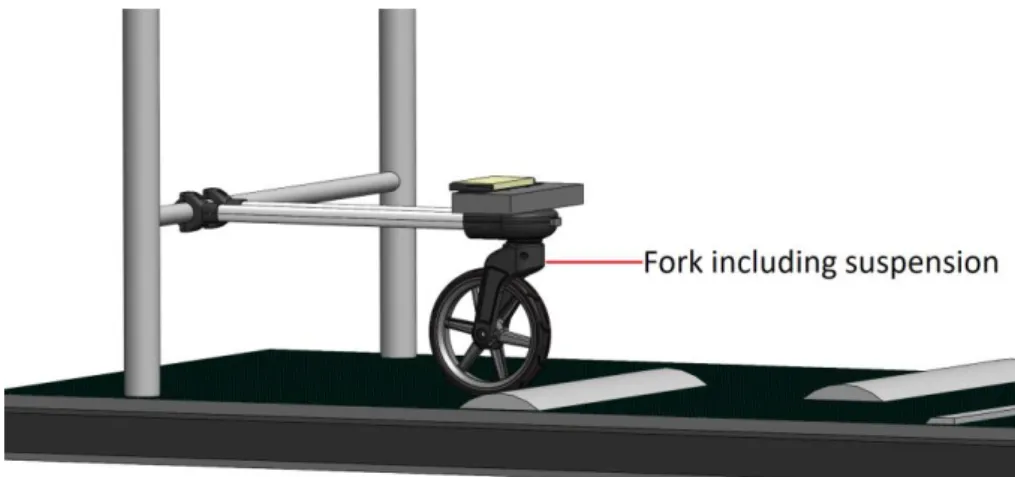
- All competitor wheels were driven six cycles over the configuration of obstacles since only the movement is interesting. (not the strength and durability in this study) - All competitor wheels were tested with Thule Chariot CAB’s original rigid front fork. Thule Chariot CAB’s original wheel but with front fork including suspension, represent configuration 2 (see Table 1), was tested to set the reference data since that configuration is explained as comfort in the experimental analysis, (4.1.1 Experimental analysis). This reference setup is presented below (see Figure 12).
Figure 12. Test equipment with reference configuration. Reference, own
4.1.2.2
Benchmarking result
The result of accelerations data are presented below (see Chart 1), (Chart 2) and (Table 2). Chart 1 show accelerations that occur when the wheels were run six cycles on the IrregularST. Table 2 shows the maximum peak of measured acceleration during these six cycles. For a clearer chart, see (Appendix 7. Benchmarking result).
Implementation and result
Table 2. Measured max acceleration. Reference, own
Chart 2 is a segment from chart 1. The chart shows how the wheels just have passed the fourth cycle and at the moment passing the fifth cycle. At the end of both cycles between times 19-20s and 23-24s, the chart shows us that the reference configuration, front fork including suspension, has stopped bouncing before other wheels. The chart also shows that the reference configuration has the lowest accelerations.
Chart 2. Shows appeared acceleration before, during and after one cycle. Reference, own
4.1.3
Quality function deployment (QFD)
Information gathered from the QFD used in this project was the specification requirements, weighting factors and benchmarking, which later could be used in Pugh’s decisions matrix. By completing Thule’s Technical Product Study, both weighting factors and specification requirement could be established. Thule’s matrix is equivalent to Step 3 (Who vs. What) section of the QFD, where the weighting factors are generated. However, Thule’s matrix isn’t working in the same way as David. G. Ullman’s method is described. Instead of just put a scored number to the requirement which is done in Ullman’s method, Thule’s matrix weighted each requirement against each other. The requirements are stated both in column and rows so a cross comparison where they one by one get weighted can be done. The requirements are weighted with score 1, if more important, 0 if less important and 0.5 if they are equally important. The result will then give all the requirements a weighting factor. The weighting factor is going to be between zero and the number of stated requirements minus one because the same requirement is weighted zero against itself. After a filled matrix, the most important requirement can be read.
Max acceleration [m/s^2] Front fork including suspension
54,13
Thule Chariot CAB
67,34
Bugaboo Fox64,52
Cybex Priam68,41
Thule Sleek72,36
Joolz GEO68,35
Thule’s technical product study was filled together with persons at Thule’s concept development department in Hillerstorp. Together the requirements were discussed and weighed against each other. In this project, the number of requirements was 14, so the maximum weight factor could, therefore, become 13. The requirement Comfortable
accelerations got scored 13 because it was the purpose of the thesis work. Other requirements
such as withstand rough handling, withstand change in temperature and withstand exposure
to UV light got scored 11. These types of requirements are not wished to be fulfilled, it must be
fulfilled because it’s a part of Thule’s test standard. The requirement Radial stability must be fulfilled too. Otherwise, the wheel will not work correctly. The wheel has to stand straight in the fork and not become twisted along the radial axis. Illustration of that requirement is presented below (see Figure 14). Remaining requirements and description to them can be found in Thule’s
technical product study (see Figure 13).
Figure 13. Quality function deployment, Thule’s technical product study. Reference, own
Figure 14. Illustration of requirement 13. Reference, own
Project No.
XXXXX
Project Document No.
XXXXX-TPST-XXX
Issued by Page
Part icipant s Dat e
Weighting factor
If demand is: Exampels of perspective of product:
More important = 1 • End customer life time
Equal important = 0,5 • End customer (pre purchase)
Not as important = 0 • End customer (post purchase)
• Thule • Retail 0 Demands (WHAT) C o m fo rt a b le a c c e le ra ti o n s E n v ir o n m e n ta l re s is ta n c e R e c y c la b ili ty , s u s ta in a b le W it h s ta n d r o u g h h a n d lin g W it h s ta n d c h a n g e i n t e m p e ra tu re W it h s ta d n d e x p o s u re t o U V l ig h t L o w w e ig h t R e p la c a b le M a n u fa c tu ri n g c o s t A s s e m b ly D e s ig n f re e d o m Q u a n ti ty o f c o m p o n e n ts R a d ia l s ta b ili ty O p o rt u n it y t o a d d r e fl e c to rs W e ig h ti n g f a c to r p o in ts Comments on demands.
1 Comfortable accelerations 1,0 1,0 1,0 1,0 1,0 1,0 1,0 1,0 1,0 1,0 1,0 1,0 1,0 13,0 Goal is to achive lower acceleration than original Thule Chariot CAB
2 Environmental resistance 0,0 1,0 0,0 0,0 0,0 1,0 1,0 0,5 0,5 1,0 1,0 0,0 1,0 7,0 Solid system, dust and water proof
3 Recyclability, sustainable 0,0 0,0 0,0 0,0 0,0 0,5 0,0 0,5 0,5 0,5 0,5 0,0 0,5 3,0 Thule Ecodesign rules
4 Withstand rough handling 0,0 1,0 1,0 0,5 0,5 1,0 1,0 1,0 1,0 1,0 1,0 1,0 1,0 11,0 Thule test standard - E.G "Wheel strenght test"
5 Withstand change in temperature 0,0 1,0 1,0 0,5 0,5 1,0 1,0 1,0 1,0 1,0 1,0 1,0 1,0 11,0 Thule test standard
6 Withstadnd exposure to UV light 0,0 1,0 1,0 0,5 0,5 1,0 1,0 1,0 1,0 1,0 1,0 1,0 1,0 11,0 Thule test standard
7 Low weight 0,0 0,0 0,5 0,0 0,0 0,0 0,5 0,5 0,5 0,0 0,0 0,0 0,0 2,0 Maximum weight 412g. CAB reference
8 Replacable 0,0 0,0 1,0 0,0 0,0 0,0 0,5 0,5 0,5 0,0 0,5 0,0 0,5 3,5 Can remove wheel from fork/ replaceable
9 Manufacturing cost 0,0 0,5 0,5 0,0 0,0 0,0 0,5 0,5 0,5 0,5 0,5 0,0 1,0 4,5 Rough cost estimation of materials/ processes tot less than Thule Chariot CAB
10 Assembly 0,0 0,5 0,5 0,0 0,0 0,0 0,5 0,5 0,5 0,5 0,5 0,0 1,0 4,5 Easy assembly of components
11 Design freedom 0,0 0,0 0,5 0,0 0,0 0,0 1,0 1,0 0,5 0,5 1,0 0,0 0,5 5,0 Opportunity for design team to change the look without compromising the performance
12 Quantity of components 0,0 0,0 0,5 0,0 0,0 0,0 1,0 0,5 0,5 0,5 0,0 0,0 0,0 3,0 CAB wheel = 3 parts, without bearings
13 Radial stability 0,0 1,0 1,0 0,0 0,0 0,0 1,0 1,0 1,0 1,0 1,0 1,0 1,0 9,0 Stability and non-uneven wheel
14 Oportunity to add reflectors 0,0 0,0 0,5 0,0 0,0 0,0 1,0 0,5 0,0 0,0 0,5 1,0 0,0 3,5 Thule sign, mountable reflex on rims
Prespekt ive of product : 70400
Bachelor thesis, concept department
Erik Bengtsson
Product Segment :
Technical product study
Thule Chariot CAB Stroller wheels Thule Sweden
Product t ype: Product no / name
Implementation and result
4.2 Concept generation and rapid prototyping
4.2.1
Brainstorming
Brainstorming was performed together with one senior concept designer at Thule in Hillerstorp. The person has great experience in work of strollers. To get the most out of the brainstorming session, the time was decided to remain a maximum of 45 minutes. The subject was described, and the brainstorming of the whole wheel was then started. The purpose of the brainstorming was to create a new wheel with the idea of flexible materials and wheel design. Ideas were drawn on the whiteboard (see Appendix 3. Brainstorming) individually by each one the first 15 minutes. After that 15 minutes, the ideas were described by the creator and discussed together. Further, the ideas were divided into four different groups to make it clear and describe in which area some improvements could be done. Then, the ideas were combined to see if it would lead to new improved solutions. Also, some ideas were improved by each other. Based on gut feel, three concepts were chosen to continue working with. These concepts were then built up in CAD-software, so it was possible to do rapid prototyping.
4.2.2
Idea sketching
At the beginning and during the concept generation, inspiration in the form of pictures online was collected (see Appendix 4. Inspiration picture
)
. By these inspiration pictures, idea sketching was performed to get an idea of how it could be possible to design it as a stroller wheel. Also, by sketching, it was easier to see how the wheel should be built in CAD-software afterward, to enable rapid prototyping. The idea sketching was great in this project because people at Thule with experience could easily understand the ideas and judge if it was worth or even possible to build it as prototypes or not.4.2.3
Concepts
4.2.3.1
Concept 1
Concept 1 is based on the same rim as the original Thule Chariot CAB. Instead of an inner foam of EVA as the original wheel (see Figure 10), this concept only gets its softness of the outer rubber. The outer rubber is meant to be both reliable over a long time and responsive to obstacles. When it hits a bump, the material will deform and flexible back again. The concept could be rather cheap, considering that the wheel only consists of one plastic part (rim) and one rubber part (tire).
Figure 15. Concept 1. Reference, own
4.2.3.2
Concept 2
The idea behind concept 2 was to remove the inner foam of EVA (see Figure 10), and still obtain the same or better performance. The idea is that the plastic wings under the rubber can be compressed and also at a different level depending on how much it is loaded or impacted. The idea of flexible bending was sketched during idea sketching, which can be found in (Appendix 5. Idea sketching). Together with a concept designer at Thule, the layout of the wing was discussed so it would possibly work. This concept could be made by three different parts, two plastic rim halves, and one rubber tire.
Figure 16. Concept 2. Reference, own
4.2.3.3
Concept 3
The principle behind concept 3 was to create some softness in the centrum that can minimize or eliminate the smallest shocks. This concept is based on the original Thule Chariot CAB wheel, and the impact of the design changes is minimum. The rubber part in the hub can be hidden behind the fork when it is mounted to it. The inner rubber part is designed so it will deform slightly when the wheel hits a bump and perhaps it will reduce the accelerations and therefore minimize the bumps.
Figure 17. Concept 3. Reference, own
4.2.3.4
Concept 4
This concept was inspired by a brand named Loopwheel (see Appendix 4. Inspiration picture). The idea is that the spokes of the wheel have the ability to deform and therefore possibly minimize the fast acceleration when it hits an obstacle.
Figure 18. Concept 4. Reference, own
4.2.4
Rapid prototyping
All of the concept’s plastic parts (all rims) that were presented in the chapter 4.2.3 Concepts above, were later rapid prototyped by a 3D-printer. The material used in the 3D-printer was PA12. In order to make 3D-prints, all concepts needed to be built in a CAD- software. Solidworks was used in this thesis because Thule uses that. All rubber tire in concepts 2-4 were taken from the original Thule Chariot Cab, modified and put on the concepts. The rubber material of the tire was EPDM with an unknown hardness. The rubber tire from Concept 1 and the rubber part in the hub in Concept 3 were water cut in Thule’s prototype department in
Implementation and result
Hillerstorp. This rubber material was EPDM, and the hardness was 80 shore. Concept 3 was also equipped with the original EVA core. For material information, see chapter 2.6 Materials.
4.3 Concept elimination
4.3.1
Testing the wheels
In order to complete Pugh’s matrix and answer the first requirement, testing all concepts were done in the same way as benchmarking is described in chapter 4.1.2.1 Benchmarking setup. By doing that, the concepts that performed better or worse than the original wheel, Thule Chariot CAB, could be established. To ensure that Thule Chariot CAB original wheel was comparable to the concept wheels, its plastic part was 3D-printed as well in order to have the same material for all wheels.
The setup for all wheels:
- The test equipment was loaded over the wheel at corresponding weight as a maximum loaded Thule Chariot CAB’s front wheel.
- The treadmill had a speed of 5±1km/h.
- No settings were adjusted when switching wheels.
- All competitor wheels were driven six cycles over the configuration of obstacles since only the movement is interesting. (not the strength and durability in this study) - All competitor’s wheels were tested with Thule Chariot CAB’s original rigid front fork.
4.3.1.1
Testing result
Both Concept 2 and Concept 4 didn’t even manage the test and broke after they hit the first obstacle (see Appendix 6. Damaged concept wheels). The test result of Concept 1 and Concept 3 is presented below (see Chart 3) and (Table 3). Chart 3 shows accelerations that occur when the wheels were run six cycles on the IrregularST. Table 3 shows that Concept 3 got lower measured maximal acceleration than the original Thule Chariot CAB. For a clearer chart 3, see (Appendix 8. Testing result).
Chart 3. Shows appeared accelerations during 6 cycles on IrregularST. Reference, own
Table 3. Measured max accelerations. Reference, own
Max acceleration [m/s^2] Front fork including suspension
50,12
Thule Chariot CAB
60,04
Concept 354,88
Concept 165,14
A photographic comparison was done between Concept 3 and the original Thule Chariot CAB wheel to ensure the difference bounce height. According to the derived “Equation 6” in the theory chapter 2.4 Mathematical formulas, higher acceleration means higher bounce. In the table below, the pictures show the different bounce height between the original wheel and the concept. Pictures of the original wheel, Thule Chariot CAB, are placed in the left column and has its turning point marked with black color. Pictures of Concept 3 are placed in the right column and has its turning point marked with yellow color. The pictures show that Concept 3 bounces lower than the original wheel, Thule Chariot CAB, according to the black and yellow lines.
Thule Chariot CAB Concept 3
The turning point after first the first bounce The turning point after first the first bounce
The turning point after the second bounce The turning point after the second bounce
The turning point after the third bounce The turning point after the third bounce
Table 4. Photographic comparison. Reference, own
4.3.2
Pugh’s matrix
All concept wheels were eliminated by Pugh’s matrix in order to get them narrowed down from four to only one. This matrix is produced by Thule as well as the QFD, and together they are included in Thule’s Technical product study, which is adapted to fit their development process. However, Pugh’s matrix works in the same way as David. G. Ullman’s method is described in chapter 3.3.4 Pugh’s matrix.
Implementation and result
All concepts were scored in relation to the reference in their ability to meet each requirement. The reference is the original Thule Chariot CAB wheel. Both requirements and the weighting factors were taken from QFD, which can be seen in chapter 4.1.3 Quality function deployment (QFD). Each concept was scored:
+(1), if the requirement is met better than the reference (0), if the requirement is met the same as the reference -(1), if the requirement is met worse than the reference
The result of Pugh’s matrix shows that none of the concepts met the requirements as good as the original Thule Chariot CAB wheel (see Figure 19). Concept 2 and Concept 4 even broke down when they were tested on the IrregularST and therefore didn’t fulfills either requirements 1 and 4. However, it turned out during the testing of the wheels in chapter 4.3.1 that Concept 3 met the first requirement (comfortable acceleration) better than any other concepts or the reference. Noticeable of this is that the first requirement also had the highest importance and was also the purpose of this study. Note that the result of Pugh’s matrix only is treated as a guideline for which concept to continue working with, as described in chapter 3.3.4 Pugh’s matrix.
Figure 19. Pugh’s matrix. Reference, own Technical product study
Project Product no / name
Issued by Product t ype:
Copy t o Dist ribut ed t o
Pugh Matrix
Rating Better than reference: 1
Equal as reference: 0 Worse than reference: -1
W e ig h ti n g f a c to r p o in ts
Thule Chariot CAB (Reference) Concept 1 Concept 2 Concept 3 Concept 4
1Comfortable accelerations 13 0 -1 -1 1 -1 2Environmental resistance 7 0 -1 -1 0 0 3Recyclability, sustainable 3 0 0 0 -1 1 4Withstand rough handling 11 0 0 -1 0 -1 5Withstand change in temperature 11 0 0 0 0 0 6Withstadnd exposure to UV light 11 0 0 0 0 0
7Low weight 2 0 -1 0 -1 1 8Replacable 3,5 0 0 0 0 0 9Manufacturing cost 4,5 0 -1 -1 -1 1 10 Assembly 4,5 0 1 -1 -1 1 11 Design freedom 5 0 -1 1 0 -1 12 Quantity of components 3 0 1 1 -1 1 13 Radial stability 9 0 0 0 -1 0
14 Oportunity to add reflectors 3,5 0 0 1 0 -1
0 -24 -28,5 -13 -15,5 Net value
Easy assembly of components
Opportunity for design team to change the look without compromising the performance CAB wheel = 6pts
Stability and non-uneven wheel Thule sign, mountable reflex on rims Thule test standard Thule test standard Maximum weight 412g. CAB reference Can remove wheel from fork/ replaceable
Rough cost estimation of materials/ processes tot less than Thule Chariot CAB
Comments on demands.
Goal is to achive lower acceleration than original Thule Chariot CAB Solid system, dust and water proof
Thule Ecodesign rules
Thule test standard - E.G "Wheel strenght test" Thule Chariot CAB
Stroller wheels Thule Sweden
70400
Bachelor thesis, concept department Erik Bengtsson
![Figure 1. City stroller, Thule Sleek. Reference [1], Thule](https://thumb-eu.123doks.com/thumbv2/5dokorg/4572916.117055/8.892.309.580.475.787/figure-city-stroller-thule-sleek-reference-thule.webp)
![Figure 3. Obstacles for IrregularST. Reference [3], Heida international](https://thumb-eu.123doks.com/thumbv2/5dokorg/4572916.117055/11.892.154.718.595.1116/figure-obstacles-irregularst-reference-heida-international.webp)
![Figure 5. Illustration over the different phases. Reference [6]](https://thumb-eu.123doks.com/thumbv2/5dokorg/4572916.117055/13.892.201.693.428.703/figure-illustration-different-phases-reference.webp)
![Figure 6. Directions of measurable accelerations. Reference, [13]](https://thumb-eu.123doks.com/thumbv2/5dokorg/4572916.117055/17.892.280.607.106.367/figure-directions-measurable-accelerations-reference.webp)
![Figure 7. Shows QFD matrix. Reference [11]](https://thumb-eu.123doks.com/thumbv2/5dokorg/4572916.117055/18.892.197.695.110.594/figure-shows-qfd-matrix-reference.webp)
![Figure 8. Shows Pugh’s matrix. Reference [11]](https://thumb-eu.123doks.com/thumbv2/5dokorg/4572916.117055/20.892.197.695.503.866/figure-shows-pugh-s-matrix-reference.webp)