EMISSIONS OF VOC FROM A LANDFILL AND
ITS PLUME DISPERSION MODELLING
Sérgio Machado Corrêa
Jorgina Rosete Teixeira
Eduardo Delfino Sodré
Carolina Vieira de Souza
State University of Rio de Janeiro, Brazil
sergiomc@uerj.br
ABSTRACT
The main purpose of this work is to evaluate the VOC emissions by a landfill, located at Niteroi city, Rio de Janeiro State, Brazil. Twenty six samples were collected at 500 mL min-1 using a battery-operated air pump during 10 minutes, at four days in May and December, 2009. It was used a cylindrical 30 liters PVC flux chamber, which open bottom side was inserted 5 cm inside the landfill soil, and the samples were collected using a valve at the upper closed side. It were used double bed activated charcoal cartridges and the chemical analyses were done by gas chromatography with a mass spectrometry detector. The results indicated that the landfill contain several chemical compounds, mainly VOC, causing injures to vegetation and human health at the vicinities. The results indicated an elevated value of 1,980 kg km-2 h-1, when compared with metropolitan areas of São Paulo (38 kg km-2 h-1) and Rio de Janeiro (26 kg km-2 h-1). It was used a Gaussian dispersion model implemented at ISCSC3 mathematical model to calculate the pollutants diffusion and transport, in order to estimate the concentrations at the neighborhood, using the emissions, meteorological, and topographical data. Maximum values of 525 μg m-3 for VOC were found near 500 m from the landfill. As
the landfill will be used for a long time it is necessary to evaluate the possibility to change the location of several schools, churches, residences, and hospitals to avoid the impacts.
KEYWORDS
Atmosphere; Modeling; Plumes; Volatile Organic Compounds.
1 INTRODUCTION
Among the forms of municipal solid waste final disposition in Brazil, 71% of the municipalities put them in the open way, 0.75% in flooded areas and 22% in controlled landfills [1]. These dumps are configured as potential pollution source, which negatively affects the human and environmental health quality in the regions under its influence. Among the problems arising from this inadequate provision, the main are the pollution of air, water, and soil, plus the proliferation of vectors.
The Niteroi city, not being an exception to the general situation found in Brazil, has its municipal solid waste disposed in a landfill in the area known as Morro do Céu This landfill arouses particular interest because it is located near a residential center in a zone watershed
the degradation of the waters of Guanabara Bay. For not having done any technical study prior to choosing that area and either mounted before its installation, a health infrastructure that was capable of preventing damage resulting from the disposal of tons of garbage daily, the region adjacent to the landfill has been suffering several environmental and health problems that have affected the welfare of the population residing there [2].
As a result, this study aimed to estimate the extent of the gaseous pollutants emitted from landfill Morro do Céu (ACMC) in the atmosphere and the main affected areas. To do this, it were quantified the emissions of volatile organic compounds (VOC) from the soil of the landfill and assessed the spread of the contamination plume. It was used a mathematical model to study the transport and diffusion of pollutants that provides the concentration in the vicinity as a function of time, from the meteorological data, topographic and emissions.
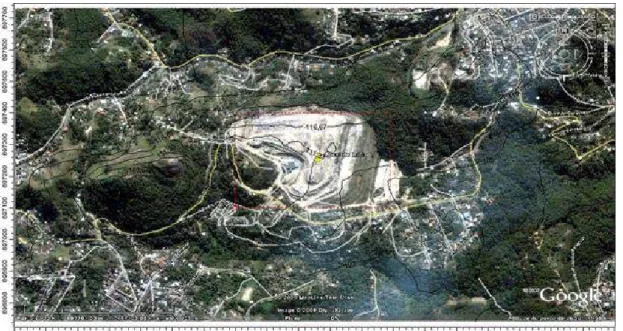
The Morro do Céu landfill is located 12 km from downtown Niterói city. The landfill began operations in 1983 and remained in use until the present date. The ACMC has an area of approximately 100 thousand m2. The site is located atop a hill within a valley. In relation to the original topography and geology, the region is located in an area of hills, with average heights ranging from 200 to 300 m, as part of the slope of the internal crystalline massif of Niterói city. The original vegetation cover was inserted into the field of Atlantic Forest [2, 3]. The vegetation cover, damaged by increased use of the landfill area, has a low vegetation type, characterized by being a well-developed secondary forest. This forest, according to a report of neighboring villagers, still has many wild animals such as monkeys, opossums and birds [2]. The odor given off from the mountains of garbage reaches communities far from the site [3]. The ACMC is administered by a public company. The process begins in the weighing of garbage trucks on the balance located on top of the storage area, which then descend to the square of operation, where there is the garbage dump. After the dumping of garbage, the hand collectors act quickly, while the track-type tractors push, spread and compact the garbage, which is then covered in an irregular manner, because the material is removed for the coverage of areas close by of takedowns and cuts on hillsides. The access routes for garbage trucks to the local garbage dump are unpaved, with the release of dust, the equipment used in operating activities of the landfill cause noise pollution, and odors occur at the site and its surroundings due to the decomposition of material from the organic matter. These factors cause increased environmental pollution. In Figure 1 it is possible to observe the location of the ACMC in Niterói city.
2 METODOLOGY
The dispersion model used was the Gaussian plume type, implemented in subroutine ISCST3, which is part of software ISC-AERMOD View. The ISC-AERMOD View is a graphical interface for Windows platform that facilitates the use of the model and was developed by the company Lakes Environment. The version used in this work was 5.4.0.
Meteorological data input were obtained by A605 Automatic Weather Station from National Institute of Meteorology (INMET), in Niterói, located at latitude -22.9063°S, -43.1333°W longitude and altitude 13 m. Values were obtained daily and hourly for temperature, relative humidity, dew point, atmospheric pressure, speed and wind direction and solar radiation for the period 01/01/2007 to 12/31/2007, a total of 8760 hours. Was pre-processed a meteorological file for the use with ISCST3, based on data collected by the meteorological tower over the period.
This survey around the site was obtained from the Google Earth tool which sets out the Cartesian coordinates and altitude of the region [4].
Assuming that the landfill is enclosure in a parallelogram, the Cartesian coordinates are • Northwest corner: 22°53´25,81”S and 43°04´29,63”W, altitude 146 m.
• Northeast corner: 22°53´24,16”S and 43°04´13,93”W, altitude 128 m. • Southwest corner: 22°53´35,71”S and 43°04´28,42”W, altitude 119 m. • Southeast corner: 22°53´33,29”S and 43°53´33,29”W, altitude 112 m.
The width (West to East) is 447 m and the height (North to South) 332 m.
The sampling method chosen to obtain emission data from the landfill was the flow chamber which, according to Cooper and Reinhart [5], is most appropriate as it provides greater accuracy, simplicity and flexibility than others. The authors add that, although slow, is a process that has been through validation tests in municipal solid waste landfill [5]. A flow chamber measures the flow rates from the soil or on surfaces such as landfill solid waste. The procedure involves placing a closed chamber on the surface of the emission source. A controlled, clean and dry air flow passes through the chamber continually and mixes with the emissions, going out through the exit of the chamber. Concentrations are measured in gas output and used to determine emission rates of the species.
In this study it was used a 30 L cylindrical PVC flow chamber (area 40 cm2), which mouth was upturned soil by 5 cm and samples collected by a valve positioned at the bottom. The size of the flow chamber is in agreement with the values quoted by Cooper and Reinhart [5]. The gas samples were collected by an air pump battery-operated from SKC model PCRX4 and a flow rate of 500 mL min-1 for a period of 10 min in 4 days and different times. It was used double bed activated charcoal cartridges (400/200mg) from SKC (224-09). The sampled cartridges were sealed, identified, protected from light by aluminum foil and transported to the laboratory. During the samplings were collected additional data such as temperature, pressure, wind direction and intensity, relative humidity and luminosity, using a portable meter Thal-300.
Twelve samplings were carried out preliminary varying the flow rate and time until reaching the shortest possible time to allow collect enough material for GC analysis. The shortest time was selected due to difficult access to the site, both because of poor health, as being an area of low personal security.
Four visits were made in the landfill area to obtain the emissions data, and made any withdrawals previously defined. It were conducted twenty-six collections of samples, three on 5/30/2009, three days on 05/31/2009, ten on 12/01/2009 and ten on 12/04/2009, one for each point sampling in a time interval of 10 min in order to verify the increase of concentration within the tank sampling over time. It is possible to see the increase in concentration inside the container, over time, taking to the emission rate in the format required by ISCST3 (mg s-1 m-2). The twenty six sampling sites were chosen depending on the availability and they were far apart at least 200 m. It was avoided to sample in areas where recently occurred garbage dump or where there were puddles of water.
The first six samples were analyzed in a 6890 Agilent gas chromatograph, using a HP-1 capillary column (30 m long, 0.32 mm thick and 0.25 micrometer film). In the mobile phase was used Helium at 1.2 mL min-1, injection volume of 1.0 μL splitless, injection at 200° C and flame ionization detector at 250° C. The column temperature was 40° C for 4 min, followed by heating ramp of 10° C min-1 to 220° C
The other twenty samples were analyzed in a Varian 450 gas chromatograph with a Varian 220 mass spectrometer, using a VF-5MS capillary column (30 m long, 0.25 mm thick and 0.25 mm in film). In the mobile phase was used to Helium 1.2 mL min-1, injection volume of 1.0 μL without division of the sample, injector at 200° C, transfer liner to 220oC and ion trap
at 150° C. The programming of column temperature was 40° C for 4 min, followed by heating ramp of 10 ° C min-1 to 220° C.
3 RESULTS AND DISCUSSION
With respect to meteorological data, it is possible to observe that there is a high incidence of weak winds in the region, hampering the dispersion of emissions from ACMC, worsening the problem of communities in their environment. One can observe a predominance of winds to the north, with 16% (1551 days) winds with speed module from 3.6 to 5.7 m s-1. From the data, comes to the conclusion that the average wind speeds at the site is 2 m s-1. According to the classification of Beaufort, with wind speed module 2 m s-1 light breezes are considered [6]. According to the classification of Pasquill [7], the classes of atmospheric stability that prevailed in this work were the class E (slightly stable) and class F (moderately stable), which suggests a low dispersion of plumes.
Regarding the topographical results, a mesh of 100 x 100 m was used for altitudes estimative, thus enabling to generate a file in x, y, z format, where x and y are the coordinates and z the altitude.
These results are shown in Figure 2, where one can observe the ACMC in the center of the Figure.
Figure 2. Contour lines generated from ISCST3 altitudes obtained.
The emission rate was calculated by the equation (1).
area time volume ion concentrat Emission . . = (1) The concentrations calculations were conducted against a standard mixture of alkanes (C6 to C12). It were obtained more than 25 peaks in the chromatogram, were identified 14 of these peaks, which reveals the presence of a large number of compounds belonging to different chemical functions. Because of the high vapor pressures and low solubility of many VOC are found in landfill gas, and may be cited alkanes, olefins, aromatics, chlorinated compounds, carcinogenic VOC (benzene and vinyl chloride), ethyl benzene, methane, toluene, trichloroethane, xylenes, and chlorinated aliphatic [5, 8]. It was observed that the average emission rates of the 26 sampling points gives a value of 0.55 mg m-2 s-1, with a deviation of 15.3%. Due to the low deviation, the heterogeneity of the medium in which the samples were collected and the difficulties of working in a place like this, it was decided not to conduct more samplings.
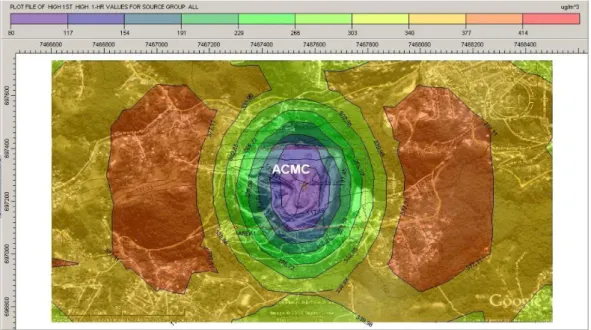
Considering the aspects of the plume dispersion, with the average emission rate, the topography and local meteorological data at the time considered, it was obtained the plume dispersion in the vicinity of the ACMC, and we can compare different emissions scenarios. The differences occur in the scenarios presented on the basis of meteorological data chosen. The scenarios chosen for 1h, 8h and 24h, were those who throughout the years studied showed the worst conditions of atmospheric dispersion for each period. The results calculated for 1h, 8h and 24h, there were peak concentrations, respectively, 414, 295 and 127 μg m-3,
and these areas of maximum concentration coincided with relevant regions in the aspect of public health. These results show that the longer the exposure, the lower the concentration. However, relating the time of deposition with distance, there is no dependency relationship between these parameters. The result of the plume dispersion for 1h shown in Figure 3 shows a large area with high concentration of pollutants.
Figure 3. Plume dispersion results for the 1h scenario for ACMC.
Samples taken over short periods (1 hour maximum) does not reflect the evolution of the VOC dispersion as a function of time [8]. Whereas the atmosphere of the city of Rio de Janeiro, a city neighboring Niteroi, displays average VOC values about 800 μg m-3 without
considering methane [9], basically as a result of mobile and stationary sources, the values found in this study represent a considerable contribution in the VOC levels in the region. Emission values of metropolitan area of São Paulo (38 kg km-2 h-1) [10] and metropolitan area of Rio de Janeiro (26 kg km-2 h-1) [11], are significantly lower than the value found in this work for ACMC (1.980 kg km-2 h-1).
It is also worth mentioning that this increase of VOC, combined with the large amount of NOx in the atmosphere of the Metropolitan Region of Rio de Janeiro, creates a favorable scenario for the ozone formation, which is being done by our research group at the time, employing the trajectory model and chemical mechanism OZIPR plus SAPRC.
The determination of emission rate from a source area is a subject still very scarce in the literature, where we can find many emission data from point sources, like a chimney, where it has well-established methodologies. A single study found was conducted at landfills in Florida [5] whose emission rates ranged between 1.1 and 1.7 mg m-2 s-1, approximately 2-3 times higher than the values obtained in this work. This difference can be attributed to several factors, for example, the type of garbage, the landfill project, its handling and meteorology. The discrepancy between the results of Florida and found by this research may have been influenced by cloud cover which was not considered in the study of meteorological data. In addition, the State of Rio de Janeiro, which is situated the ACMC, has very different weather conditions locally and temporally.
Around ACMC important places from the standpoint of public health are present in the surroundings, such as schools, hospitals and kindergartens, which were reached by air pollutants originating from the landfill. As a result, the study stands as a tool for risk analysis may propose to the government sectors, such as policies for granting permits for establishment in areas impacted by the plumes.
4 CONCLUSIONS
The ACMC shown to emits significant amounts of several chemicals, especially VOC, impacting the vegetation, damaging the health and quality of life of its surroundings. Whereas the ACMC will not be reset in a short time, kindergartens, schools and hospitals should be moved to an area where the impact of air pollutants is lower, contributing to improve quality of life of local people.
The results show to be necessary and desirable that greater attention be given to the political management of municipal solid waste in the State of Rio de Janeiro, including the location choice and monitoring of the areas during and after the period of operation.
This study allowed us to improve the methodology for flow measuring of pollutant emission from the soil of a landfill into the atmosphere and the mathematical model used proved to be a good tool to generate data that can be used to assess risk situations regarding public health.
REFERENCES
1. IBGE. Pesquisa Nacional de Saneamento Básico 2000. Disponível em: <http://www.ibge.gov.br/home/estatistica/populacao/condicaodevida/pnsb/lixo_coleta do/lixo_coletado109.shtm>. Acesso em: 14 mai. 2009.
2. SISINNO, C.L.S., MOREIRA, J. C., 1996. Avaliação da contaminação e poluição ambiental na área de influência do aterro controlado do Morro do Céu, Niterói, Brasil. Cad. Saúde Pública, Rio de Janeiro, nº 4, v. 12.
3. DIB-FERREIRA, D. R., NASCIMENTO, R. L. Do., 2001. História ambiental do
Morro do Céu: a atuação dos diversos atores sociais. Monografia (Especialização em
Educação para Gestão Ambiental) – Faculdade de Educação, Universidade do Estado do Rio de Janeiro, Rio de Janeiro, 52 f.
4. GOOGLE EARTH. Disponível em: <http://maps.google.com.br/maps?utm_campaign=pt_BR&utm_source=pt_BR-ha
latam-br-bk-gm&utm_medium=ha&utm_term=google%20maps>. Acesso em 03. Mai. 2009.
5. COOPER, C. D., REINHART, D. R; 1992. Landfill gas emisions. Florida: State University System of Florida.
6. MENDONÇA, F; DANNI-OLIVEIRA, I. M., 2007. Climatologia: noções básicas e climas do Brasil. São Paulo: Oficina de testos, 206p.
7. PASQUILL, F., 1961. The estimation of the dispersion of windborne material.
Meteorogical Magazine, v.90, p.33-49, apud BOÇON, F. T., 1998. Modelagem Matemática do escoamento e da dispersão de poluentes na microescala atmosférica.
Tese (Doutorado em Engenharia Mecânica)- Universidade Federal de Santa Catarina. 8. CHIRIAC, R., et al.; 2009. Study of the dispersion of VOCs emitted by a municipal
solid waste landfill. Atmospheric Environment 43, 1926–31.
9. CORRÊA, S.M. Qualidade do ar da cidade do Rio de Janeiro: sinergia entre
simulação e monitoramento. Rio de Janeiro, 2003. Ph.D. Thesis - Instituto de
Química. UFRJ, 2003.
10. GATTI, L. V., ORLANDO, J. P., ALVIM, D. S., YAMAZAKI, A., CORREA, S. M; 2010. Ozone precursors for the São Paulo metropolitan area. The Science of the Total
Environment 408, 1612-1620.
11. CORRÊA, S. M., ARBILLA, G., MARTINS, E. M., QUITERIO, S. L., GUIMARAES, C. S., GATTI, L. V., 2010. Five years of formaldehyde and acetaldehyde monitoring in the Rio de Janeiro downtown area. Atmospheric
![Figure 1. Location of Morro do Céu landfill in Niterói city [1, 2]](https://thumb-eu.123doks.com/thumbv2/5dokorg/3686536.45596/2.892.114.496.819.1075/figure-location-of-morro-céu-landfill-niterói-city.webp)