REMOVAL OF ORTHOPHOSPHATES IN
WATER BY MODIFIED CARBONATE
MATERIAL OF BIOLOGICAL ORIGIN
Marco Tadeu Gomes Vianna
Department of Sanitary and Environmental Engineering
Rio de Janeiro State University – Brazil
Marcia Marques
Department of Sanitary and Environmental Engineering
Rio de Janeiro State University -, Brazil
Department of Biology and Environmental Science, Faculty of Health and Life
Sciences, Linnaeus University,391 82 Kalmar, Sweden
ABSTRACT
The excessive release of phosphorus (P) by discharge of domestic and industrial effluents is directly associated with the eutrophication of water bodies. Therefore, an efficient removal of P from effluents is required. The method most commonly used for P removal from wastewater is chemical precipitation. However, this technique is relatively expensive and demands a proper disposal for the sludge. Therefore, the development of new materials with low cost but high P removal efficiency has been investigated. The introduction of exotic species in aquatic environments is considered a serious environmental problem in different parts of the world. Considering that, many of these species have high concentrations of carbonates in their exoskeleton composition, which is potentially useful in water treatment, particularly for P removal the use of such material as adsorbent has been tested. The present study aimed to investigate the capacity of the exoskeleton of exotic species in powder form to remove orthophosphates from water comparing the raw material (RCS), with physically modified (CSA) and chemically modified (CSC) material. To study the orthophosphates removal efficiency, a factorial design with central composite rotational design (CCRD) was applied. In order to optimize the P removal, the influence of the independent variables adsorbent/adsorbate ratio, pH and temperature was investigated with the kinetic control associate at each configuration obtained by CCRD. The P removal capacity of RCS varied from 125.0 mgP kg-1
to 1002.5 mgP kg-1; the removal capacity of CSA varied from 237.5 mgP kg-1 to 1540.0 mgP kg-1. The removal capacity of CSC varied from 5212.5 mgP kg-1 to 12672.5 mgP kg-1. Based on the preliminary results, the exoskeleton powder showed to be a potentially sustainable alternative as adsorbent material (mostly the chemically modified form CSC) useful in several applications, such as the treatment of urban and industrial wastewaters to prevent eutrophication of water bodies and population control of exotic species due to the commercial exploitation.
Keywords: sustainable material, phosphorus removal, factorial design, response surface
methodology.
1 INTRODUCTION
The release of nutrients and organic load, by discharge of domestic and industrial effluents is directly associated with the eutrophication of rivers and lakes [1]. This phenomenon is related to the excessive release of nitrogen (N) and phosphorus (P) in the water bodies, which are essential nutrients, however, phosphorus often becomes the potentially limiting nutrient in freshwaters [2]. When nutrients are available in excess, the eutrophication process is accelerated as long as other environmental conditions prevail (e.g. sunlight, temperature) and it promotes the growth of macro and micro-aquatic organisms that become the main cause of eutrophication of water bodies. Eutrophication can also significantly affect the water treatment by blocking filters or passing through them causing bad odour and taste in treated water[3] due the presence of large algal biomass. Human health is also directly affected by the eutrophication due to the consumption of shellfish contaminated with algal toxins or direct exposure to waterborne toxins [4]. To control eutrophication, US EPA has recommended that total P should not exceed 0.05 mg P per litre in a stream at a point where it enters a lake or a reservoir and should not exceed 0.1 mg/L in streams that do not discharge directly into lakes or reservoirs [5]. Thus, removal of phosphorus from both industrial and domestic effluents is and important strategy.
The total phosphorus is found in the following forms in the wastewaters: (i) inorganic polyphosphates and orthophosphates, originated mostly from detergents and other household products and; (ii) in organic form bound to organic compounds originated from physiological processes. The form in which the orthophosphate is found in the water depends on the pH, chemical species and includes PO43-, HPO42-, H2PO4-, H3PO4. In a typical wastewater, the
predominant form found is HPO42- [6]. Polyphosphates and organic P are converted to
orthophosphate by hydrolysis/or microbial mobilization. Orthophosphate is soluble and considered to be the only type of P that is directly assimilated by most plants, including algae [7]. The most commonly used method for phosphorus removal from water and wastewater is chemical precipitation. This method can reduce the concentration of phosphorus to values below 1 mg/L in sewage treatment plants. However, this technique is expensive, requires area for the deposit of chemicals and demands a solution for the precipitate obtained. In addition to the problems of handling the precipitate and subsequent neutralization of the effluent, the technique is unsuitable for the decontamination of effluents containing ions in low concentrations. Chemical precipitation can produce new pollutants in the effluent, having as the environmental consequence, the addition of chloride and sulphate in water bodies [1]. Therefore, alternative techniques for phosphorus removal have been developed and investigated such as, for example, biological treatment, electrodialysis, reverse osmosis, ultrafiltration and adsorption[8].
Among these techniques, adsorption process has been considered an effective treatment option because of convenience, ease of operation, simplicity of design and economic point of view. Among the advantages of the adsorption over other techniques, it is worth to mention the possibility of regenerating adsorbents and/or using low-cost materials from natural sources or agro-industrial wastes[1]. This technique, used as a tertiary treatment, can generate spent/used adsorbent that can be utilized further in other applications, especially for soil amendment such as correction of soil pH and as fertilizer in agriculture [9].
In recent years, several adsorbents have been tested for the removal of phosphate from water and wastewater. Materials such as apatite, bauxite, limestone, sand, shells, among others, that have been used as adsorbents for the removal of phosphorus [10]. Besides natural materials, metal oxides and hydroxides [11], layered double hydroxides (LDH) [12], and agro-industrial wastes have also been used for phosphate removal [13].
The introduction of exotic species in aquatic environments (biological invasions) has long been considered a serious environmental problem that can affect the integrity of natural communities,
influence mechanisms, which include competition, predation and parasitism, and alter food webs and nutrient cycles [14][15]. Some of these species have high concentrations of carbonates in their exoskeleton composition, potentially useful in water treatment, particularly for phosphorus removal.
This study aims to investigate the capacity of exoskeleton (in powder forms) of exotic species occurring in Brazilian seas for the removal of orthophosphates from water. The investigation compared the raw material (RCS), with physically modified (CSA) and chemically modified (CSC) material. The performance of these three adsorbents regarding phosphorus removal from water was compared, using design of experiments (DoE) principles for process optimization.
2 MATERIALS AND METHODS 2.1 Experimental Planning
Glassware: All glassware used in the experiments were washed with hydrochloric acid, and
rinsed with deionized water, as described by American Public Health Association (APHA) in 4500-P.C.2b method [16].
Preparing the material used as adsorbent: The exoskeleton of exotic species were washed
with deionized hot water, crushed and then, sieved with a 200-mesh sieve. After that, the washed exoskeleton was divided into 3 portions. The first portion was used with no further modification (RCS) as raw material in the tests for removing phosphorus from water. The second portion was kept in a muffle furnace at 500 °C for 2 h (CSA) before use. The third portion was taken from the CSA portion and additionally placed in a muffle furnace at 900 °C for 2 h (CSC).
Phosphorus analyses: The determination of total phosphorus in water followed the 4500-P E
Ascorbic Acid Method described by APHA in 4500-P E method [16]. For spectrophotometric analysis, a HACH DR2800 spectrophotometer Dr Lange was used, the minimum value of phosphorus detectable by this method is 10 g P/L. However, the precision of this technique is 228 g P/L for analytical procedures. The concentration of phosphorous adsorbed was determined by the difference between the initial concentration of the phosphate solution used and concentration of the solution after adsorption process according to Equation 1.
[𝑃𝑟𝑒𝑚𝑜𝑣𝑒𝑑] = [𝑃𝑖𝑛𝑖𝑡𝑖𝑎𝑙] − [𝑃𝑓𝑖𝑛𝑎𝑙] Eq. 1
The amount of phosphorous removed with relation the mass of adsorbent was determined according to Equation 2:
Premoved(mg)
adsmass(Kg) =
[Premoved]∙VPsolution
adsmass Eq. 2
Where [Premoved] is the concentration of phosphorus removed obtained in equation 1 (mg L-1);
VPsolution (L)is the volume of phosphorus solution utilised in the experiment; adsmass (Kg)is the
amount of exoskeleton powder utilised (RCS, CSA or CSC) in each batch. The result is expressed in mg of phosphorus removed by kilograms of adsorbent.
Phosphorus solution: The phosphorus solution was prepared by dissolving the primary
standard potassium dihydrogen phosphate (KH2PO4) in Milli-Q water. The stock solution was
prepared with 100 ppm of P, and diluted properly for use according to predicted by central composite rotational design (CCRD) levels (see used concentrations of P in Table 2). The stock solution was stored in amber glass at room temperature. All prepared solutions were analysed for phosphorus concentration to ensure that the actual concentration is the same that was prepared.
pH adjustment: Solutions of 0.1N sodium hydroxide and 0.1N hydrochloric acid and a
multiparameter 5 Star Orion (Method: 4500 H + B) were used [16]. This parameter was analysed before the start of experiments. However, in order to analyse any change in the pH during the P removal process, this parameter was analysed in the final of the experiment.
2.2 Experimental setup: Factorial design
Three independent variables were selected as the most important ones for the process of phosphorus removal by RSC, CSA and CSC powder: (i) pH; (ii) adsorbent/adsorbate ratio; (iii) temperature.
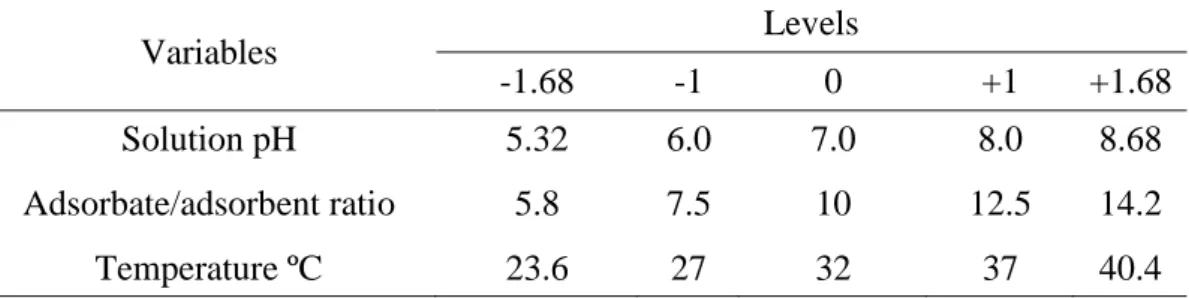
In order to assess the best interactions among these variables with the purpose of optimizing the phosphorus removal, a central composite rotational design - CCRD, based on the Response Surface Methodology [17] was used. The independent variables listed in Table 1 and their respective range and levels were chosen according to the literature [10].
Table 1. Coded levels (5) for independent variables (3) selected to be used in study for phosphorus removal from water by RSC, CSA and CSC powder as sorbent.
Variables Levels
-1.68 -1 0 +1 +1.68
Solution pH 5.32 6.0 7.0 8.0 8.68
Adsorbate/adsorbent ratio 5.8 7.5 10 12.5 14.2
Temperature ºC 23.6 27 32 37 40.4
The experiments were performed in batch mode as predicted by the experimental design. The study was conducted in 250 mL Erlenmeyer flasks containing 100 mL of water with dissolved phosphorous in amounts to fit to a mass of 400 mg adsorbent respecting the adsorbate/adsorbent ratio predicted by experimental design (Table 2).
Table 2. Relation between adsorbate/adsorbent ratio and Phosphorus concentration in solution, used in experiments.
Variables Levels
-1.68 -1 0 +1 +1.68
Adsorbate/adsorbent ratio
(mgads /gadsorbent) 5.8 7.5 10 12.5 14.2
The total number of runs was 18, including the central points, which were performed in random sequence. This type of planning allows obtaining mathematical models with linear and quadratic parameters (multiple regressions) of the studied variables. It calculated the main effects and interaction of variables, their respective coefficients for the mathematical model, as well as analysis of variance - ANOVA to determine the validity of the model. Associated to each run, a kinetic experiment was performed to evaluate which the optimum time for phosphorus removal. By combining the different levels presented in the experimental design, it was possible to examine the independent effects of each variable in response to removal, as well as the effect due to the interaction between them. From the presented results, a model can be created to explain how phosphorus removal occurs under the best conditions.
3 RESULTS AND DISCUSSION
3.1 Characteristics of RCS, CSA and CSC adsorbents
Carbonates are an important class of compounds that are included in Carbon Cycle, and occurs especially in the oceans. The Present-day production of CaCO3 in the world ocean is calculated
to be about 5 billion tons (bt) per year, of which about 3 bt accumulate in sediments; the other 40% is dissolved [18].
Nearly half of the carbonate sediment accumulates on a wide range of calcifying organisms, such as plants, crustaceans, cnidarian, porifera, molluscs, echinoderms, ascidians and shells, and consists largely of metastable aragonite [19][20]. Aragonite is the orthorhombic polymorph of CaCO3 [21].
The RCS and CSA powder have the same composition (predominantly CaCO3), the difference
between these materials concern about the purity of the calcium carbonate present in these samples. According Halikia et al. [22], the decomposition of Calcium Carbonates starts approximately to 600 ºC. However, CSA was submitted to the heat at 500ºC in furnace muffle. So that there was no change in its carbonate structure. On the other hand, occurs the volatilization of organic compounds that may exist, in way to liberate some adsorption sites (activation).
On the other hand, the part named as CSC, was submitted to the heat at 900ºC in furnace muffle, during 2 hours. In this case, one can observe the change in material colour and decrease of its mass. According Halilia et al. [22], CaCO3 decomposes to CaO and CO2 according to the
following equation: ) ( 2 ) ( ) ( 3s CaOs CO g CaCO Eq. 3
It is plausible that such a reaction has occurred for CSC formation. In weight term, was observed that 10.0010g of carbonate compound was transformed in 5.6091g of a white powder (probably calcium oxide). This number represents approximately 44% of mass loss through CO2
liberation. This phenomenon is stoichiometric compatible if compared with Eq. 3 (Table 3). Once a calcium carbonate/calcium oxide is added to a phosphate solution, a series of reactions that gradually removes the soluble phosphorus occurs. The main reactions involved are adsorption and precipitation of phosphate as calcium phosphate minerals [23][24][25][26][27].
Table 3. Comparison between the expected mass and the observed mass in experiment
Reactant Product
CaCO3(s) CaO(s) Mass loss (%) mass loss
Mass expected
(Theoretical) 10.00869g 5.60774g 4.40095g 43.97
Observed 10.0010g 5.6091g 4.3919g 43.91
2.3 Phosphorus removal studies
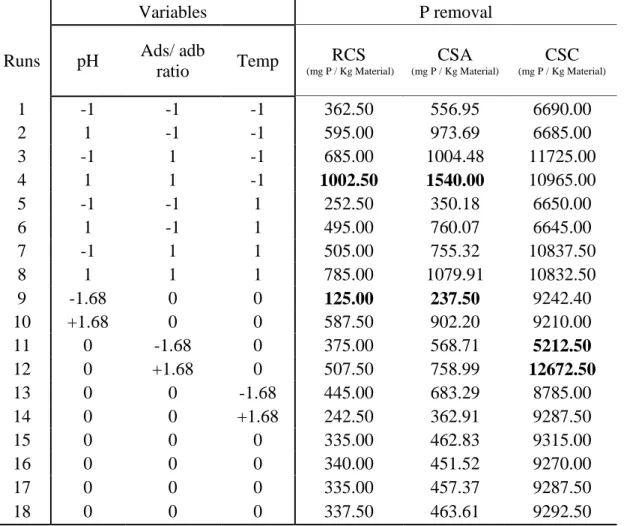
Table 4 shows the variables and levels applied to the CCRD to assess the P removal capacity of RCS, CSA and CSC.
Table 4. Variables and levels applied to CCRD for P removal from water by RCS, CSA and CSC and experimental data.
Variables P removal
Runs pH Ads/ adb
ratio Temp (mg P / Kg Material)RCS
CSA (mg P / Kg Material) CSC (mg P / Kg Material) 1 -1 -1 -1 362.50 556.95 6690.00 2 1 -1 -1 595.00 973.69 6685.00 3 -1 1 -1 685.00 1004.48 11725.00 4 1 1 -1 1002.50 1540.00 10965.00 5 -1 -1 1 252.50 350.18 6650.00 6 1 -1 1 495.00 760.07 6645.00 7 -1 1 1 505.00 755.32 10837.50 8 1 1 1 785.00 1079.91 10832.50 9 -1.68 0 0 125.00 237.50 9242.40 10 +1.68 0 0 587.50 902.20 9210.00 11 0 -1.68 0 375.00 568.71 5212.50 12 0 +1.68 0 507.50 758.99 12672.50 13 0 0 -1.68 445.00 683.29 8785.00 14 0 0 +1.68 242.50 362.91 9287.50 15 0 0 0 335.00 462.83 9315.00 16 0 0 0 340.00 451.52 9270.00 17 0 0 0 335.00 457.37 9287.50 18 0 0 0 337.50 463.61 9292.50
Table 4 shows the results obtained with different runs regarding P removal. The values highlighted in bold, represent the highest and lowest results obtained with the experimental setup. The best results were obtained with the run 4 when RCS and CSA was used as sorbent, and run 11 for CSC. To check the effects of independent variables, the P removal obtained with both adsorbents were analysed separately from the determination of the values of statistical significance.
2.3.1 RCS and CSA
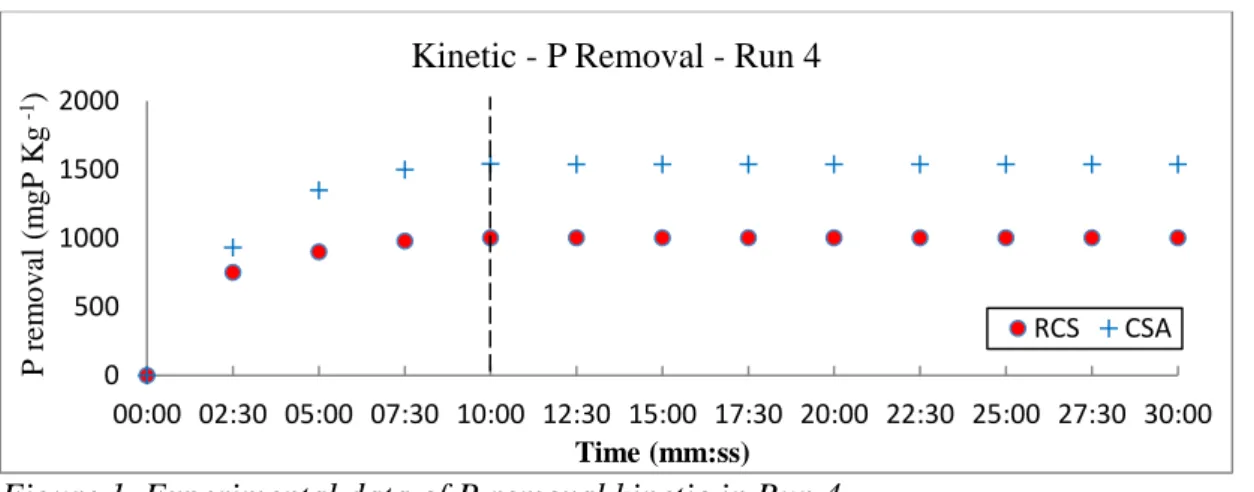
As shown in Table 4, the range of P removal using RCS varied from 125.0 mgP kg-1 to 1002.5 mgP Kg-1. For CSA this range varied from 237.5 mgP kg-1 to 1540.0 mgP kg-1. In both material
the maximum removal occurred in run 4 with pH 8.0, Adsorbate/adsorbent ratio of 12.5 (P concentration of 50 ppm) and temperature of 27ºC. In both runs the maximum removal was reached around 10 min (see Figure 1).
Figure 1. Experimental data of P removal kinetic in Run 4
Using the experimental results, the regression model equations relating the responses are developed and are given in eqs. (4) and (5) for RCS and CSA, respectively. Apart from the linear effect of the parameter for the P removal, the CCRD also gives an insight into the quadratic and interaction effect of the parameters.
The statistical tests applied were Fisher’s F-test and Student t-test. The student t-test was used to determine the significance of the regression coefficients of the parameters. The P-values were used as a tool to check the significance of each of the interactions among the variables, which in turn may indicate the patterns of the interactions among the variables [28].
Table 5. Regression Coefficients for P removal responses (10 minutes).
RCS CSA
Coeff. Std.Err. t(8) p Coeff. Std.Err. t(8) p
Mean/Interc. 326.7565 74.5787 4.3814 0.0023 444.616 105.1519 4.2283 0.0028 (1) pH (L) 135.5461 40.4433 3.3515 0.0100 205.458 57.0228 3.6031 0.0069 pH (Q) 50.8224 42.0669 1.2081 0.2614 101.089 59.3120 1.7043 0.1267 (2) Adb/ ads ratio(L) 109.5729 40.4433 2.7093 0.0266 150.864 57.0228 2.6457 0.0294 Adb/ ads ratio(Q) 80.9386 42.0669 1.9240 0.0905 134.393 59.3120 2.2659 0.0532 (3) Temp.(L) -69.455 40.4433 -1.7173 0.1242 -122.236 57.0228 -2.1436 0.0644 Temp.(Q) 46.3936 42.0669 1.1028 0.3021 84.525 59.3120 1.4251 0.1919 1L by 2L 15.3125 52.8184 0.2899 0.7792 4.185 74.4710 0.0562 0.9565 1L by 3L -3.4375 52.8184 -0.0650 0.9497 -27.222 74.4710 -0.3655 0.7241 2L by 3L -23.4375 52.8184 -0.4437 0.6689 -36.107 74.4710 -0.4848 0.6407 0 500 1000 1500 2000 00:00 02:30 05:00 07:30 10:00 12:30 15:00 17:30 20:00 22:30 25:00 27:30 30:00 P r em ov al ( m gP K g -1) Time (mm:ss)
Kinetic - P Removal - Run 4
It was observed that the coefficients for the linear effect of pH (p=0.010) and Adb/Ads ratio (p=0.0266) for RCS and pH (p=0.0069) and Adb/Ads ratio (p=0.0294) for CSA was statistically significant. The others parameters and your interactions do not demonstrated statistical significance for phosphorus removal.
The regression models for RCS and CSA are:
𝑅𝐶𝑆 = 326.7565 + 135.5461 𝑝𝐻 + 109.5729 𝐴𝑑𝑏/𝐴𝑑𝑠 𝑟𝑎𝑡𝑖𝑜 Eq.4
𝐶𝑆𝐴 = 444.616 + 205.458 𝑝𝐻 + 150.864 𝐴𝑑𝑏/𝐴𝑑𝑠 𝑟𝑎𝑡𝑖𝑜 Eq.5
The coefficient of determination R² quantifies the quality of the adjustment proposed by the model, ranging from 0 to 100% [17]. The coefficient of determination is given on the basis of the analysis of variance (ANOVA) model proposed as shown in Table 6. Another important aspect analysed by ANOVA is the F statistic value. A large value of F indicates that a variation in the response can be explained by the regression model equation. The associated P-value is used to judge whether F statistics is large enough to indicate statistical significance. A P-value lower than 0.05 indicates that the model is considered to be statistically significant.
According to the ANOVA, the F Statistics values for all regressions models obtained are high. Therefore, these models are valid.
Table 6. ANOVA of P removal for RCS and CSA
RCS CSA Sums of Squares df Mean Square F statistics p Sums of Squares df Mean Square F statistics p (1) pH (L) 250692.6 1 250692.6 10.56 0.005 575986 1 575986.2 9.60 0.0075 (2) Adb/ads ratio (L) 163822.4 1 163822.4 6.89 0.019 310554 1 310553.5 5.18 0.0385 Error 356170.1 15 23744.7 899727 15 59981.8 Total SS 770685.1 17 1786266 17
R2:76.8%; Ftab: 3.59; pvalue: 0.05 R2: 80.13%; Ftab: 3.59; pvalue: 0.05
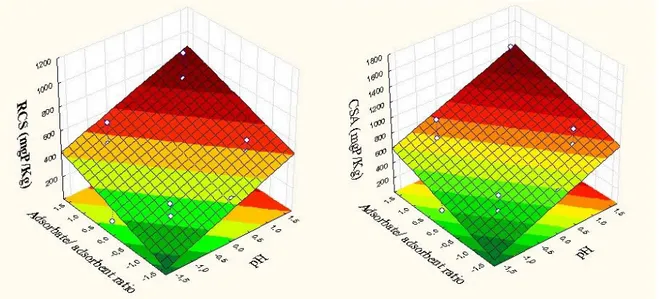
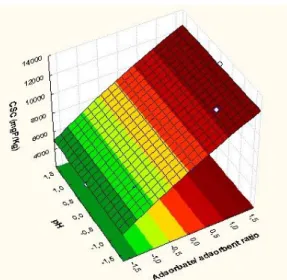
The 3D response surface are generally the graphical representation of the regression equation. This representation shows the relative effects of any two variables when the remaining variables are kept constant. Through analysis of response surfaces (Figure 2), it appears that the greater P removal occurs:
1) P removal increases with pH increasing for RCS and CSA;
2) P removal increases with high concentration of phosphorus (great Adb/Ads ratio) for RCS and CSA.
These results are consistent with the predicted by Karageorgiou et al. [9] which observed an increase in the phosphate adsorption as pH increased and the increasing P concentration. However, a general consensus has affirmed that phosphate can be either adsorbed by calcium carbonate at low concentration or precipitated at high concentration [25][26][27] although it is not always easy to distinguish between these two mechanisms [29]. A previous work [30] suggested that the initial uptake of phosphate onto calcium carbonate occurs via chemisorption, which is then followed by a slow transformation of amorphous calcium phosphate to crystalline apatite [29]. At high concentrations, the process starts with small amounts of phosphate adsorption, followed by the precipitation of Ca-compounds, such as dicalcium, octacalcium phosphate and hydroxyapatite [25][27].
2.3.2 CSC
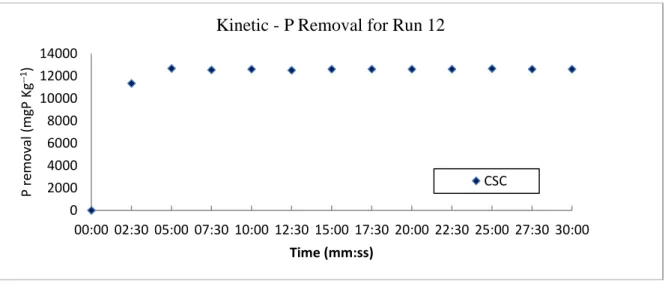
According Table 4, the results for P removal by CSC was around ten times greater than CSA. The range of P removal using CSC varied from 5212.5 mgP kg-1 to 12672.5 mgP kg-1. The
maximum removal occurred in run 12 with initial pH 7.0, Adsorbate/adsorbent ratio of 14.2 (P concentration of 56.8 ppm) and temperature of 32ºC. The maximum removal was reached around 5 minutes (Figure 3).
Figure 3. Experimental data of P removal - kinetic in Run 12 for CSC
According to Table 5, the Adb/Ads ratio for CSC was statistically significant. The other parameters and their interactions did not demonstrated statistical significance for phosphorus removal. To justify this condition, a chemical approach is needed.
0 2000 4000 6000 8000 10000 12000 14000 00:00 02:30 05:00 07:30 10:00 12:30 15:00 17:30 20:00 22:30 25:00 27:30 30:00 P re m o val (m gP Kg --1) Time (mm:ss)
Kinetic - P Removal for Run 12
Table 5. Regression Coefficients for P removal responses for CSC (5 minutes).
Coeff. Std. Err.-Coeff. t(8) p
Mean/Interc. 9300.037 120.806 76.983 9.04E-13
(1) pH (L) -60.800 65.512 -0.928 0.381
pH (Q) -61.204 68.142 -0.898 0.395
(2) Adb/ ads ratio (L) 2214.968 65.512 33.810 6.4E-10 Adb/ ads ratio (Q) -161.739 68.142 -2.374 0.044996
(3) Temperature (L) -18.747 65.512 -0.286 0.782
Temperature (Q) -128.522 68.142 -1.886 0.096
1L by 2L -94.375 85.558 -1.103 0.302
1L by 3L 94.375 85.558 1.103 0.302
2L by 3L -117.500 85.558 -1.373 0.207
It was observed that the coefficients for the linear and quadratic effects for Adb/Ads ratio (p=6.4E-10; p= 0,045)) for RCS. The others parameters and your interactions do not demonstrated statistical significance for phosphorus removal.
This fact was expected, if consider the CSC material made of Calcium Oxide, how that explained previously. For this case, precipitation processes are predominant with relation to adsorption process. The great amount of phosphorus removal contributes to this affirmative (Table 4). The Calcium Oxide is consider a basic oxide [31], because reacts with water producing a basis, in this case: Ca(OH)2 (see Eq. 6). According Manahan [32], Ca(OH)2 is the
chemical most commonly used for P removal (see Eq. 7), this chemical have advantages as low coast and easy regeneration. In the experimental conditions, the P removal efficiency was significantly high, however in real conditions this efficiency will decrease because of ion competition in precipitation processes.
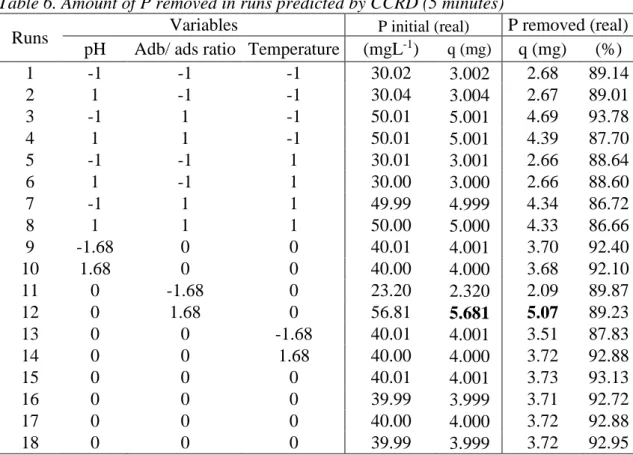
Table 6. Amount of P removed in runs predicted by CCRD (5 minutes)
Runs Variables P initial (real) P removed (real)
pH Adb/ ads ratio Temperature (mgL-1) q (mg) q (mg) (%)
1 -1 -1 -1 30.02 3.002 2.68 89.14 2 1 -1 -1 30.04 3.004 2.67 89.01 3 -1 1 -1 50.01 5.001 4.69 93.78 4 1 1 -1 50.01 5.001 4.39 87.70 5 -1 -1 1 30.01 3.001 2.66 88.64 6 1 -1 1 30.00 3.000 2.66 88.60 7 -1 1 1 49.99 4.999 4.34 86.72 8 1 1 1 50.00 5.000 4.33 86.66 9 -1.68 0 0 40.01 4.001 3.70 92.40 10 1.68 0 0 40.00 4.000 3.68 92.10 11 0 -1.68 0 23.20 2.320 2.09 89.87 12 0 1.68 0 56.81 5.681 5.07 89.23 13 0 0 -1.68 40.01 4.001 3.51 87.83 14 0 0 1.68 40.00 4.000 3.72 92.88 15 0 0 0 40.01 4.001 3.73 93.13 16 0 0 0 39.99 3.999 3.71 92.72 17 0 0 0 40.00 4.000 3.72 92.88 18 0 0 0 39.99 3.999 3.72 92.95
𝐶𝑎𝑂(𝑠)+ 𝐻2𝑂(𝑙) ↔ 𝐶𝑎(𝑂𝐻)2(𝑎𝑞) Eq. 6
5𝐶𝑎(𝑂𝐻)2(𝑎𝑞)+ 3𝐻𝑃𝑂4(𝑎𝑞)2− → 𝐶𝑎5𝑂𝐻(𝑃𝑂4)3(𝑠)+ 3𝐻2𝑂(𝑙)+ 6 𝑂𝐻− Eq. 7
The results presented in Table 6 shows that the P removal follow the initial amount of P, this result corroborates the results found on Table 5. Observing Eq. 7 can be concluded that the P removal follows a stoichiometric way, however in the conditions predicted by the CCRD, the amount of Calcium oxide as reactant is excessive, so the initial P amount can be consider the limiting reactant for this reaction (Pinitial < 132.561 mg). The pH was not relevant because in
all runs we found an increase of the pH around to 10.5. This fact can be explained by Eq. 7, where it can be observed OH-species as products.
The regression model that explain the P removal for CSC is:
𝐶𝑆𝐶 = 9300.037 + 2214.968 𝐴𝑑𝑏/𝐴𝑑𝑠 𝑟𝑎𝑡𝑖𝑜 − 161.739(𝐴𝑑𝑏/𝐴𝑑𝑠 𝑟𝑎𝑡𝑖𝑜)² Eq. 8
According to ANOVA, the FStatistics values and R2 for this regression model are high. Therefore,
this model is valid.
Table 6. ANOVA of P removal for CSC
CSC Sums of Squares df Mean Square F statistics p (1) Adb/ads ratio (L) 66942545 1 66942545 1003.513 0.000000 Adb/ads ratio (Q) 163822.4 1 163822.4 6.89 0.085421 Error 356170.1 15 23744.7 Total SS 770685.1 17 R2: 98.53% Ftab: 3.59; pvalue: 0.05
3 CONCLUSIONS
In this study, the potential of RCS, CSA, CSC for P removal from water was studied. The removal capacity by RCS varied from 125.0 mgP kg-1 to 1002.5 mgP kg-1; the removal capacity
by CSA varied from 237.5 mgP kg-1 to 1540.0 mgP kg-1; and the removal capacity by CSC varied from 5212.5 mgP kg-1 to 12672.5 mgP kg-1. If compared with previous studies by Limestone (682 mgP kg-1) [33] and Oyster Shell (833 mgP kg-1) [34] with no chemical treatment, RCS and CSA already presented better results. However, prepared adsorbents as Filtralite P® (2500 mgP kg-1) [35], Shellsand (9600 mgP kg-1) [35], LWA® (12000 mgP kg-1) [36] presents even better results. The CSC material, presented a highly capacity for P removal, on the same order of magnitude of the best sorbents, but their results were underestimated because of the low Adb/Ads ratio used in the experiment.
Based on the preliminary results, the exoskeleton powder can be considered a sustainable alternative as adsorbent material, from the environmental, economic and technical viewpoints with potential to be used in several applications. The RCS and CSA might be regenerated, or used for soil amendment, as agricultural fertilizer or pH adjustment of acidic soils. In other words, this might be a sustainable option for agriculture use and eutrophication prevention. The product of the precipitation reaction of CSC might be used as a fertilizer, bioceramic coatings, bone fillers and buildings. Furthermore, the use of this material can help the population to control of exotic species giving to them an economic value.
However, detailed studies are required to optimize the P removal, followed by physical, chemical and toxicological characterization of the RCS, CSA and CSC. Based on further knowledge raised in future research, it will be possible to suggest mechanisms for phosphorus removal and to explain what processes influence the P removal according to the experimental conditions.
4 ACKNOWLEDGEMENTS
The authors acknowledge the financial support given by FAPERJ.
REFERENCES
[1] H.S. Altundogan, F. Tumen, Removal of phosphates from aqueous solutions by using bauxite. I: Effect of pH on the adsorption of various phosphates, J. Chem. Technol. Biotechnol. 77 (2002) 77–85. doi:10.1002/jctb.525.
[2] S. Wang, H.M. Ang, M.O. Tadé, Novel applications of red mud as coagulant, adsorbent and catalyst for environmentally benign processes., Chemosphere. 72 (2008) 1621–35. doi:10.1016/j.chemosphere.2008.05.013.
[3] R.W. Collingwood, A survey of eutrophication in Britain and its effects on water supplies, Stevenage Laboratory, Water Research Centre, 1977.
[4] S.B. Bricker, B. Longstaff, W. Dennison, A. Jones, K. Boicourt, C. Wicks, et al., Effects of nutrient enrichment in the nation’s estuaries: a decade of change, Harmful Algae. 8 (2008) 21–32.
[5] D.K. Mueller, D.R. Helsel, M.A. Kidd, Nutrients in the nation’s waters-Too much of a good thing?, US Government Printing Office, 1996.
[6] F.S.B. Mota, M. Von Sperling, Nutrientes de esgoto sanitário: utilização e remoção, Rio Janeiro ABES. (2009).
[7] P. Loganathan, S. Vigneswaran, J. Kandasamy, N.S. Bolan, Removal and recovery of phosphate from water using sorption, Crit. Rev. Environ. Sci. Technol. 44 (2014) 847– 907.
[8] L. Alvares, M. Lúcia, C. Pinto, D.D.E. Química, E.D.E. De Lorena, U.D.S. Paulo, Adsorção de Íons Fosfato em Óxido de Nióbio Hidratado, Quim. Nov. 32 (2009) 1206– 1211.
[9] K. Karageorgiou, M. Paschalis, G.N. Anastassakis, Removal of phosphate species from solution by adsorption onto calcite used as natural adsorbent., J. Hazard. Mater. 139 (2007) 447–52. doi:10.1016/j.jhazmat.2006.02.038.
[10] C. Vohla, M. Kõiv, H.J. Bavor, F. Chazarenc, Ü. Mander, Filter materials for phosphorus removal from wastewater in treatment wetlands—A review, Ecol. Eng. 37 (2011) 70– 89. doi:10.1016/j.ecoleng.2009.08.003.
[11] A. Genz, A. Kornmüller, M. Jekel, Advanced phosphorus removal from membrane filtrates by adsorption on activated aluminium oxide and granulated ferric hydroxide, Water Res. 38 (2004) 3523–3530.
[12] J. Das, B.S. Patra, N. Baliarsingh, K.M. Parida, Adsorption of phosphate by layered double hydroxides in aqueous solutions, Appl. Clay Sci. 32 (2006) 252–260.
[13] A. Bhatnagar, M. Sillanpää, Utilization of agro-industrial and municipal waste materials as potential adsorbents for water treatment—a review, Chem. Eng. J. 157 (2010) 277– 296.
[14] A. Occhipinti-Ambrogi, D. Savini, Biological invasions as a component of global change in stressed marine ecosystems, Mar. Pollut. Bull. 46 (2003) 542–551.
[15] N. Bax, A. Williamson, M. Aguero, E. Gonzalez, W. Geeves, Marine invasive alien species: a threat to global biodiversity, Mar. Policy. 27 (2003) 313–323.
[16] A.D. Eaton, L.S. Clesceri, A.E. Greenberg, Standard methods for the examination of water and wastewater American Public Health Association, Washington, DC. (2005) 20001–23710.
[17] M.I. Rodrigues, A.F. Iemma, Planejamento de Experimentos e Otimização de Processos Casa do Pão Editora, (2009).
[18] J.D. Milliman, Production and accumulation of calcium carbonate in the ocean: Budget of a nonsteady state, Global Biogeochem. Cycles. 7 (1993) 927–957. doi:10.1029/93GB02524.
[19] J.D. Milliman, Production and accumulation of calcium carbonate in the ocean: Budget of a nonsteady state, Global Biogeochem. Cycles. 7 (1993) 927–957. doi:10.1029/93GB02524.
[20] A.L. Cohen, T.A. McConnaughey, Geochemical perspectives on coral mineralization, Rev. Mineral. Geochemistry. 54 (2003) 151–187.
[21] D. Allemand, É. Tambutté, D. Zoccola, S. Tambutté, Coral Calcification, Cells to Reefs, in: Z. Dubinsky, N. Stambler (Eds.), Coral Reefs An Ecosyst. Transit. SE - 9, Springer Netherlands, 2011: pp. 119–150. doi:10.1007/978-94-007-0114-4_9.
[22] I. Halikia, L. Zoumpoulakis, E. Christodoulou, D. Prattis, Kinetic study of the thermal decomposition of calcium carbonate by isothermal methods of analysis, Eur. J. Miner. Process. Environ. Prot. 1 (2001) 89–102.
[23] C. V Cole, S.R. Olsen, C.O. Scott, The Nature of Phosphate Sorption by Calcium
Carbonate, (1953) 352–356.
https://www.soils.org/publications/sssaj/abstracts/17/4/352.
[24] A. Delgado, A. Madrid, S. Kassem, L. Andreu, M. del Carmen del Campillo, Phosphorus fertilizer recovery from calcareous soils amended with humic and fulvic acids, Plant Soil. 245 (2002) 277–286. doi:10.1023/A:1020445710584.
[25] J.S. Freeman, D.L. Rowell, The Adsorption and Precipitation of Phosphate onto Calcite, J. Soil Sci. 32 (1981) 75–84. doi:10.1111/j.1365-2389.1981.tb01687.x.
[26] Y. Liu, X. Sheng, Y. Dong, Y. Ma, Removal of high-concentration phosphate by calcite: Effect of sulfate and pH, Desalination. 289 (2012) 66–71. doi:10.1016/j.desal.2012.01.011.
[27] S. Yagi, K. Fukushi, Removal of phosphate from solution by adsorption and precipitation of calcium phosphate onto monohydrocalcite., J. Colloid Interface Sci. 384 (2012) 128– 36. doi:10.1016/j.jcis.2012.06.063.
[28] Z. Zaroual, H. Chaair, a. H. Essadki, K. El Ass, M. Azzi, Optimizing the removal of trivalent chromium by electrocoagulation using experimental design, Chem. Eng. J. 148 (2009) 488–495. doi:10.1016/j.cej.2008.09.040.
[29] I. Perassi, L. Borgnino, Adsorption and surface precipitation of phosphate onto CaCO3– montmorillonite: effect of pH, ionic strength and competition with humic acid, Geoderma. 232-234 (2014) 600–608. doi:10.1016/j.geoderma.2014.06.017.
[30] C. V Cole, S.R. Olsen, C.O. Scott, The Nature of Phosphate Sorption by Calcium Carbonate, (1953) 352–356.
[31] H. Flood, T. Förland, The acidic and basic properties of oxides, Acta Chem. Scand. 1 (1947) 592–604.
[33] A. Drizo, C. a. Frost, J. Grace, K. a. Smith, Physico-chemical screening of phosphate-removing substrates for use in constructed wetland systems, Water Res. 33 (1999) 3595– 3602. doi:10.1016/S0043-1354(99)00082-2.
[34] D.C. Seo, J.S. Cho, H.J. Lee, J.S. Heo, Phosphorous retention capacity of filter media for estimating the longevity of constructed wetland., Water Res. 39 (2005) 2445–7. doi:10.1016/j.watres.2005.04.032.
[35] K. Ádám, T. Krogstad, L. Vråle, A.K. Søvik, P.D. Jenssen, Phosphorus retention in the filter materials shellsand and Filtralite P®—Batch and column experiment with synthetic P solution and secondary wastewater, Ecol. Eng. 29 (2007) 200–208. doi:10.1016/j.ecoleng.2006.09.021.
[36] P.D. Jenssen, T. Krogstad, Design of constructed wetlands using phosphorus sorbing lightweight aggregate(LWA), Adv. Ecol. Sci. 11 (2003) 259–272.