Lund University
Lund Institute of Technology
Department of Industrial Management and Logistics Division of Production Management
Formulating a Proactive Entry Strategy for
Ericsson in India
New Site Leasing Industry
Author: Emily Ericsson Supervisors: Carl-Johan Asplund
Department of Production Management
Rajul Kumar
Preface
A number of people have contributed to this thesis in different ways. I would therefore like to start by saying some thank yous. I would like to start by thanking Håkan Ericsson and Vishal Awal, without your help this thesis would never have happened. I would also like to thank the whole of Mr Vishal’s family who made me feel welcome in their home and made my stay in India an amazing experience. Another person who deserves a special thank you is Ola Millnert who has given me valuable feedback and great support throughout the thesis.
I also would like to send a thank you to Miss Shaivya Shrivastava who helped me in a number of ways making my stay at Ericsson India possible. Thank you Jan Lund, Vibhas Sharma, and Richa Singh who have all helped me by answering questions and giving me access to valuable information.
Finally, I would like to thank my two supervisors; Carl-Johan Asplund, my academic supervisor at Lund’s Institute of Technology, and Rajul Kumar, my supervisor at Ericsson India Pvt Ltd, for your advise and assistance throughout the thesis.
Emily Ericsson Lund, October 2006
Abstract
Ericsson India is looking into the possibility to enter a new business in the country. The business is a “telecom site leasing” service which would be included in Ericsson’s service portfolio. Services are an increasingly important part of the company’s total revenues. Demand for so called turn-key services, meaning full implementation and control over a customer’s network, is an example of a service which is increasing in developing countries like India. Ericsson finds it therefore natural to grow within the service segment in these markets. The idea to expand the service offerings with an entrance to the so called tower industry emerged from identified new opportunities and a noted market demand. This thesis has investigated how Ericsson should enter this “site leasing” business in India.
The business is expected to take off with or without Ericsson, as regulators and the Indian government see many benefits to the economy with the concept. Since the aim of the concept is to achieve as many tenants as possible per tower, infrastructure costs are expected to decrease per operator. The cost reductions is the main reason for the belief that the service is expected to improve coverage in rural areas, which at the present have a network penetration of less than 2%. The service is also supported by the government and the regulators because it is estimated to improve countryside and city esthetics and network capacity in urban areas, which are facing problems with insufficient space. It was found through various analyses that Ericsson should invest in a pilot project initially to minimize risks. After an evaluation of the pilot project it is recommended to start an aggressive investment strategy. In this way it is believed that Ericsson will raise barriers for entering competitors and thus create a more profitable business. The strategy is also believed to overcome the weakness of the Ericsson non-associated tower brand easier through faster implementation of the business on a wider scale than competitors. Moreover, it was also found that Ericsson should differentiate the service compared to competitors. Ericsson has the capability to supply customers with a service with perceived benefits, thereof the strategy. It is estimated that Ericsson will alone be able to hold such a position in the industry and thus the incentive to price their service slightly higher than competitors. It is furthermore recommended that Ericsson should monitor the new business closely to correct dissatisfying performance in time.
Sammanfattning
Ericsson Indien tittar för nuvarande in på alternativet att erbjuda en ny tjänst till sina kunder. Tjänsten är en uthyrningstjänst, vilken innebär att Ericsson hyr ut passiv ”site”-infrastruktur till operatörer. En anledning till att Ericsson funderat på tjänstesektorn som ett rätt naturligt område att utöka sina tjänster inom, är dess ökade betydelse inom företaget då den utgör en allt större del av koncernens inkomster. Den ökande efterfrågan i utvecklingsländer som Indien på den så kallade ”turn-key” tjänsten, vilken innebär att Ericsson förser kunden med ett komplett ansvar över utbyggnad och operation av nätverk, är ett exempel på en sådan utveckling. När möjligheten att starta en ”uthyrning av siter” tjänst uppkom blev därför de många fördelarna med en sådan tillväxt snabbt tydliga. Det här exjobbet undersöker därför hur Ericsson bäst ska gå in i den här s.k. ”tower industrin”.
Att hyra ut ”siter” till multipla operatörer är en tjänst som förväntas startas i Indien med eller utan Ericsson. Detta för det statliga stödet av tjänsten. Eftersom målet med tjänsten är att locka till sig så många operatörer som möjligt till varje ”site” för förbättrad vinst, kommer också operatörernas kostnad minska för den passiva infrastruktur delen. Dessa konstandsminskningar är den huvudsakliga orsaken till tron på att tjänsten kommer ge incitament till en större utvidgning av nät i rurala områden som just nu har en täckning på mindre än 2%. Ännu en anledning till varför staten stöttar en utveckling av tjänsten är för att den förväntas förbättra estetiken i landskapet genom färre byggda torn och en höjning av kapaciteten i de överbelastade nätverken i städerna som står inför ett problem med otillräcklig mark.
Genom olika analyser i exjobbet fann man att Ericsson borde investera i ett pilot projekt initialt för att minimera riskerna. Efter en utvärdering av projektet rekommenderas en mer aggressiv investerings strategi. Genom en sådan aggressiv strategi förväntas Ericsson kunna höja barriärer för inkommande konkurrenter. Färre konkurrenter skapar större möjligheter för högre marginaler och därmed högre vinster. Det är också förväntat att strategin kommer lättare besegra en av Ericssons största barriärer, det icke-associerade Ericsson märket i ”tower industrin”. Exjobbet presenterar också den funna mest strategiska placeringen för den nya tjänsten i industrin. Ericsson bör differentiera sin tjänst jämfört med konkurrenterna, då företaget har större möjligheter att erbjuda en bredare tjänst. Den bredare tjänsten inkluderar möjligheten för Ericsson att förse kunder med komplett lösning, från uppbyggnad till underhåll och operation av alla delar av nätverket. Ericsson kan exempelvis erbjuda en uthyrnings tjänst av ”siter” tillsammans med deras ”turn-key” tjänst. Behovet för kunder att bara behöva gå till en ”one-stop-shop” för samtliga tjänster och produkter anses skapa en konkurrenskraftig position. Därför finns det anledningar att tro att Ericsson kan ta ut något högre priser än konkurrenter. Slutligen rekommenderar exjobbet företaget att övervaka den nya tjänstens utvecklig på marknaden för att kunna korrigera strategin i rätt tid.
Table of Content
1. Introduction... 1 1.1 Background ... 1 1.2 Purpose... 1 1.4 Delimitations... 2 1.5 Target Group ... 21.6 Disposition of the Thesis ... 2
2. Practical and Theoretical Framework ... 4
2.1 Methodology ... 4
2.2 Theoretical Framework... 6
3. The Indian Market... 11
3.1 Indian market ... 11
3.2 Mobile Telecom History ... 13
3.3 Market Growth... 13
3.4 Stakeholders... 15
3.5 Market Challenges ... 19
3.6 Key Findings... 22
4. The Business Concept ... 23
4.1 Definition of Concept ... 23
4.2 Why Shared Infrastructure? ... 24
4.3 Why not Before and why not More?... 25
4.4 Governmental Push... 26
4.5 Infrastructure Sharing’s Impact on Goals ... 27
4.6 Size of Market... 28
4.7 Shared Infrastructure in Other International Markets... 29
4.8 Key Findings... 33
5. Ericsson – the Company Behind... 35
5.1 Total Growth of Ericsson India... 35
5.2 Offered Services... 36
5.3 The People ... 38
5.4 Why Include in Ericsson Business?... 38
5.5 Expectations... 39 5.6 Key Findings... 39 6. Analysis ... 40 6.1 Investment Analysis... 40 6.2 Market Analyses ... 47 6.3 Risk Analysis ... 56 6.4 Analyses Findings... 59 6.5 Key Findings... 60
7. Entry Strategy Conclusion ... 61
7.1 Action Plan Model ... 61
7.2 Entry Strategy Conclusion and Discussion... 64
7.3 Recommendations for Further Studies... 67
References... 68
Appendix I – Definitions ... 75
Appendix IIa) – Tower Estimations Spreadsheet ... 78
Appendix IIb) – Tower Cost Estimations Spreadsheet... 79
1. Introduction
The chapter will discuss and clarify the background, main purpose and sub purpose, and delimitations of the thesis. It will also present the disposition of the thesis in order to get a clear picture of the structure and content of the paper.
1.1 Background
India is today one of the fastest growing telecom markets in the world. With around five million new subscribers per month the market holds great business opportunities for telecom vendors like Ericsson (TRAI, 2006). Even though Ericsson is presently the market leader the company must continuously review its service and product portfolio and look for new opportunities to stay on the top.
Recent changes in the market have lead to an opening of a new business in India, the main scope being to lease out space on telecommunication sites to multiple operators. The business has been present in other markets for several years, but has not until recently been applicable in India. Today there exist nine major operators in the country and each operator owns their own sites, where the tower and the equipment needed to run a network is put up. In many areas three towers from three different operators can be seen next to each other. To cut expenses operators could instead share one tower. In this way many current market challenges, like the almost nonexistent network coverage in rural areas, esthetic concerns, and lack of space in urban areas, are expected to improve. Even though all of these challenges are of importance to address, the challenge of bringing network to rural India is viewed to be the most crucial. Network coverage in rural areas is expected to not only result in a growth of the GDP but also in improved conditions for India’s poor rural population. The government of India has realized these benefits to the economy and to the individual citizen and has therefore started a project to kick-start an implementation of the idea. The government has also realized that a third party is most likely needed to supply the market with the tower sharing solution because of the present difficulties for the operators to run the business on their own. Such difficulties are for example the rivalry culture between the operators and their need to focus more on their core business due to the immense market growth. The project has therefore lead to a new business opportunity for companies connected to the telecom market.
Ericsson has identified this new business opportunity as a possibility to grow in the increasingly important service segment. Ericsson believes, among other positive effects, that such a service could imply an added value to their customers. As an effect, Ericsson is presently more interested in how to enter the business than if they should enter. The thesis will therefore investigate and analyze the market and its expectations and give recommendations for a successful entry strategy.
1.2 Purpose
The main purpose and aim of the thesis is through various analyses answer the question; how should Ericsson enter the “telecom site leasing” business in India. In order to reach
an answer to the “how” question, it is necessary to deal with the question if Ericsson should enter the industry. It is necessary because it gives a broader platform to stand on when suggesting entrance strategies. The thesis aims at answering this question through firstly a model which explains the internal course of action and secondly the internal and external strategic choices. The hope is that the thesis will contribute to the material needed by Ericsson to make a successful business entrance in the market.
1.4 Delimitations
The thesis has been limited to a general strategic discussion not including into depth evaluation of the technological platform. The technology of how a mobile network is run is very complex. When necessary to include technical aspects simplifications of the real world will be made.
The thesis does also not include a thorough business intelligence analysis of the market players and possible partners. It will hence not go into detail of each such possible player and partner, but will instead generalize them into groups. The difficulty in extracting such information is one reason behind this limitation. The sensitiveness of the subject and difficulties in the Indian market are two other reasons. The information in this area will therefore be taken from the internet and personal contacts within Ericsson.
The thesis has also been limited to only include the result of various cost calculations. The calculations have been made from partially sensitive numbers for Ericsson and will therefore not be made public.
1.5 Target Group
The principal target group of the thesis is Ericsson’s service unit in India. Other target groups include students at the Industrial Engineering and Management program and the Production Management department at Lund’s Institute of Technology.
1.6 Disposition of the Thesis
The first chapter gives an introduction to the paper. It explains the background, the purpose and delimitations, and clarifies the disposition of the thesis.
The second chapter presents the methodology and the theoretical framework. The methodology explains how the information to the thesis has been gathered. The information will be categorized as primary or secondary, the primary mostly being interviews and discussions with Ericsson employees, the secondary mostly being desktop research. The methodology will also discuss the validity and reliability of the thesis. The theoretical framework will moreover define and present the theoretical content of the thesis. The theoretical content here is the tools and models used in the analyses.
The third chapter provides the reader with information about the Indian telecom market. The Indian market is different from the Swedish market and needs to be explained in order to understand the need for the proposed business.
The fourth chapter deals with the concept of the “telecom site leasing” business. The chapter will define the concept and discuss various opportunities and challenges with it. It will also present a global study of the business in selected countries. The chapter aims at laying a foundation for understanding the business and why Ericsson wants to enter it. The fifth chapter presents Ericsson India. The chapter discusses the growth, the services, the people, and the expectations of the business. The chapter will be an important ground to draw the internal factors conclusions from.
The sixth chapter analyzes the business out of an Ericsson perspective. The models and tools presented in the theoretical framework will here be applied to the content of the thesis. The aim of the analyses is to give a picture of the industry to understand external factors, but also give a picture of Ericsson’s strengths and weaknesses to understand internal factors. The analyses will be the platform which the entry strategy will be built on.
The seventh and final chapter summarizes the result of the thesis. It will provide the reader with an internal action plan, which should be executed before, during, and after entering the market. The chapter will also present the concluded entry strategy, both how to prepare internally and where and how to enter externally. The chapter will, with this conclusion, answer the question which was the main purpose of the thesis; how Ericsson should enter the “telecom site leasing” business. The thesis ends with some recommendations for further studies in order to improve the knowledge base and hence the strategy.
2. Practical and Theoretical Framework
The practical and theoretical framework chapter explains the methodology of the thesis and the models and tools used. The practical framework aims at guiding the thesis target group through the research and how it was executed. The aim of the theoretical framework is to present the models and tools used in the thesis and why they have been chosen in order to come to the conclusion.
2.1 Methodology
To gather information for the thesis three main research methods have been used, these being interviews, general observations, and desktop-based research. Desktop research has been the natural start to understand the market, the concept, Ericsson India, and the theoretical part of the models used in the analyses. When continuing to the Ericsson perspective and applying the theoretical models to the market and Ericsson, the use of primary sources have been necessary. Observations made of working procedures and cultural differences have also contributed to the analyses.
These methods have been chosen with regard to the purpose and the market situation. Difficulties, as will be further elaborated on in the primary sources chapter, has prevented the use of some other methods.
2.1.1 Primary Sources
The primary sources used for interviews and discussions have been people from Ericsson both in India and head office in Stockholm. The Indian research was performed in Delhi, Ericsson’s Indian head office, for two months in the months of August and September. These primary sources have helped with the understanding of the market, the business, and Ericsson’s expectations. They have also provided with all the information necessary to perform the cost/profit analysis, statistics, and internal reports.
The choice of the primary sources has been a natural result of discussions with the thesis company supervisor. The supervisor, Mr Rajul Kumar, has many times provided with helpful tips of people to talk to for information regarding different questions. In most cases these tips have lead to talks with the Ericsson India’s manager of network roll-out (NRO), Mr Vibhas Sharma.
It should be noted that the “corporate” culture in India and the sensitiveness of the topic made it difficult to gain trust for an open discussion of various issues within Ericsson India. A general reluctance to share information was a challenge which was difficult to overcome. The reluctance to share is believed to not only stem from the sensitiveness of the topic but also the lack of professional merits and maybe also the fact of me being a woman. In India professional status is very important to get access to information and time from employees. Unfortunately it is also a country which is far from equality between men and females.
2.1.2 Secondary Sources
As mentioned, desktop research has been a widely used method in the paper. The Ericsson internal database, which all Ericsson employees get access to, has been an important source of information. Many consultation papers and relevant news articles have been extracted from this database. These papers have contributed to the understanding of the market and the business concept, but also in the understanding of Ericsson.
Another important secondary data source has been the annual reports from the American tower industry. Companies listed on one US’s stock exchanges must follow a certain format, called 10K, when writing their annual reports (U.S. Securities and Exchange Commission, 2006). Thanks to this law the annual reports contain a lot of information, both detailed and general. These reports have therefore contributed to a better understanding of the tower industry and the potential of a similar business idea in the Indian market.
Other sources which have been of great importance for the study of the market and the concept are the websites of the Cellular Operators Association of India (COAI), Telecom Regulatory Authority of India (TRAI), and the Department of Telecommunication (DoT). As for the theoretical part of the models used in the analyses, the Harvard Business Review has proven to be yet another great source.
2.1.3 Validity and Reliability
The thesis contains sources of error that may affect the degree of validity in the analysis results. Six main such sources have been identified; lack of more primary sources, objectivity, cultural difficulties, internet reliability, validity of assumptions made from the American tower industry, and varying results from different secondary sources. These will be discussed below.
Firstly, the sensitiveness of the topic, being a strategic proposition, brought some difficulties, as already mentioned, when collecting information. The research has therefore mostly been made from written secondary sources. It is estimated that the results would be more reliable if more primary sources would have been used. The viewpoints from the wireless service providers themselves and the regulators in the country would, for example, have provided with a more reliable analysis.
Secondly, it should be understood that the objectivity of the thesis can be questioned since the research has been done at Ericsson for Ericsson. The thesis will naturally be influenced by Ericsson’s believes of the “telecom site leasing” market.
Thirdly, the cultural differences have affected the possibility to collect information from the primary sources and hence the results. As mentioned, the lack of professional status and being a female are two aspects of these differences which are estimated to have affected the time taken by these sources to contribute to more accurate results.
Fourthly, information has been extracted from the internet, which as a result has contributed to the final conclusion. The internet is an obvious possible source of error. Fifthly, many assumptions have been made from the American tower industry. The assumptions may be a source of error if the differences of the markets prove to be larger than expected.
Finally, Ericsson has, as most companies, a wide internal database where many reports can be found. These reports are mainly written by various consultant companies, which sometimes use varying data. This data has to some extent been used and contributed to the results. It is estimated that the data could be a possible source of error.
2.2 Theoretical Framework
To answer the question how Ericsson should enter the business of “telecom site leasing” in India, the thesis will provide the reader with five analyses; cost/profit analysis, barriers of entry analysis, five forces analysis, SWOT analysis, and a financial respective partner risk analysis. These analyses will lead to a conclusion to the above question. The conclusion will in its turn be presented as a model, the model best explained as an action plan specific for Ericsson to follow for a successful entry. The analyses will also lead to a conclusion of a strategic position, in terms of price vs. perceived service benefits, of the business in the industry.
The reason why these models have been chosen is because each of them gives different valuable insights to the market. An investment and sensitivity analysis highlights the potential of the business, but also the risks. The “barriers of entry” and “five forces” -analysis gives information about which forces and barriers is needed to decrease or rise to increase profitability. The SWOT analysis gives a clear picture of Ericsson’s strengths which should be taken advantage of in the entry strategy. It also addresses the threats and weaknesses which Ericsson needs to look out for. They have hence been evaluated to provide the best support to draw the conclusion from. Each analysis tool used in the thesis is presented below
2.2.1 Investment Analysis
A cost/profit analysis is of great importance to understand how to strategically price ones services and or products. In such an analysis all costs and revenues associated with the service/product should be included over the life of the investment. In this way the profit margin can be viewed over the years. To further analyze the profitability of the business calculations as Net Present Value (NPV), Pay Back (PB) period, and Internal Rate of Return (IRR) should be done. The mathematical formulas can be seen below.
N t t t i C NPV 0 (1 )
N C I PBperiod N t t 0
N t t t IRR C I 0 1When the initial cost analysis is finished a sensitivity analysis is easily performed. Through the sensitivity analysis both different risks and opportunities can be relieved.
2.2.2 Barriers of Entry Analysis1
When entering a new business, as when entering a new market, six major entry barriers exist; economies of scale, brand identification, capital requirement, cost disadvantages independent of size, access to distribution, and government policy (Porter, 1979). The acquisition route of entry, which many firms choose, faces other problems which will not be discussed here (Yip, 1982). The “barriers of entry” analysis is important to understand the difficulties and gateways when entering a business.
Economies of scale – The economies of scale barrier determine entry by forcing the aspirant either to come in on a large scale or to accept a cost disadvantage.
Brand identification – Brand identification creates a barrier by forcing entrants to spend heavily to overcome customer loyalty.
Capital requirement – The need to invest large financial resources in order to compete creates a barrier to entry.
Cost disadvantages independent of size – Incumbent companies may have cost advantages not available to potential rivals, no matter what their size and attainable economies of scale. These advantages can e.g. stem from the effects of the learning curve (and the experience curve) and proprietary technology solutions.
Access to distribution – An entrant in any market or business must secure distribution of its services.
Government policy – The government can limit or even foreclose entry to industries with such controls as license requirements. The government can also play a major indirect role by affecting entry barriers through institutional voids as lack of infrastructure.
1 Source is Porter, 1979 if not otherwise stated.
Ct = Cash flow
i = discount rate
t = time of the cash flow N = total time of project I = project initial investment NPV = Net Present Value PB period =Pay Back Period IRR = Internal Rate of Return
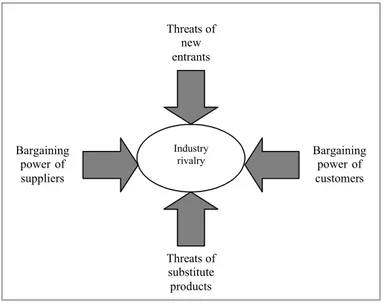
2.2.3 Porter’s Five Forces Analysis2
The five forces analysis pictures the profit potential of an industry. The weaker the forces are collectively the greater the potential. The goal of the analysis is to find a position in the industry where the business can best defend itself against these forces or can influence them in its favor. In order to find this position one needs to analyze each force.
Industry Rivalry – The profit potential of an industry is high if the rivalry or competition is low. The industry rivalry is normally measured by how high the concentration of the market share is divided among the four largest firms. A low concentration ratio indicates that the industry is characterized by many rivals, no one of which have a significant market share. Such a market is more competitive. A high concentration ratio is, on the other hand, an industry with few rivals with large portions of the market share.
Threat of substitute products – The profitability of a market is high if the threat of substitute products or services is low. The products/services that one should keep a close watch on are those that can improve the price-performance trade-off with the industry’s product, or those that are produced by industries earning high profits. Substitutes often emerge through either price reductions or performance improvements.
Bargaining power of customers – The power of the customers can influence the prices of the product/service substantially. The higher the power of the customers the lower the profitability is of the industry.
Threat of new entrants – If the threat of new entrants is high, the barriers of entry being low, the profitability of an industry is lower.
2 Source is Porter, 1979.
Industry
rivalry Bargaining power of
customers Bargaining power of suppliers Threats of substitute products Threats of new entrants
Bargaining power of suppliers – Alike the bargaining power of customers, the higher the power of the suppliers the lower the profitability is of the industry.
2.2.4 SWOT Analysis3
Another well known analysis tool is the SWOT model. The model is useful in order to realize and understand both the strengths and opportunities, but also the weaknesses and threats of a business. The goal of the analysis is to highlight the internal weak areas which need attention and strong areas which should be put emphasis on toward the customer. The goal is furthermore to understand and identify the external threats and opportunities of the business. The SWOT analysis gives further input how to strategically position oneself in the industry.
2.2.5 The Strategy Clock Analysis4
The strategy clock analysis clarifies the competitive strategic options of a new business. To win customers in an industry with a number of players a company needs to place its products or services in a strategic position. The strategic clock represent different such positions.
‘No frills’ - The ‘no frills’ strategy focuses on low prices and not quality or extra benefits to the customer. Such a service/product fits well in a price sensitive market segment. Risk: narrow market segment reach.
Low price – The low price strategy focuses the competitive power on price while still offering the same quality and benefits of the service as competitors. Risks: price wars and low margins; need to be cost leader.
Hybrid – The hybrid strategy tries to compete with price and quality/benefits simultaneously. Risk: need to have a low cost base.
Differentiation – The differentiation strategy aims at delivering high quality and extraordinary service benefits to the customers either to a premium price or similar price as competitors. Risks: added value enough to bear a premium price or need to have a low cost base to compete with similar price as competitors.
Focused differentiation – The focused differentiation strategy focus on a small market segment capable and willing to pay a higher price for high service benefits. Such a service/product is usually supported by a strong brand. Risks: narrow market segment reach and perceived service/product benefits.
3Source is Johnson, Scholes, and Wittington, 2005
’No frills’ Low price Hybrid Differentiation Focused differentiation Strategies destined for ultimate failure Low High High Price Percieved product/service benefits Low
3. The Indian Market
In this section information about the present telecom industry in India will be presented. The chapter has been included in order to understand the need for shared infrastructure and its role in the Indian market. Topics that will be dealt with include history of mobile services in India, market growth, stakeholders, and industry challenges.
3.1 Indian market
India consists of 28 states as shown in figure 3.1. The telecom market, on the other hand, is divided into 23 circles (see table 3.1 and figure 3.2), which roughly correspond to the Indian states with the additions of the 4 city circles and some coalitions between the smaller states. The circles are divided into Metropolitan, A, B, and C circles. The division is based on market size and potential according to the government, A being the largest market with highest potential.
At the present it lives around 1104 million people in India5. 70% live in the rural areas and 30% in the urban areas. India's population is still growing and is expected to pass China as the world’s most populous country before 2030 (Haub and Sharma, 2006).
5 Source: National Commission on Population, Government of India Telecom Circles in India
Metropolitan
Circles A Circles B Circles C Circles
1. Delhi 5. Maharastra 10. Kerala 18. Himachal Pradesh
2. Mumbai
(Bombay) 6. Gujarat 11. Punjab 19. Bihar
3. Kolkata (Calcutta)
7. Andhra
Pradesh 12. Haryana 20. Orissa
4. Channai (Madras) 8. Karnataka 13. Uttar Pradesh (W) 21. Assam
9. Tamil Nadu 14. Uttar Pradesh (E) 22. Northeastern states excluding Assam 15. Rajasthan 23. Jammu & Kashmir 16. Madhya Pradesh
17. West Bengal & Andaman and Nicobar islands
Figure 3.1. Map of India and its states.
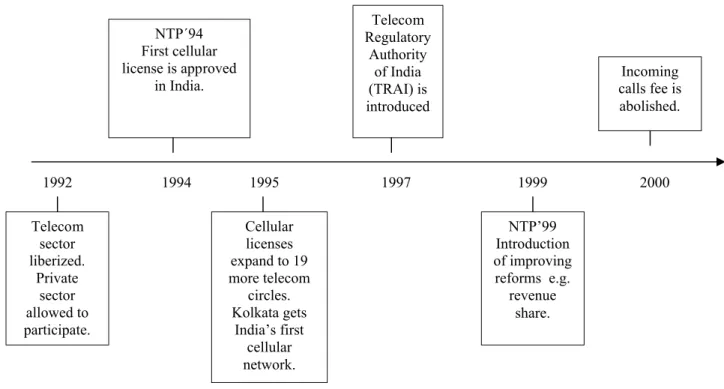
3.2 Mobile Telecom History
In India the first cellular license was approved in 1994 and the first network built in 1995. In order for the government to have a say in shaping the growth of the telecom industry two major policies have been introduced during the years. These have been of importance for the growth of the telecom market. A National Telecom Policy (NTP) has been announced in 1994 and 1999. The NTP’94 provided the market with increased incentives for telecom service providers to grow in the market, as the main objective of the policy was to reach villages across India with telecommunication services at affordable prices. It was announced to provide increased activity to the liberalization process (TRAI, 2004). Two cellular operators from the private sector were at the time introduced. Since then the number of active operators have increased to eleven. The NTP’99 was also a growth catalyst with the annunciation that revenue share6 was permitted. Furthermore, four operators were now allowed to compete in the market. A summary of the events is shown below in figure 3.3.
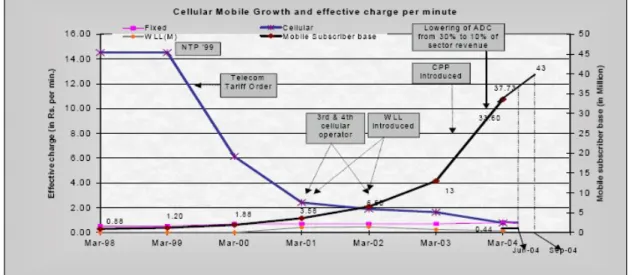
3.3 Market Growth
The NTPs have, as described, played a major role in the growth of mobile telephony in India. As seen in figure 3.4 the subscription base has grown exponentially in the last couple of years. Most recently, from April 2005 to March 2006, the annual growth
6 Revenue share means that the wireless service providers can partially or fully pay for their equipment or
other services via a percentage of their incurred revenue for a negotiated time period. Telecom sector liberized. Private sector allowed to participate. NTP´94 First cellular license is approved in India. NTP’99 Introduction of improving reforms e.g. revenue share. Telecom Regulatory Authority of India (TRAI) is introduced Cellular licenses expand to 19 more telecom circles. Kolkata gets India’s first cellular network. 1992 1994 1995 1997 1999 2000 Incoming calls fee is abolished.
reached 72.6% (TRAI, 2006) and it is presently added around 4-5 million new mobile subscribers every month (TRAI, 2006). The number of monthly newly added subscribers, to get some perspective of the immense growth, is equal to the total population of Norway.
The growth of mobile subscribers has brought with it many positive effects on the country, as a higher overall economical growth. One negative effect of the growth rate, on the other hand, is the operators’ lack of capability to keep up with the demand. As a consequence, one problem that has emerged is high congestion levels between networks (TRAI, 2005). In order to overcome such a challenge operators in India have developed a need for suppliers of total network infrastructure to focus more on their core business. It is clear that equipment vendors are more often hired for these so called turn-key projects in developing markets than in more mature ones.
The presently exponentially high growth rate is expected to slow down as seen in figure 3.4 above. Future governmental forecasts predict that the country will reach around 200 million subscribers at the end of 2007 and 500 million by 2010 (Raj, 2006). The calculated average growth rate from 2006 to 2010 would thus be 45% per year, to be compared to the above stated growth of around 72% the previous year. Still, almost five times as many users from June 2006 to the end of December 2010 are predicted with this forecast.
3.4 Stakeholders
In the Indian telecom sector five major stakeholders are recognized; operators, special interest groups, government/regulators, equipment vendors, and customers. These are going to be discussed in the following chapter.
3.4.1 Operators
The current competitive outlook among operators in India is fierce, the reason being the high number of operators and the price sensitive consumer market. Even though the NTP’99, with the introduction of revenue share, has (as seen in figure 3.5) been the biggest contributor to the decreased tariff fees, the competitiveness of the market is also regarded as an important catalyst. India has today one of the lowest tariff fees in the
world (TRAI, 2006), with tariffs around 0.02 USD/minute7. The operators can support the low tariffs because of their scale advantages. The number of subscribers which are reached with just one tower in the densely populated areas are high, resulting in a rather low cost per subscriber. The average revenue per user8 (ARPU) is around 8.0 USD (TRAI, 2006). The ARPU is lower than western markets (ARPU in Sweden is around 28 USD9), but the scale of the market makes it high enough for high total profits. The current market leader among the operators has total revenues of their mobile services of
7≈ average extracted from operators’ website 8 Measured per month
9 Source: TeliaSonera’s website
1.7 billion10 USD, to be compared to Sweden’s wireless service provider market leader TeliaSonera’s revenue for mobile services of 1.5 billion11 USD.
There exist eleven wireless service providers in India. They differ in size and geographic presence as shown in table 3.2 and figure 3.6. Bharti is currently the market leader closely followed by Reliance Infocomm and BSNL. As of July 2006 the private operators held an 80% market share while the governmental owned (BSNL & MTNL) held a 20% share of the cellular market.
10 Source: Bharti’s 2005 annual report. Note that due to increased sales their revenue has increased. It is
estimated that their annual revenue for their mobile services for 2006 will be around 2.3 billion USD.
11 Source: calculated from TeliaSonera’s website, only including mobile services in Sweden. Operator Statistics
Operators Network Circles subscribers (M)Mobile
Bharti Tele-Venture (GSM) all circles 23.09
Reliance Infocomm (GSM & CDMA) 1 – 16, 18 – 20 22.52
Bharat Sanchar Nigam LTD (BSNL) (GSM &
CDMA) 3 – 23 21.19
Hutch/BPL (GSM) 1 – 15, 17 18.29
TATA Teleservices (CDMA) 1 - 20 10.36
IDEA Cellular (GSM) 1, 5 – 7, 10, 12, 13 – 16, 18 8.54
Aircel/Dishnet (GSM) 4, 9, 17, 20 - 23 3.20
Mahanagar Telephone Nigam Ltd (MTNL) (GSM &
CDMA) 1 – 2 2.18
Spice (GSM) 8, 11 2.05
HFCL (CDMA) 11 0.12
Shyam Telelink (CDMA) 15 0.065
Operators M arke t Share
B harti, 20.7 B SNL, 19 Reliance, 20.2 Hutchinso n/B P L, 16.4 IDEA , 7.7 A ircel, 2.9 Spice, 1.8 TA TA , 9.3 M TNL, 1.9 HFCL, 0.11 Shyam Telelink, 0.06 B harti B SNL Reliance Hutchinso n/B P L IDEA A ircel Spice M TNL HFCL Shyam Telelink TA TA
3.4.2 Special Interest Groups
The special interest groups, for mostly COAI and AUSPI, are another rather powerful stakeholder in the Indian telecom market. The groups are shortly presented below.
The Cellular Operators Association of India (COAI) is an independent non-profit organization for GSM operators active in the Indian market. Its objective is to protect member interests through its rather strong influence on policy making.
The Association of Unified Telecom Service Providers of India (AUSPI) is equivalent to COAI but for CDMA operators. AUSPI is also a non-profit organization whose objective is to collect and distribute knowledge, attract investments, and interact in policy making. Other special interest groups include the Association of Basic Telecom Operators (ABTO), the Telecom Equipment Manufacturer Association, the Telecom Industries & Services Association, and Core Group of Telecom Industries Association. These groups hold substantially less influence power than the COAI and AUSPI.
3.4.3 Government/Regulators
The third identified major stakeholder is the government/regulators. All of the regulators in India have as their chief goal to enhance the telecom market growth in a sustainable fashion including both urban and rural areas. In order to do this different parties are involved with various responsibilities and authorities.
In India the Department of Communication (DoT), working under the ministry of communication and information technology, handles and set all policies, licensing, and coordination matters within the field of telecommunication.
Figure 3.7. Wireless service providers and their respective market share in India (TRAI, 2006)
The Telecom Regulator Authority of India (TRAI) is an independent organization established by the government of India. The authority’s role is to regulate the telecommunication business in India. It controls and supervises the quality of telecom services, operational issues, consumer interests, pricing, and any unethically business to name a few responsibilities. To achieve fair competition among the operators TRAI issues regulations, orders, and directives when the need arises.
The Telecom Disputes Settlement and Appellate Tribunal (TDSAP) role is, as the name suggests, settling disputes between the licensors and the licensees, between service providers, and between service providers and groups of consumers. The introduction initiative of the tribunal was taken by the TRAI.
3.4.4 Equipment Vendors
The fourth identified stakeholder is the equipment vendors. Today, all presently existing equipment vendors are active in the Indian market. No vendor wants to miss out on business deals in one of the fastest growing telecom markets in the world (China and India are in the top, but the number one country changes back and forward) (TRAI, 2006). Operators are buying telecom equipment fast and in large quantities to keep up with demand. Great business opportunities thus arise for the equipment vendors, who are increasingly trying to target developing markets to keep growth up and cover for the more mature Western markets. Respective vendor and their market share specific to India is presented below in figure 3.7.
Vendor Market Share (GSM + CDMA)
No kia 20.3% Others 1.4% Ericsso n 30.6% Huawei 0.7% No rtel 3.1% M o to ro la 15.7% Lucent/A lcatel 21.8% Siemens 5.9% ZTE 0.6%
3.4.5 Customer Needs
The customers of mobile services are also a stakeholder. The bargaining power of a dispersed group like the end users in a big and rather poor country like India is concluded to be weak.
Customer needs are estimated to be the same in India as everywhere else in the world when it comes to telecom networks. Customers want to have a country wide geographical coverage of their mobile network, good quality of the services (e.g. no congestion between networks), and reasonable prices for usage of the network. The last statement may be more specific to India with concern to the price sensitive market. Presently, only the last need is fulfilled, both the network reach and the quality are not at customer satisfaction.
3.5 Market Challenges
The increase of telecom density (mobile + fixed) and the exponential growth of mobile subscribers have led to a faster economical development of India, but it has also brought some challenges and issues along with it. The rural teledensity is lagging behind while the urban growth has skyrocketed (see figure 3.8). The fast urban growth is almost entirely due to the growth of mobile services in the areas. Both markets are presently facing expansion problems, but for different reasons. These challenges are going to be discussed below.
3.5.1 Rural Market – high cost for infrastructure & operations
The rural areas were as of October 2004 contributing to about 25% of India’s total GDP (TRAI, 2004). The contribution is estimated to still be the same due to the low growth rate of the area. Agricultural activities are presently the largest activity in rural India (Indian Embassy, 2006). Agriculture is India’s biggest contributing sector to the national GDP. Presently, it contributes with almost 33% of the total GDP (Indian Embassy, 2006).
Urban and Rural Te ledensity
0 5 10 15 20 25 30 35 1996 1997 1998 1999 2000 2001 2002 2003 2004 2005 2006 Year T e le d e n s ity ( % ) Urban Rural Total July -06
Figure 3.8.Difference between urban and rural teledensity. (TRAI, 2005; Times News Network, 2006; Lee, 2006)
The Indian government and TRAI have tried to encourage more operators to invest in the rural markets. The result of an increase of telecom density in rural areas is an enhancement of efficiency and efficacy of the already existing commercial and agricultural activities. One example is the possibility for farmers via telecom services to access information on agriculture topics like trading prices and fertilizers (Prahalad, 2005). The telecom sector is counted as being the single strongest factor to achieve economic growth (TRAI, 2004). The regulators have not succeeded as of today with pushing the operators to expand the telecom network to these areas and thus the rural market is still lagging behind the expected growth levels. As of July 2006 the cellular market penetration in the rural areas was 1.87% (Times News Network, 2006).
As mentioned, around 70% of India’s population lives in the rural areas, meaning around 770 million people. The possibilities for the operators to increase their subscription base in these areas should therefore be immense, but as the buying power here is substantially lower than in the cities and customers are more dispersed, benefits get reduced. The deployment of wireless telecom services in rural India have, on the other hand, some advantages compared to other developing countries. A wide expanding Optical Fibre network already exists through out the country reaching rural areas. The reason why the operators still haven’t moved their business further out in the country stems from various reasons, these being discussed below (summary based on various sources within Ericsson India).
1. The vast growth of the telecom market since the introduction of mobile networks in 1995 has led to problems for the operators to keep up. Most operators have therefore focused on the bigger city areas to win as many subscribers as possible in the least amount of time and the least amount of investments. The cost per subscriber is higher in the rural areas.
2. Even though an Optical Fibre network already exists to a great extent it is far from the total last mile infrastructure of a network (see figure 3.9 for a graphical representation of the problem). Costs of building a last mile infrastructure for a mobile network is a huge investment.
3. Rural areas incur higher costs for logistics, maintenance, and electricity due to the remote locations and lack of availability of electricity. Generators are needed as power supply for the equipment in these areas.
4. One might expect the governmental owned operators (BSNL & MTNL) to take on the responsibility to build out the infrastructure, since this will help the growth of the GDP faster. BSNL does also take some responsibility, but they are slowed down because of the first reason stated above (see bullet 1) and the bureaucracy environment within the company. Furthermore, it is crucial for BSNL to run their business in a cost sustainable fashion to stay competitive to the market competitors.
The TRAI’s Universal Service Objectives (USO) has made several attempts to get around these problems shown in figure 3.10 below.
Delhi Mumbai
Backbone (Optical Fibre network)
Last mile infrastructure Rural
village
Existing railway, Optical Fibre network
Last mile infrastructure missing to cover village with mobile network.
Basic network build-up between cities. Rural network problem
Figure 3.10. TRAI’s Universal Service Objectives (TRAI (2004) p. 14) Figure 3.9. The basic structure of problem of a mobile network.
Neither of these objectives has succeeded in achieving the goal of a faster increase of teledensity in the rural areas. The gap between the urban and rural has instead grown, as seen in figure 3.8.
3.5.2 City/town Market – lack of space
The urban market has, as shown in figure 3.8, a teledensity of around 34% as of June 2006 (Lee, 2006). Delhi has a mobile teledensity of around 43% and a total teledensity (fixed and mobile) of 60% (Singh, 2006). The biggest problems the operators are facing in the bigger city areas as Delhi are a lack of space left to continue the build-out and increased prices of site estate. Also, more recently, esthetic and safety reasons have developed. To overcome these challenges operators are now trying to share towers in order to grow in cities. Around 20% of the towers are shared by two operators (Ericsson, 2006). Usually when two operators decide to share a tower they agree on it on the premises that an “exchange” takes place. When an exchange takes place, two operators allow each other to use the others’ site to put up network facilities. Each operator still owns their own site and maintain it in usual manner, but allows the use of their site’s passive infrastructure.
3.6 Key Findings
The key findings of the chapter are highlighted below.
Wireless growth continues, but is expected to slow down over the next four years.
India is a highly competitive and price sensitive market.
Operators need to focus more on their core business to grow and keep up with demand.
The telecom sector is viewed as the single strongest factor to achieve economic growth.
98% of the rural areas are still uncovered by mobile network. The primary reason for the slow growth rate in the regions is the higher cost per subscriber.
Urban markets are facing space problems and increasingly expensive site estate prices.
The key findings of this chapter will lay as a foundation for the continuing chapters, where the shared infrastructure concept and its opportunities will be discussed.
4. The Business Concept
The topic of focus in the coming chapter is the basic concept of the “telecom site leasing” business in the Indian market. The topic aims at laying a foundation for understanding the industry and why Ericsson wants to go into the business. A definition of the concept will firstly be given, followed by a discussion of the benefits, and why the concept has not been used in India before. Further discussions include the governmental initiative to start off the concept, some estimations of impact on goals and size of market, and finally a global market study.
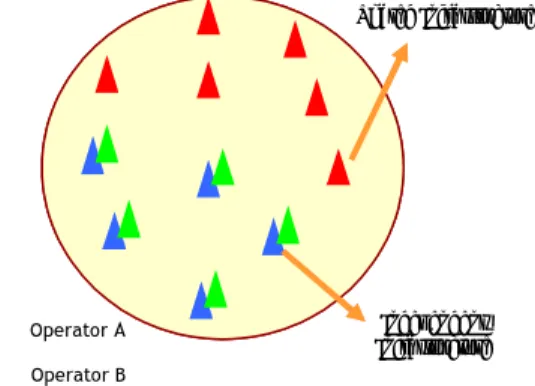
4.1 Definition of Concept
The concept of shared infrastructure in the telecom industry refers to, as the name suggests, two or more operators sharing network facilities (see figure 4.1). The concept has several variants, the four main ones presented below (Saran, P., Sridhar, V., 2005).
The simplest form is the sharing of space on towers (+ shelters, diesel generators, and air-conditioning). Only the basic tower facilities are shared, meaning that separate networks for each operator still exists.
Addition of antennae sharing, which is more complex due to technical issues.
Addition of base station sharing. This is considered as active infrastructure sharing.
Addition of core network sharing, which is also considered as active infrastructure sharing.
The variant under development for implementation in India is the first. Note that different solutions of this variant also exist.
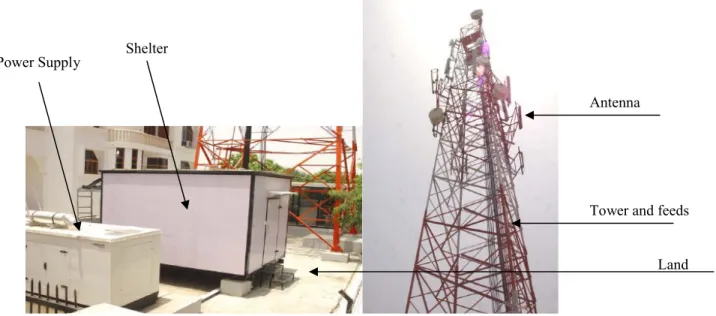
Figure 4.2 shows an example of how a shared infrastructure site can look like. Sharable infrastructure in India includes (DoT, 2006):
Land Tower Antennae Feeds Shelters Power Supply
Figure 4.1.The basic “site sharing” business concept (adapted from Ranjalkar, 2006, p. 6).
Operator A Operator B Independent Infrastructure Shared Infrastructure Operator A Operator B
Other Network Elements (Diesel generator, battery back-up, air-conditioning facilities, cable tray, common earthing facilities, lightening arrangement/arrestors, security and access management, and battery bank)
Telecom network facilities are categorized as passive or active. The distinction is rather important as only passive infrastructure is presently allowed to be shared in India. Active infrastructure includes electronic equipment as the radio base station, while passive infrastructure includes all other parts (see list above), and are commonly referred to as “dead” or “non-thinking”. It is technically possible to share active infrastructure, but the Indian regulators have for now decided on not allowing it, as will be discussed later. Active infrastructure sharing is a common phenomenon in other markets.
4.2 Why Shared Infrastructure?
It is predicted that sharing of passive infrastructure between multiple wireless service providers is a solution to almost all the major issues and challenges discussed in the previous chapter. The cost reductions incurred when sharing is predicted to lead to a faster development of wireless network coverage in the rural areas. The decreased need for towers will lead to a reduced space problem in the urban areas and improved esthetics. With a third party supplier of the service it is further believed that operators time to market will shorten, which in turn result in a faster growth of wireless services in India.
All identified benefits12 for the wireless service providers, society, and consumers are presented below.
12 Source is Gupta, 2006 if not otherwise stated.
Figure 4.2. One of the first Indian sites which have implemented the shared infrastructure concept.
Land Tower and feeds Antenna Shelter
Benefits for Telecom Operators13:
Decreases operators CAPEX (Capital expenditures) and allows an enhancement of coverage and penetration.
Reduces OPEX (operational expenditures) for operation and maintenance expenditures of passive infrastructure.
Facilitates Telecom Operators to meet the mandated coverage requirements in low density areas such as rural and suburban.
Reduce dropped calls (Ericsson, 2006).
Saves time to market by the provision of an existing, telecom ready facility.
Eliminate the need for Telecom Operators to manage non-core issues. Freeing of capital for core areas.
Less administrative hassles (DoT,2006) Benefits to the economy and society:
Efficient use of capital in the economy.
Reduce dropped calls (Ericsson, 2006).
De-clutter skylines and safer city environment.
Benefits to the Consumers:
Access to network all around country, since most likely not possible without sharing of infrastructure.
Reduce dropped calls (Ericsson, 2006).
4.3 Why not Before and why not More?
The primary reason why sharing of passive infrastructure has not been done sooner is believed to be because no one has thought of it before (Sharma, 2006). The development of the wireless network has been argued to initially have been slowed down from the political atmosphere in the country, and therefore taken off relatively late. Much has happened at such a speed recently that the solution has not occurred to anyone until now. The rivalry between the operators is another identified reason. The rivalry has made it difficult for cooperation between the operators on their own initiative.
Many of the issues discussed in the previous chapter, such as lack of space and increased cost of land in urban areas, has not until recently been a problem. The need to share has as a result been insufficient in the past.
The price sensitive market has pushed tariff prices down to such an extent that operators now face a need to change their business model to increase the revenue per subscriber. Even now when all the benefits have been identified implementation of shared infrastructure between the wireless service providers is not taking off at anticipated speed. The reason is clearly believed to be the need for a third party supplier to provide the market with a finished solution. The need of such a supplier implies a creation of a
whole new industry, much alike the one present in USA, Australia, and U.K. as will be discussed later. Some challenges of a “telecom site leasing” industry are presented below.
Capital intensive, who take on the assets on their balance sheet?
Financial funding difficulties to support the fast growth.
Cost effective solutions to attract Telecom Operators.
Sharing reluctance between operators.
4.4 Governmental Push
It lies in the government’s interest to increase teledensity across the country including the rural areas, as mentioned before. The government has therefore taken an initiative to start off a site leasing industry with a project called MOST. The idea of the Mobile Operators’ Shared Towers (MOST) project is to let a third party infrastructure provider set up sites, making them fully operational, and then lease them to several operators. In this way it is believed that both GSM and CDMA operators as private and public players, will be able to share infrastructure cost easier and to a wider extent than what is done presently. Four flagship sites included in the MOST project have at the present already been finished in the Delhi area. A total of ten pilot sites in Delhi have been planned to be build as a start of the MOST project. It has been agreed that for these particular sites a third party will set up and maintain the passive parts of the sites, while the operators will maintain their own equipment. The infrastructure that has been agreed to share is the entire above stated passive infrastructure list except the antennae, which could not be agreed to share. The four sites are presented below.
Delhi high court, two roof-top towers have been introduced in this location. The first tower is split between Airtel, Hutch, and IDEA. The second tower is split by MTNL, Reliance, and TATA.
Rajokri, one tower shared by Airtel, Hutch, IDEA, and TATA.
Dhansa, one tower shared by Airtel, Hutch, IDEA, MTNL, Reliance, and TATA. The government joint with other interest groups, such as TRAI and COAI, are currently pushing the same concept to the rural areas. TRAI has with its universal service objectives, as explained in the previous chapter, set up a fund (the USO fund) for the purpose of providing these areas with network. According to the minister of telecommunication it is planned to build 8,000 – 10,000 shared sites, with funding from the USO fund, which would roughly cover 85% of these areas (Raj, 2006). The minister of telecommunication has also stated that a detailed study is undertaken to decide in which villages in the remote areas the USO fund will be of most assistance. These sites will be subject to bidding with regard to who the third party owner is going to be. The bidding of these future planned sites are divided into two parts, one including the passive infrastructure and the other including non-sharable active infrastructure as the radio base station. Only licensed access service providers will be eligible to bid for both parts (DoT, 2006). The percentage the fund will cover of the site costs is not at the present decided on. It is expected that these sites are going to be ready for use in around 6-8 months (Sharma, 2006).
The MOST project is viewed as a first step toward deregulation of further shared infrastructure such as the active radio base stations (Sharma, 2006).
4.5 Infrastructure Sharing’s Impact on Goals
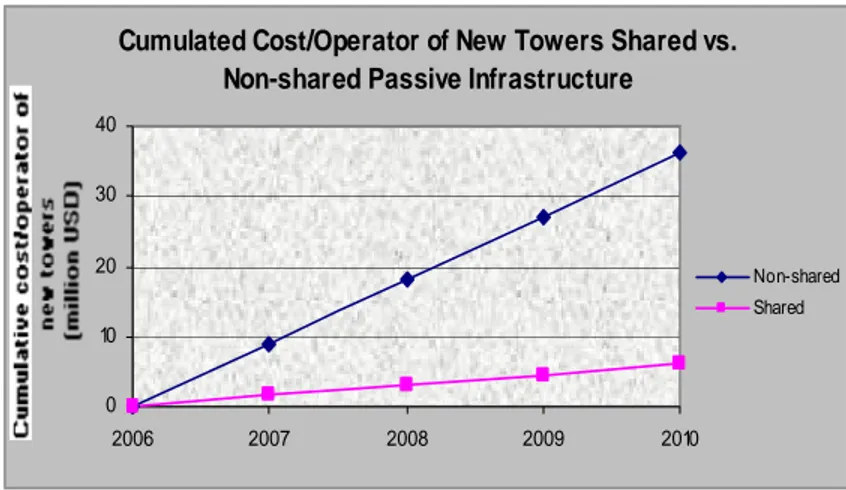
Presently, there exist around 70,000 towers reaching 105 million subscribers. The governmental goal to the end of 2007 is a total of 200 million subscribers. According to COAI 140,000 towers are needed to cover for that goal. By 2010 COAI estimates a 500 million subscription base which would equal to 350,000 towers. The cost to build a tower, only including passive parts, in the Delhi area is around 129 kUSD (cost/tower = Rs 6 million), as of August 18th 2006 rate (Financial Express, 2006). According to various estimations it is expected that substantially less towers are going to be needed to cover for the future goals, with the infrastructure sharing concept. The estimations can be seen in figure 4.3 and 4.4 below (for more in detail calculations, see appendix I).
The average shared tower will be more expensive than the average present operator-self-owned towers due to the need for stronger and bigger sites. It is believed that the new sites will incur a 20% higher initial total cost (Ericsson, 2006). Assuming an average of 2.514 operators per tower, the infrastructure cost reduction for every operator is estimated
to 48%, not including after services cost reductions such as maintenance. The goal of reaching 500 million subscribers in 2010 and increased network penetration in the rural areas will thus be easier achieved.
Cumulative nbr. of new Towers, Shared vs. Non-shared Passive Infrastructure
0 100 200 300 2006 2007 2008 2009 2010 Non-shared Shared
14 Average based on tower sharing market in US.
Figure4.3.Cumulative number of new towers needed to cover for the predicted subscriber growth if passive infrastructure is shared vs. non-shared.
Cumulated Cost/Operator of New Towers Shared vs. Non-shared Passive Infrastructure
0 10 20 30 40 2006 2007 2008 2009 2010 Non-shared Shared
The minister of telecommunication, Mr Dayanidhi Maran, claims that operators can decrease their tower cost with 50% with the new concept (Financial Express, 2006). Note that this corresponds well to the above calculations of a 48% decrease. Other goals as improving coverage, further reduction of tariffs for inhabitants with less buying power in the rural areas, and environmental and esthetic concerns are also expected to be fulfilled with the initiative from the MOST project (The Hindi Group, 2006). For these reasons, the government is now discussing with TRAI to look into the possibilities of a new policy, making sharing of infrastructure mandatory for operators (Techtree newsstaff, 2006).
4.6 Size of Market
If the Indian market would evolve toward the American market (see chapter 4.7.1) in terms of leasing revenues per tower it could reach an annual market size revenue of 2.2 billion15 USD by 2008. In 2010 the size would be around 4.5 billion USD. Of course the Indian market is not identical to the American and the differences may imply different expectations in terms of estimations of the market size. If 20% less of the American average revenue per tower can be achieved in India, the market would still come to around 1.7 billion USD in 2008 and 3.6 billion USD in 2010 annually (see table 4.1 and 4.2).
15 The number is based on a calculated average from American Tower, Crown Castle, and SBA’s respective
annual rental revenues per tower. The revenues and number of sites from the companies are extracted from their annual reports. The numbers only includes rental revenues and not site/network development services.
Figure 4.4.Cumulative cost/operator of new towers needed to cover for the predicted subscriber growth if passive infrastructure is shared vs. non-shared.
2008 Indian Tower Market Estimations
Cumulative nbr. of new shared towers 2008 (thousands) 47.6 Average annual revenue/tower (USD in thousands) 45.7 Size of Indian annual tower market (USD in billions) 2.2
Cumulative nbr. of new shared towers 2008 (thousands) 47.6 Average annual revenue/tower (USD in thousands) 45.7 Expected revenue diff. in percentage 20% Size of Indian annual tower market (USD in billions) 1.7
2010 Indian Tower Market Estimations
Cumulative nbr. of new shared towers 2010 (thousands) 98.0 Average annual revenue/tower (USD in thousands) 45.7 Size of Indian annual tower market (USD in billions) 4.5
Cumulative nbr. of new shared towers 2010 (thousands) 98.0 Average annual revenue/tower (USD in thousands) 45.7 Expected revenue diff. in percentage 20% Size of Indian annual tower market (USD in billions) 3.6
4.7 Shared Infrastructure in Other International Markets
Presently many markets around the world have implemented various shared infrastructure solutions. The purpose of the study is to give a general picture of both mature and developing telecom markets.
4.7.1 USA
In USA it is common for so called tower companies to rent out telecom sites. The basic business idea is to let operators lease space on sites of interest, where several other tenants can already be present, and earn a profit on the rent. Shared infrastructure most often includes the entire above stated passive infrastructure list, including the antennae more recently. The concept result in higher profits for the tower companies and reduced renting fees for the tenants the more tenants there are sharing a site. In this way, through a third party supplier, passive infrastructure sharing is common. The demand for such solutions is presently concentrated to urban areas, where the operators are in a need for higher network capacity.
Note that, the presently second largest tower company in USA, Crown Castle, has an average of about 2.3 tenants per site. On 348 towers there are more than 5 tenants (Crown Castle, 2006). Not all tenants are telecom operators, some can e.g. be radio and TV
Table 4.1. Annual revenue estimations of the 2008 Indian tower market, based on the American market.