Research
Uncertainty assessment of the SCANAIR
V_7_5 computer program in analyses of
BWR reactivity initiated accidents
2016:04
Author: Lars Olof JernkvistSSM:s perspektiv
Bakgrund
Beräkningsprogrammet SCANAIR har utvecklats av IRSN (Institut de
Radio-protection et de Sûreté Nucléaire) för att analysera reaktivitetshändelser
(RIA) i lättvattenreaktorer. I utbyte mot årliga bidrag till utvecklingen av
SCANAIR har SSM tillgång till beräkningsprogrammet och kan utföra egna
analyser av bränslebeteende under reaktivitetshändelser. Arbetet utförs av
Quantum Technologies AB, vilka utvecklar och administrerar
beräkning-sprogrammet på SSM:s uppdrag.
SSM:s utveckling av SCANAIR är främst inriktad mot de termohydrauliska
modellerna, i syfte att förbättra analysmöjligheterna i kokvattenreaktorer.
I ett tidigare arbete har en modell för tvåfasströmning utvecklats vilken
tagits in av IRSN i SCANAIR V_7_5. Föreliggande arbete är 2015 års bidrag
till SCANAIR-utvecklingen och är en osäkerhets- och känslighetsstudie
av grundläggande parametrar som beräknas av programmet. Studien är
baserad på ett japanskt pulsreaktorexperiment, FK-1, där en förbestrålad
bränslestav av typisk kokvattenreaktordesign utsätts för en reaktivitets-
transient
Resultat
Osäkerhets- och känslighetsstudien är utförd enligt en metodik som
används i en pågående benchmark mellan flera instituts beräkningsprogram
för RIA-analyser inom OECD/NEA. Föreliggande arbete visar på god
över-ensstämmelse mellan resultat erhållna med SCANAIR V_7_5 och testet FK-1.
Temperaturmaximum i bränsle och kapsling såsom den beräknas stämmer
väl överens med experimentella data. I modelleringen av det senare
förlop-pet, dvs. avklingningen av temperatur i bränslet genom värmeöverföring
till det omgivande vattnet, finns betydligt större osäkerheter. Detta beror
framför allt på att värmeöverföringen mellan kapsling och kylmedel är svår
att modellera vid kokning. Genom att kalibrera denna parameter mot det
aktuella experimentet fås god överensstämmelse mellan beräkningar och
experiment även för övriga parametrar i studien.
Ett resultat tillämpbart på tillsyn är att denna osäkerhets- och
känslighetss-tudie visar på generiska svagheter för beräkningsprogram som används
för analys av reaktivitetshändelser, i detta arbete diskuteras svagheterna
värmeöverföring och pulskarakteristik. I analyser för kärnkraftverk översätts
dessa svagheter till osäkerhetspåslag för relevanta parametrar vilka SSM
följer upp i granskningar av analyserna.
Behov av ytterligare forskning
Fortsatt arbete med utveckling av analysmöjligheterna i SCANAIR planeras
i samarbete med IRSN, till exempel med avseende på termohydraulik och
tvåfasströmning.
Projektinformation
Kontaktperson SSM: Anna Alvestav
Referens: SSM2014-5771
2016:04
Author: Lars Olof JernkvistQuantum Technologies AB, Uppsala Science Park
Uncertainty assessment of the SCANAIR
V_7_5 computer program in analyses of
BWR reactivity initiated accidents
This report concerns a study which has been conducted for the
Swedish Radiation Safety Authority, SSM. The conclusions and
view-points presented in the report are those of the author/authors and
do not necessarily coincide with those of the SSM.
Contents
Summary ... III
Sammanfattning ...IV
1 Introduction ... 1
2 The NSRR RIA simulation test FK-1 ... 5
2.1 Test fuel rod and test conditions ... 5
2.1.1 Design of the mother fuel rod ... 5
2.1.2 Irradiation of the mother rod in Fukushima Daiichi 3 ... 6
2.2 Instrumentation of the FK-1 test rodlet and pre-test examinations .... 6
2.3 Pulse reactor test and post-test examinations ... 9
3 Computer analyses ... 11
3.1 Methodology ... 11
3.2 Analyses of fuel pre-irradiation with FRAPCON ... 12
3.2.1 Description of the FRAPCON-3.2-SKI program ... 12
3.2.2 Models and input used for the analyses ... 12
3.3 Simulation of test rod refabrication with FRAPAIR ... 12
3.4 Analyses of pulse reactor test with SCANAIR ... 13
3.4.1 Description of SCANAIR V_7_5 ... 13
3.4.2 Models and input used for the analyses ... 13
3.4.3 Uncertainty and sensitivity analyses ... 14
4 Results and discussion ... 17
4.1 Analyses of fuel pre-irradiation ... 17
4.2 Analyses of pulse reactor test ... 18
4.2.1 Fuel pellet enthalpy and temperature ... 18
4.2.2 Cladding tube surface temperature ... 21
4.2.3 Internal gas pressure and fuel fission gas release ... 25
4.2.4 Axial elongation of fuel pellet column and cladding ... 28
4.2.5 Circumferential deformation of the cladding tube ... 29
4.2.6 Pellet-cladding gap width ... 30
4.2.7 Global sensitivity analysis ... 32
5 Conclusions ... 35
LIST OF APPENDICES
Appendix A: Input used in analyses of test rod pre-irradiation ... A.1
Appendix B: Input used in analyses of the FK-1 test ... B.1
Summary
In this work, we assess uncertainties that can be expected in computational analyses of boiling water reactor reactivity initiated accidents with the SCANAIR V_7_5 computer program. The work is intended to supplement a similar uncertainty assessment, focussed on pressurized water reactor accidents, which is currently being organized as an international benchmark exercise by the OECD Nuclear Energy Agency. Here, we apply the same methodology as in the international benchmark.
The uncertainty assessment is made by use of Monte Carlo simulations, using an experiment from the Japanese Nuclear Safety Research Reactor as a reference case. This test, FK-1, simulates the conditions expected in reactivity initiated accidents occurring under boiling water reactor cold zero power conditions. Totally seventeen uncertain parameters are considered in our uncertainty and sensitivity analyses with SCANAIR V_7_5: seven parameters are related to the pre-test conditions of the FK-1 test rodlet, three parameters define the test conditions, and seven parameters are related to key thermo-mechanical models in SCANAIR. Calculations are done with both the standard single-phase and the optional two-phase coolant channel model in SCANAIR V_7_5.
By use of order statistics applied to the results from the 200 runs of the Monte Carlo simulations, the 5th and 95th percentiles are calculated for key output parameters versus time. The results show that the modelling of clad-to-water heat transfer beyond cladding dry-out is a major source of uncertainty in the performed analyses. In case cladding dry-out occurs, the models for clad-to-coolant heat transfer have a large impact on the calculated results, not only for cladding temperature, but also for cladding deformations and fuel rod internal gas pressure. This finding is in line with results obtained from the aforementioned benchmark, and it is believed that the conclusion holds also for reactivity initiated accidents occurring under boiling water reactor cold zero power conditions.
Our calculations show that SCANAIR V_7_5 reproduces the behaviour of the FK-1 test rodlet fairly well, provided that clad-to-coolant heat transfer models for the post dry-out regimes are calibrated to the results of this particular test. Measured data for fuel pellet and cladding tube deformations generally fall within the uncertainty band defined by the calculated 5th and 95th percentiles from our uncertainty analyses. Data for the fuel rod internal gas pressure, however, fall outside the calculated uncertainty band during the early part of the test.
Sammanfattning
I detta arbete utvärderar vi vilka osäkerheter som kan förväntas i datorsimuleringar av reaktivitetsinducerade olyckor i kokvattenreaktorer med beräkningsprogrammet SCANAIR V_7_5. Arbetet syftar till att komplettera en liknande utvärdering, inriktad mot olyckor i tryckvattenreaktorer, som för närvarande organiseras i form av en internationell benchmark av OECD Nuclear Energy Agency. I föreliggande arbete tillämpas samma metodik som i nämnda benchmark.
Osäkerheterna utvärderas med hjälp av Monte Carlo-simuleringar, i vilka ett experiment från japanska Nuclear Safety Research Reactor används som referensfall. Detta prov, FK-1, efterliknar förhållanden som kan förväntas vid reaktivitetsinducerade olyckor i kokvattenreaktorer vid nollefekt och kall härd. Totalt beaktas sjutton osäkra parametrar i våra osäkerhets- och känslighetsanalyser med SCANAIR V_7_5: sju parametrar rör provstavens tillstånd före provet, tre parametrar beskriver provförhållandena, och sju parametrar är kopplade till väsentliga termo-mekaniska modeller i SCANAIR. Beräkningar genomförs med såväl den ordinära enfasmodellen som den alternativa tvåfasmodellen för kylkanalen i SCANAIR V_7_5.
Genom tillämpning av ordningsstatistik på resultaten från de 200 beräkningarna i Monte Carlo-simuleringarna, beräknas 5:e och 95:e percentilen för utvalda utdata-parametrar som funktion av tid. Resultaten visar att modelleringen av värme-överföring från kapsling till vatten efter torrkokning är en dominerande källa till osäkerhet i de utförda analyserna. I det fall torrkokning inträffar, har modellerna för värmeöverföring från kapsling till vatten stort inflytande på beräkningsresultaten. Detta gäller inte bara för beräknade kapslingstemperaturer, utan även för kapslings-deformationer och bränslestavens inre gastryck. Denna slutsats överensstämmer med resultaten från ovan nämnda benchmark, och den kan förväntas gälla även vid reaktivitetsinducerade olyckor i kokvattenreaktorer vid nollefekt och kall härd. Våra beräkningar visar att SCANAIR V_7_5 återger beteendet hos provstaven FK-1 relativt väl, förutsatt att modeller för värmeöverföring från kapsling till vatten efter torrkokning kalibreras mot resultat från just detta prov. Uppmätta deformationer för bränslekutsar och kapslingsrör faller överlag inom det beräknade osäkerhetsintervall som ges av den 5:e och 95:e percentilen från våra osäkerhetsanalyser. Mätdata för bränslestavens inre gastryck faller dock utanför det beräknade osäkerhetsintervallet under provets första del.
1
Introduction
A reactivity initiated accident (RIA) is a nuclear reactor accident that involves an unwanted increase in fission rate and reactor power. The power increase may damage the fuel and other components in the reactor core [1].
Operational limits are introduced for power generating nuclear reactors to preclude fuel failure, in case an RIA should occur. These limits are usually defined in terms of maximum permissible fuel enthalpy with respect to burnup, and they are in general based on direct rendition of failure/no-failure data from RIA simulation tests. Such tests are carried out in pulse reactors, for instance the French CABRI reactor [2] and the Japanese Nuclear Safety Research Reactor (NSRR) [3]. Direct rendition of failure/no-failure data from these reactors may, however, be misleading, since the tests are performed at conditions that are far from prototypical of light water reactors (LWRs). Computer programs are generally needed in order to correctly transform the results from pulse reactor tests to LWR conditions.
There are currently about a dozen computer programs that are used for thermo-mechanical fuel rod analyses of RIAs and interpretation of RIA simulation experiments performed in pulse reactors. An international benchmark for these computer programs was initiated in 2011 by the Working Group for Fuel Safety (WGFS) of the OECD Nuclear Energy Agency (NEA) Committee on the Safety of Nuclear Installations (CSNI). Phase I of this benchmark, which was concluded in 2013, revealed large differences between the computer programs used by the participating organisations [4]. Phase II of the benchmark, which is underway, is intended to elucidate modelling differences between the computer programs and also to assess the uncertainty in calculated results [5]. To meet the latter objective, uncertainty and sensitivity analyses are being performed with the computer programs, using probabilistic methods and a typical pressurized water reactor (PWR) RIA as a case study.
The work presented in this report is an uncertainty assessment of SCANAIR V_7_5, which is the latest version of one of the leading computer programs for analyses of the thermo-mechanical behaviour of LWR fuel rods under reactivity initiated accidents. SCANAIR is developed and maintained by Institut de Radioprotection et de Sûreté de Nucléaire (IRSN), France, and currently used by about a dozen organisations [6, 7]. The Swedish Radiation Safety Authority (SSM) belongs to this international user group. The work in this report supplements the uncertainty and sensitivity analyses that are being done within phase II of the international RIA fuel code benchmark. The applied methodology is the same, but while the international benchmark focusses on a typical PWR accident and fresh fuel, the present work focusses on an accident occurring under boiling water reactor (BWR) cold zero power conditions and high burnup fuel. More precisely, the NSRR FK-1 RIA simulation test is used as a reference case for the assessment. This test, which was
made on a high-burnup BWR fuel rodlet surrounded by stagnant water at room temperature and atmospheric pressure, is well suited for validation of computer programs. The test rodlet was extensively instrumented, and on-line in-reactor measurements of temperatures and deformations as functions of time were made during the test. The rodlet was also carefully characterised both before and after the test. The main results of the test were published in a scientific article already in February 2000 [8], and five years later, the full test reports and complementary material were made available to the public through the OECD International Fuel Performance Experiments (IFPE) database [9]. Most of the test data in the present report are extracted from the material compiled in the IFPE database. It should be remarked that the FK-1 RIA simulation test has been used by us in the past for assessing earlier versions of the SCANAIR computer program [10, 11].
The organisation of the report is as follows:
The NSRR pulse irradiation tests under study in this report, FK-1, is first presented in section 2. Details on the design of the test fuel rodlet, its pre-irradiation and instrumentation are given, followed by a description of the pulse test conditions in the NSRR. Section 3 deals with the applied computer programs, models and methods. The computational procedure, involving analyses of the steady-state pre-irradiation of the test rod with the FRAPCON-3.2-SKI program and simulations of the pulse reactor test with SCANAIR V_7_5, is described. Particular attention is given to the applied methodology for uncertainty and sensitivity analyses with SCANAIR.
Section 4 presents the results of the performed analyses. Calculated fuel rod conditions at end of pre-irradiation, such as cladding tube corrosion, fuel fission gas release and pellet-cladding gap conditions, are first presented in section 4.1. These calculated conditions serve as input to the analyses of the pulse reactor test, the results of which are presented in section 4.2. Throughout section 4.2, the calculated fuel rod conditions are compared with measured data, either recorded from the in-reactor instrumentation under the pulse test, or obtained from post-test examinations of the FK-1 test rodlet. The calculated results are discussed in light of these data, and possible reasons for discrepancies between calculated results and measurements are identified. The most important results are finally summarised in section 5, where general conclusions from the work are drawn.
Finally, it should be remarked that the fuel enthalpy, Hf, discussed throughout this
report is the (radial) average fuel specific enthalpy, defined by
∫
∫
= p p R f R f f f h rdr rdr H 0 0 ρ ρ , (1)where Rp is the fuel pellet radius, ρf is the fuel density, and hf is the local specific
enthalpy of the fuel material. The integrals in eq. (1) are evaluated at a specific axial position of the fuel pellet column; in this report at the peak power position of the test
As long as the fuel is in solid state, hf is simply calculated from the local fuel temperature, Tf, through
∫
= f o T T f f f T c T dT h ( ) ( ) , (2)where cf is the specific heat capacity of the solid fuel, and To is a reference
temperature at which hf = 0 by definition. In this report, we use To = 293.15 K,
which is the reference temperature used in SCANAIR V_7_5 [12]. It should be remarked that other values for To are used in different literature sources, usually
2
The NSRR RIA simulation test FK-1
The NSRR RIA simulation test FK-1, which is used as a reference case in this report, was carried out on a short-length fuel rodlet. The rodlet was sampled and refabricated from a full length fuel rod (henceforth called mother rod) that had been operated to high burnup in the Fukushima Daiichi unit 3 boiling water reactor, Japan. The data presented below are taken from [9, 13] unless otherwise stated.
2.1
Test fuel rod and test conditions
2.1.1 Design of the mother fuel rod
The FK-1 test rodlet was refabricated from a mother fuel rod of BWR 8x8BJ (Japanese Step I) design. Key properties of this design are summarised in Table 1. The cladding tube material is recrystallised Zircaloy-2 with a 90 micron thick liner of zirconium at the tube inner surface [8]. The mother rod was in fact not an ordinary full-length fuel rod, but a segmented experiment rod. The mother rod thus consisted of seven axial segments of equal length (510 mm), and the length of the fuel pellet stack in each segment was 360 mm.
Table 1: Specifications of the Japanese Step I fuel design [13]. TD denotes the UO2 fuel theoretical density (10 960 kgm
-3
). The Zircaloy-2 cladding material contains Zr-1.5Sn-0.1Fe-0.1Cr-0.06Ni by weight percent.
Segmented fuel rod design parameter
Fuel rod active length [ mm ] 360
Fuel rod pitch [ mm ] 16.1
Fuel rod fill gas He
Fill gas pressure at 294 K [ MPa ] 0.30
Cold free volume [ cm3 ] 6.3-6.7
Fuel material UO2
Enrichment of 235U [ wt% ] 3.4
Fuel pellet density [ %TD ] 95.0
Fuel pellet diameter [ mm ] 10.31
Fuel pellet height [ mm ] 10.30
Fuel grain size [ µm ] 10
Cladding tube material Zircaloy-2
Inner surface liner material Zr
Inner surface liner thickness [ µm ] 90 Cladding tube inner diameter [ mm ] 10.55 Cladding tube outer diameter [ mm ] 12.27
2.1.2 Irradiation of the mother rod in Fukushima Daiichi 3
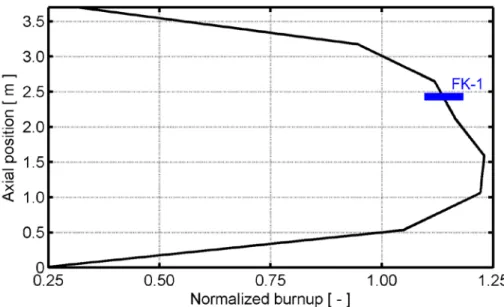
The segmented mother rod, denoted D7, belonged to fuel assembly F3GT3, which was irradiated for five reactor cycles in unit 3 of the Fukushima Daiichi nuclear power station, Japan. This was a commercial BWR of General Electric/Toshiba design, with a nominal electric power of 784 MW. The reactor was destroyed in the Tohoku earthquake and tsunami on March 11, 2011. The irradiation took place from 1984 to 1990, and resulted in an assembly average burnup of 39.4 MWd(kgU)-1. Figure 1 shows the base irradiation power history of the mother assembly, and Figure 2 details the end-of-life axial distribution of burnup in the assembly. The sampling position, i.e. the axial positions from which the fuelled part of the FK-1 test rodlet was taken, is indicated in Figure 2.2.2
Instrumentation of the FK-1 test rodlet and
pre-test examinations
The FK-1 test fuel rodlet was refabricated from the fifth axial segment of rod D7 in the F3GT3 fuel assembly. The sampling position for the test fuel rodlet is specified in Table 2, together with key properties of the rodlet. The sampling position is also indicated in Figure 2. The axial variation in fuel burnup along the FK-1 rodlet was less than 2 %.
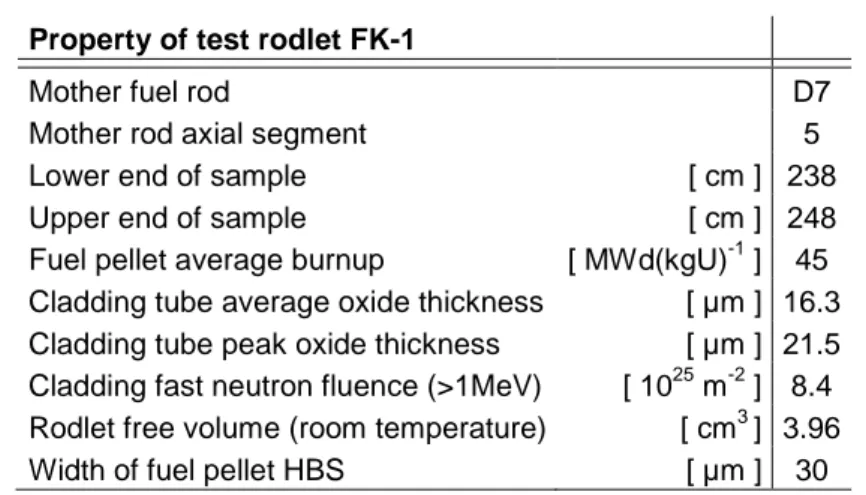
Table 2: Sampling position (from rod bottom) and specifications for test rodlet FK-1. Data are taken from [13]. HBS: High-burnup structure.
Property of test rodlet FK-1
Mother fuel rod D7
Mother rod axial segment 5
Lower end of sample [ cm ] 238
Upper end of sample [ cm ] 248
Fuel pellet average burnup [ MWd(kgU)-1 ] 45 Cladding tube average oxide thickness [ µm ] 16.3 Cladding tube peak oxide thickness [ µm ] 21.5 Cladding fast neutron fluence (>1MeV) [ 1025 m-2 ] 8.4 Rodlet free volume (room temperature) [ cm3 ] 3.96
Width of fuel pellet HBS [ µm ] 30
The refabrication was performed at the hot cells in the Reactor Fuel Examination Facility (RFEF) of the Japan Atomic Energy Agency (JAEA). Non-destructive and destructive examinations of the segmented mother rod and the refabricated test rodlet were also carried out in the RFEF, in order to examine the integrity of the
rodlet and to obtain information on the test rod conditions before the pulse reactor test.
Figure 1: Power history of fuel assembly F3GT3 in Fukushima Daiichi-3. The test rodlet FK-1 was refabricated from a segmented fuel rod in
this assembly. Data extracted from [14].
Figure 2: End-of-life axial distribution of burnup in fuel assembly F3GT3 after irradiation in Fukushima Daiichi-3. The sampling position
Before refabrication, the mother fuel rod segment was examined by: • Visual inspection
• X-ray radiography of fuel pellet column, to identify any stacking fault • Eddy current tests for cladding tube defects
• Dimensional measurements (cladding tube diameter and rod bending) • Cladding oxide thickness determination by eddy current measurements • Gamma scanning to determine axial distribution of fuel burnup
• Fission gas sampling (gas volume measurement and mass spectrometry)
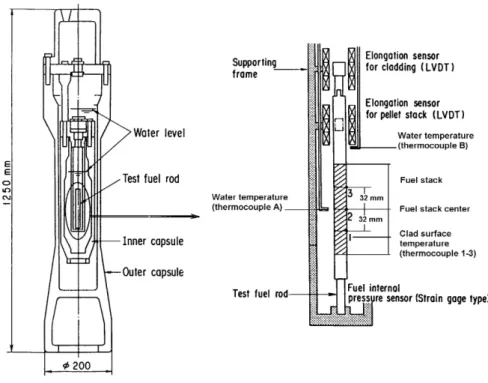
The FK-1 test rodlet was designed to contain 10 irradiated fuel pellets, which resulted in an active length of about 106 mm. Hafnium disks were placed at both ends of the fuel pellet column to prevent power peaking. The rodlet was sealed and filled with 0.3 MPa helium gas (at room temperature), corresponding to the as-fabricated filling conditions. A schematic drawing of the FK-1 test rodlet is given in Figure 3, where also the instrumentation is shown:
• Axial elongations of the fuel pellet column and cladding tube were measured by use of linear variable differential transformers (LVDT), which detected the axial movement of iron cores attached to the upper part of the pellet stack and the cladding tube, respectively.
• Rod internal gas pressure was measured by a pressure sensor, which was built into the bottom end fitting.
• Cladding tube outer surface temperatures were measured at three axial elevations by use of small diameter (∅=0.2 mm) thermocouples, which were spot-welded to the cladding. The positions of the thermocouples are defined in Figure 3. • Coolant temperature was measured by two thermocouples, which were mounted
at a distance of 10 mm from the cladding surface at the centre and top of the active part of the rodlet, respectively.
The above deformations, pressures and temperatures were thus measured continu-ously during the pulse test. Prior to the test in the NSRR, the FK-1 test rodlet was subjected to the following examinations:
• Helium leak test • Visual inspection
• X-ray radiography of the fuel pellet column, to identify any stacking faults • Eddy current tests for cladding tube defects
• Dimensional measurements (cladding tube diameter and rod bending) • Weight measurements
2.3
Pulse reactor test and post-test examinations
The NSRR is a modified TRIGA-ACPR (annular core pulse reactor), which is located in Tokai, Japan. A fairly large cavity is available in the centre of the core, where various test rigs can be accommodated. In the pulse test considered here, a double-wall test capsule is inserted in the cavity; see Figure 3. The inner capsule is a sealed pressure vessel, 120 mm in inner diameter and 680 mm in height. Within this capsule, the instrumented test rodlet is surrounded with stagnant water at atmospheric pressure and ambient temperature.
Figure 3: Design of the test capsule and the instrumented fuel rodlet, used in the NSRR pulse test FK-1. Drawing from [15].
The shape of the power pulse generated in the NSRR depends on the inserted reactivity: a larger reactivity insertion results in a higher, but also narrower, power pulse. The power pulse experienced by the fuel in the FK-1 test is shown in Figure 4. The origin of the horizontal (time) axis is the time of a “fire signal” for ejecting control rods from the NSRR core. The reactor power arose about 0.20 s after this signal. Full width at half maximum (FWHM) of the power pulse was 4.4 ms. The axial power profile along the short-length rodlet was nearly uniform in the FK-1 test; see Figure B.1 in appendix B.
In order to allow computational uncertainty and sensitivity analyses with regard to the amplitude and width of the power pulse, a simplified power pulse with triangular shape was used in the computer simulations of the FK-1 test. This power pulse is included in Figure 4 for comparison.
Figure 4: Power pulse in the NSRR test FK-1, according to [13]. The simplified triangular pulse used in our computer simulations of the test is included for comparison. The thick full line defines the triangular reference pulse, while the thin dashed lines define
the envelope of the variation imposed in uncertainty and sensitivity analyses; see section 3.4.3.
The FK-1 test rodlet was comprehensively examined after the pulse test. The examinations included rod diameter profile measurements, eddy current tests for cladding tube defects, and optical as well as secondary electron microscopy of fuel pellets and cladding. Moreover, the gas plenum of the test rodlet was punctured, and the total gas amount in the rodlet was determined from the volume and pressure of the sampled gas. The collected gas was also analysed with a mass spectrometer, to determine the gas composition and the isotopic ratios in krypton and xenon. The post-test visual inspections and eddy current tests showed that the FK-1 test rodlet survived the pulse test without failure of the cladding tube [13]. Moreover, the visual inspections did not reveal any significant changes to the rodlet due to the pulse test, except for slight bending and also some spalling of the waterside oxide layer. X-ray photographs of the rodlet showed some fragmented fuel pellets in the free spaces above the upper hafnium disk and below the lower one.
3
Computer analyses
3.1
Methodology
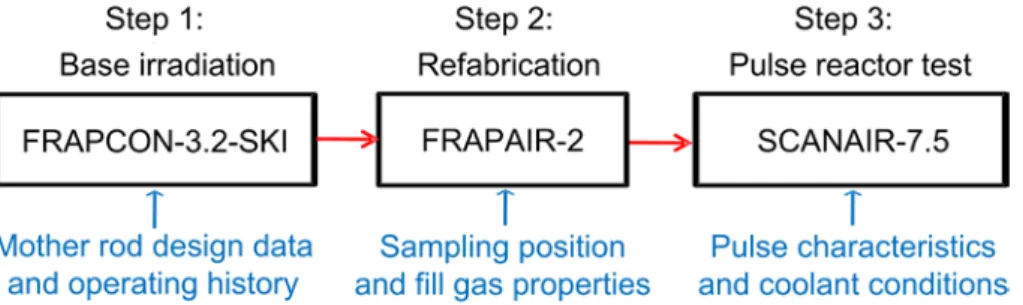
Computer analyses of the FK-1 test were carried out in three consecutive steps, using three different computer programs, as illustrated in Figure 5. In the first step, the operating history of the mother fuel rod in the Fukushima Daiichi-3 reactor was modelled by use of FRAPCON-3.2-SKI. This is the SKI/SSM-version of FRAPCON-3.2, a computer program designed for analysing long-term steady-state fuel rod operation [16, 17]. In the second step, calculated data defining the end-of-life conditions for a particular axial segment of the mother rod were extracted from FRAPCON output by use of the FRAPAIR-2 interface program [18]. These data, which define the burnup dependent pre-test conditions for the test fuel rodlet, were used as input to the final analysis step. This step involved modelling of the pulse reactor test by use of the SCANAIR V_7_5 computer program, henceforth referred to as SCANAIR-7.5 for simplicity [6, 12].
Figure 5: Procedure used in computer analyses.
Both FRAPCON and SCANAIR are best-estimate computational tools, and throughout the analyses, we strived to use the computer programs with their default best-estimate models. Moreover, we used only the mother rod design data and the specified operating conditions as input to the analyses. Hence, we deliberately refrained from tuning models in the computer programs and from using measured data from pre-test examinations as input to the third step of the analyses. The purpose of using this straightforward methodology was to assess the typical inaccuracy and uncertainty that can be expected from standard type analyses of fuel rod conditions during an RIA. By “standard type analyses”, we mean computer analyses carried out by a non-expert analyst, based merely on nominal data for the fuel rod design and the fuel operating history prior to the RIA.
In addition to the calculations with default best-estimate models, uncertainty and sensitivity analyses were carried out by use of a probabilistic input uncertainty propagation method. These analyses were restricted to the last step of the computer analyses, i.e. to the analyses performed with SCANAIR-7.5. The SCANAIR
program was in these analyses used together with the SCAVALID system for executing batch jobs and the SUNSET V_2_1 program for statistical analyses [19, 20]. The scope of the uncertainty and sensitivity analyses with SCANAIR and SUNSET is described in subsection 3.4.3 below.
3.2
Analyses of fuel pre-irradiation with FRAPCON
3.2.1 Description of the FRAPCON-3.2-SKI program
A specific SKI/SSM-version of the FRAPCON-3.2 steady-state fuel performance program was used to establish burnup-dependent initial conditions to the pulse test simulations. This version is henceforth named FRAPCON-3.2-SKI. In comparison with the standard version of FRAPCON-3.2 [16, 17], it has an interface to SCANAIR [18]. It should be remarked that this is the version of FRAPCON that was used by SKI/SSM in earlier computational assessments of fuel rod failure thresholds and core failure limits for RIAs in light water reactors [21, 22], and also in an assessment of an earlier version of SCANAIR [11].
3.2.2 Models and input used for the analyses
The irradiation of the mother fuel rod in Fukushima Daiich-3 was analysed by use of recommended (default) models and options in FRAPCON-3.2-SKI. The input used for the analyses consists of design data and operating conditions for the D7 mother fuel rod. Since the segmented geometry of the mother fuel rod could not be treated by FRAPCON, a full-length fuel rod was modelled. It should be pointed out that fission product gases, released from the fuel, were in the modelling free to flow between the axial segments of the modelled full-length fuel rod, in contrast to the segmented mother rod. In the segmented rod, each segment constituted a hermetically sealed pressure vessel. This may be important to the thermal feedback effect from released fission gases, and will be further discussed in section 4.1. The input used in the analyses of test rod pre-irradiation with FRAPCON-3.2-SKI is specified in appendix A.
3.3
Simulation of test rod refabrication with
FRAPAIR
As described in section 2.2, test rodlet FK-1 was sampled from the fifth axial segment of the mother fuel rod. In direct correspondence to the refabrication procedure for the test rodlet, calculated end-of-life fuel rod conditions, such as fuel pellet and cladding tube deformations, distributions of fuel plutonium and gaseous fission products, cladding tube hydrogen content etc, were extracted from FRAPCON output for the fifth axial segment of the analysed fuel rod by use of the FRAPAIR-2 interface program [18]. These data defined the initial conditions for
fuel and cladding, which were needed for analysing the FK-1 pulse reactor test with SCANAIR.
Here, ist should be remarked that FRAPCON and SCANAIR have very different models for fuel pellet cracking and for deformation of the cracked fuel material. To achieve the same pre-test pellet-cladding gap width in calculations with the two programs, it was assumed that 85 % of the fuel pellet radial relocation, calculated with FRAPCON-3.2-SKI, was irreversible, when fuel pellet geometry data were transferred from FRAPCON to SCANAIR via FRAPAIR-2. This value has been determined by comparing pre-test steady-state gap widths (or pellet-clad contact pressures), calculated with FRAPCON-3.2-SKI and SCANAIR, respectively, for a large number of fuel rods. The same value was earlier used in assessments of fuel rod failure thresholds and core failure limits for RIA [21, 22], and also in an assessment of an earlier version of SCANAIR [11].
3.4
Analyses of pulse reactor test with SCANAIR
3.4.1 Description of SCANAIR V_7_5
The SCANAIR program is developed and maintained by Institut de Radioprotection et de Sûreté de Nucléaire (IRSN), France. It is designed specifically to model the thermo-mechanical behaviour of light water reactor fuel rods under reactivity initiated accidents. SCANAIR-7.5 was released in January 2015 and is the latest version of the program [6, 7, 12].
Of specific interest to the analyses presented here are the two coolant channel models that are available in SCANAIR-7.5: In addition to the old single-phase (liquid) coolant model, which is intended for PWR applications, SCANAIR-7.5 has also been equipped with a simple two-phase (water+steam) model. The latter model is intended for both PWR and BWR applications, and has been developed as an in-kind contribution to SCANAIR by Quantum Technologies under contract with SSM [23]. Both coolant channel models are applied in the analyses presented here, and comparisons are made between the models.
3.4.2 Models and input used for the analyses
The input used for the analyses with SCANAIR-7.5 consists of three parts: i) data on the burnup-dependent initial state of the test rodlet, ii) definitions of the power pulse shape, axial power distribution and reactor coolant conditions for the test, iii) selections of appropriate models and options. The first part of the input is defined by the end-of-life conditions for the corresponding axial segment of the mother fuel rod, as calculated with FRAPCON-3.2-SKI. The second and third parts of the SCANAIR input are described in appendices B and C.
3.4.3 Uncertainty and sensitivity analyses
As already mentioned in section 3.1, the computer analyses were carried out using default best-estimate models in the FRAPCON-3.2-SKI and the SCANAIR-7.5 computer programs. The best-estimate analyses were supplemented by uncertainty and sensitivity analyses, in which Monte Carlo simulations with SCANAIR-7.5 were used to propagate uncertainties in key input parameters and model parameters to the output of the program. The applied methodology was identical to the one used in phase II of the international RIA fuel code benchmark, organised by the Working Group for Fuel Safety of the OECD Nuclear Energy Agency Committee on the Safety of Nuclear Installations. This methodology, which is fully described in [5], consists of the following five steps:
Step 1: Identification of relevant output parameters and the most important
uncertainty sources that may affect these parameters. Here, the most important uncertainty sources are assumed to comprise uncertain input parameters to SCANAIR-7.5 as well as key model parameters in the program; see Table 3. The considered parameters were selected based on results from phase II of the international RIA fuel code benchmark and similar work performed elsewhere [5, 24]. The output parameters of primary interest are the peak fuel enthalpy reached during the transient, the peak temperatures of the fuel pellet and the cladding tube, the cladding peak deformations and strains, and the transient fission gas release from the fuel.
Step 2: Quantification of the uncertainty for each identified uncertainty parameter.
This is done by defining a probability density function for each parameter, based on statistical data from quality assurance surveillance in fuel manufacturing, experience from computer code validation against tests and experiments, and engineering judgement. Here, we assume for simplicity that all uncertainty parameters are normally distributed. Moreover, each probability density function is truncated at µ ± 2σ, where µ is the mean value and σ is the standard deviation for the parameter; see Table 3. These assumptions were made also in phase II of the international RIA fuel code benchmark, and the standard deviations used in the present analyses are in most cases identical or very similar to those used in the benchmark [5].
Step 3: Propagation of the uncertainties from all quantified uncertainty sources to
the output of the computer program. This step involves Monte Carlo simulations with SCANAIR-7.5, which means that the program is run repeatedly, using different values for each of the uncertain parameters in each run. The value for each of the uncertain parameters is drawn from its probability distribution, using simple random sampling. In this way, values for each uncertain parameter are sampled simul-taneously in each repetition of the Monte Carlo simulation. In conformity with phase II of the international RIA fuel code benchmark, we use 200 repetitions in the Monte Carlo simulations.
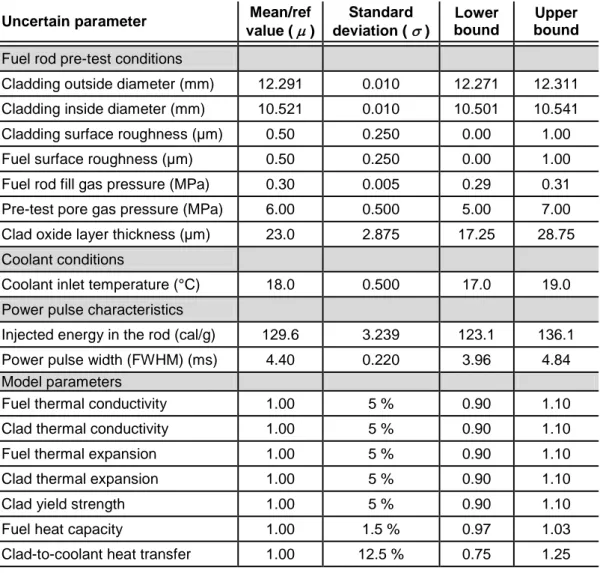
Table 3: Uncertain input parameters and model parameters considered in uncertainty and sensitivity analyses with SCANAIR-7.5. All parameters are
assumed to be normally distributed. Model parameters are scaled with a multiplier, the variation of which is defined in the table.
Uncertain parameter Mean/ref value ( µ ) Standard deviation ( σ ) Lower bound Upper bound
Fuel rod pre-test conditions
Cladding outside diameter (mm) 12.291 0.010 12.271 12.311
Cladding inside diameter (mm) 10.521 0.010 10.501 10.541
Cladding surface roughness (µm) 0.50 0.250 0.00 1.00
Fuel surface roughness (µm) 0.50 0.250 0.00 1.00
Fuel rod fill gas pressure (MPa) 0.30 0.005 0.29 0.31
Pre-test pore gas pressure (MPa) 6.00 0.500 5.00 7.00
Clad oxide layer thickness (µm) 23.0 2.875 17.25 28.75
Coolant conditions
Coolant inlet temperature (°C) 18.0 0.500 17.0 19.0
Power pulse characteristics
Injected energy in the rod (cal/g) 129.6 3.239 123.1 136.1
Power pulse width (FWHM) (ms) 4.40 0.220 3.96 4.84
Model parameters
Fuel thermal conductivity 1.00 5 % 0.90 1.10
Clad thermal conductivity 1.00 5 % 0.90 1.10
Fuel thermal expansion 1.00 5 % 0.90 1.10
Clad thermal expansion 1.00 5 % 0.90 1.10
Clad yield strength 1.00 5 % 0.90 1.10
Fuel heat capacity 1.00 1.5 % 0.97 1.03
Clad-to-coolant heat transfer 1.00 12.5 % 0.75 1.25
Step 4: Statistical analyses of the calculated results. The Monte Carlo simulations
lead to a sample size of 200 for each output parameter. This output sample can be used to get any statistical measure, such as the mean value or the cumulative distribution function for the output parameter. Here, we apply the same metho-dology as in phase II of the international RIA fuel code benchmark and use order statistics to determine percentiles for the distribution of each output parameter. More precisely, we determine the 5th and 95th percentiles with a confidence level of 95 % from the 5th and 196th order statistics of the 200 samples for each output
parameter.1 The reader is referred to [20, 25, 26] for a theoretical background to the applied procedure.
Step 5: Global sensitivity analysis. To identify the most influential uncertainties
with regard to key output parameters, the results from the 200 runs with SCANAIR-7.5 are finally used for calculating correlation coefficients between the output parameters and all uncertain parameters. Here, the key output parameters considered in calculations of the correlation coefficients are:
• Peak fuel pellet enthalpy, H (radial average value) f
• Peak fuel pellet temperature, Tf (local)
• Peak cladding outer surface temperature, Tco (oxide outer surface) • Peak cladding hoop plastic strain, p
θθ
ε (metal outer surface) • Fuel fission gas release, FGR (during entire transient)
For each of the output parameters listed above, the computed correlation coefficients provide sensitivity measures for the considered uncertainty parameters in Table 3 across the entire parameter space. Possible sensitivty measures of this kind are linear (Pearson) correlation coefficients, linear partial correlation coefficients, rank (Spearman) correlation coefficients, rank partial correlation coefficients and Sobol indices [27-30]. Work carried out in phase II of the international RIA fuel code benchmark has shown that the rank partial correlation coefficients provide a reasonable balance between performance and computational cost for the type of analysis considered here, and these correlation coefficients are therefore used in the work presented here.
1 The 5th and 95th percentiles with 95 % confidence level are thus defined by the
5th and 196th elements of an array, whose elements consist of the 200 calculated
4
Results and discussion
4.1
Analyses of fuel pre-irradiation
Key results from the simulated pre-irradiation of the FK-1 test fuel rodlet are sum-marised in Table 4. For comparison, measured data from pre-test examinations of the test rodlet are included in the table.
Table 4: Calculated fuel rod properties at end of pre-irradiation in Fukushima Daiichi-3. Measured data are given for comparison; see Table 2. The gap is
evaluated at zero rod power, room temperature and a coolant pressure of 0.1 MPa. Consequently, it represents the pre-pulse gap width in the NSRR.
Property Calculated Measured
Fuel pellet average burnup [ MWd(kgU)-1 ] 45.3 45
Pre-test fission gas release [ % ] 0.85 1.5
Cladding average oxide thickness [ µm ] 23.1 16.3
Cladding hydrogen concentration [ wppm ] 245 -
Pellet-cladding radial gap width [ µm ] 34.8 -
The calculated fuel fission gas release and cladding tube corrosion at end of pre-irradiation are in fair agreement with measurements. These properties were calculated with the default models in FRAPCON-3.2-SKI, which thus seem to be fairly accurate. The calculated gas release is due to both thermal and athermal processes. It is interesting to note that the fission gas release is somewhat underestimated. This can possibly be explained by the fact that local effects of thermal feedback from the fission gas release were not accurately accounted for in the calculations: In the analyses with FRAPCON, released fission gases were free to flow between the axial segments and the top plenum of the modelled full-length fuel rod, which means that the concentration of low-conductivity fission gases, e.g. Xe and Kr, was assumed to be uniform along the rod. In reality, each segment of the mother rod D7 constituted a hermetically sealed pressure vessel, and released fission gas therefore remained in the axial segment, into which it was released. Consequently, we expect the calculated degradation of the gap thermal conductance, the pellet temperature and the fission gas release to be slightly underestimated in high-power segments with high fission gas release, and overestimated in low-power segments with low fission gas release. This hypothesis is supported by the results put forth in Table 4.
4.2
Analyses of pulse reactor test
4.2.1 Fuel pellet enthalpy and temperature
Table 5shows the peak values of fuel enthalpy, Hf, and temperature, Tf. calculated
with nominal input values and model parameters in SCANAIR-7.5. The results refer to the peak power axial position of the FK-1 test rodlet. The peak fuel enthalpy in Table 5 is defined as the fuel pellet radial average value, calculated with respect to a reference temperature of 293 K; see eqs. (1) and (2) in section 1. For comparison, the peak enthalpy reported by the staff at the NSRR is 130 cal/g [13]. The calculated times at which the peak fuel enthalpy and peak fuel temperature are reached are also indicated in Table 5. The peaks are reached 4.3 and 4.1 ms after peak power, which means that the time lag is comparable to the width of the power pulse.
The peak fuel temperature in Table 5 is the local maximum temperature. According to the calculations, this maximum is obtained at a distance of about 0.1 mm from the fuel pellet surface for the considered test. We note that the UO2 melting point
(solidus temperature) is typically 2800 °C for the fuel burnup considered here [22]. The calculated peak fuel temperature thus suggests that there is a considerable margin to fuel melting in the FK-1 RIA simulation test.
Table 5: Calculated peak fuel enthalpy and temperature under the FK-1 pulse test, using nominal input parameter values and
model parameters in SCANAIR-7.5
Property
Peak linear heat generation rate [ MWm-1 ] 107.2 Time at which peak power is reached [ s ] 0.2050
Pulse width (FWHM) [ ms ] 4.4
Calculated peak radial average
[ calg-1 ] 129.3 fuel pellet enthalpy, Hf
Calculated time lag between peak
[ ms ] 4.3 power and peak fuel enthalpy
Calculated peak fuel temperature, Tf [ °C ] 2389
Calculated time lag between peak
[ ms ] 4.1 power and peak fuel temperature
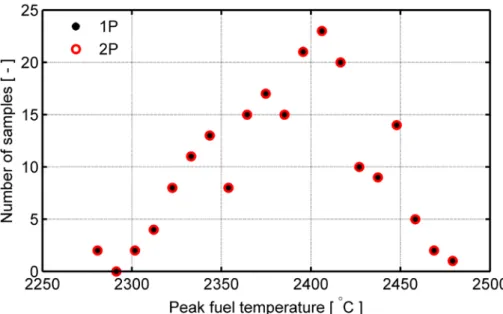
It should be remarked that the calculated results in Table 5 are unaffected by the choice of coolant channel model in SCANAIR-7.5. This is because the calculated peak fuel enthalpy and temperature are reached before any significant heat transfer across the clad-to-coolant interface takes place. Figure 6 and Figure 7 show the distribution of peak fuel enthalpy and peak fuel temperature, calculated by Monte Carlo simulations of the test with SCANAIR-7.5. As shown in the figures, the results calculated with the single-phase (1P) and two-phase (2P) coolant channel
models are identical. The calculated variation in peak fuel enthalpy is about ±7 cal/g, which is comparable to the postulated variation in injected energy; see Table 3. The variation of the calculated peak fuel temperature is about ±100 °C.
Figure 6: Distribution of peak fuel enthalpy, calculated by Monte Carlo simulations with SCANAIR-7.5. 1P: Single-phase coolant model.
2P: Two-phase coolant model.
Figure 7: Distribution of peak fuel temperature, calculated by Monte Carlo simulations with SCANAIR-7.5. 1P: Single-phase coolant model.
2P: Two-phase coolant model.
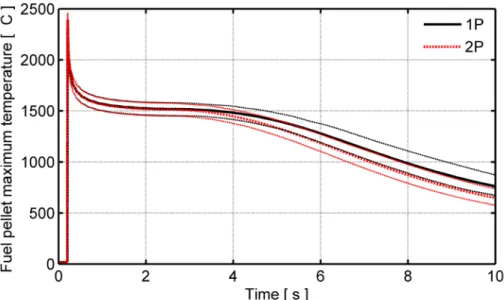
Figure 8 shows the calculated evolution of radial average fuel enthalpy at the peak power axial position, while Figure 9 shows the calculated local maximum of fuel temperature versus time. Results are shown for both the single-phase and the
two-phase coolant channel model, and in addition to the best-estimate results, the calculated 5th and 95th percentiles are included in the figures. Differences between the calculated results from the single-phase and the two-phase models are obvious beyond about 0.5 s for the fuel enthalpy, and beyond about 3 s for the fuel maximum temperature. For the fuel enthalpy, the largest differences are found for 2 < t < 4 s, which is a period characterized by large uncertainties for the calculated clad-to-coolant heat transfer; see section 4.2.2.
Figure 8: Calculated evolution of fuel pellet radial average enthalpy at the peak power axial position. Thick lines are best-estimate results; thin
dashed lines represent the 5th and 95th percentiles.
Figure 9: Calculated evolution of fuel pellet maximum temperature (local value with regard to radial and axial position). Thick lines are best-estimate
4.2.2 Cladding tube surface temperature
Clad-to-coolant heat transfer is in SCANAIR-7.5 calculated on the assumption that the fuel rod is concentrically placed within a vertical cylinder, in which a forced coolant flow is injected from below. This coolant channel model does not really fit the cooling conditions in the NSRR. Firstly, as shown in Figure 3, the coolant is contained in a double-wall capsule, the geometry of which is more complex than a cylinder. Secondly, the NSRR tests are made in stagnant water, which means that clad-to-water heat transfer takes place by natural rather than forced convection. Consequently, we cannot expect SCANAIR-7.5 to accurately calculate the clad-to-coolant heat transfer in the FK-1 pulse test, and the approximations made for the cooling conditions in the present analyses are detailed in appendix B.
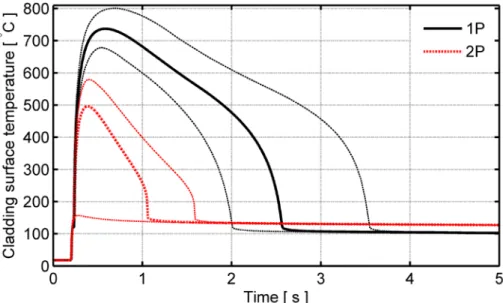
The calculated temperature evolution for the cladding tube outer surface (oxide-water interface) is shown in Figure 10. The calculated temperature pertains to the peak power axial position (centre of fuelled section) of the test rodlet, and results are shown for both coolant channel models used with SCANAIR-7.5. The calculations result in a phase with film boiling and high cladding temperature, irrespective of which coolant channel model is used. However, the calculated duration of the film boiling phase is much shorter with the two-phase model, and the calculated peak cladding temperature is about 250 °C lower than with the single-phase model. Also, the 5th percentile results obtained with the two-phase coolant model clearly show that no film boiling is predicted to occur for this case, and that the cladding surface temperature remains below 160 °C. In contrast, the single-phase model predicts film boiling and cladding temperatures above 670 °C also for the 5th percentile case.
Figure 10: Calculated temperature for the cladding tube outer surface of the FK-1 test rodlet. Thick lines are best-estimate results; thin dashed
Figure 11 shows a comparison of cladding surface temperatures calculated with the two-phase coolant channel model in SCANAIR-7.5 with measured data. The measurements were made with three small-size thermocouples, which were spot-welded to the cladding tube surface at three different axial positions along the active length of the rodlet; see Figure 3. Obviously, there are large differences in measured surface temperature among these thermocouples. The highest temperature is recor-ded by the centre thermocouple, and the uppermost thermocouple failed at t = 1 s.
Figure 11: Calculated and measured temperature of the cladding tube outer surface. Temperatures calculated with the two-phase (2P) coolant channel
model refer to the peak power axial position of the test rodlet, whereas the measured data are from thermocouples 1, 2, and 3; see Figure 3.
Several RIA simulation tests in the NSRR have shown that there are random variations of significant amplitude for the cladding surface temperature, clearly suggesting local dry-out of the cladding. This conclusion is corroborated by post-test measurements of Vickers hardness for the cladding, which revealed local softening of the cladding material for the FK-1 rodlet. The softening indicates that the cladding had reached temperatures well above 600 °C in some regions [13]. In fact, also at the same axial elevation in the rodlet, there were large variations in Vickers hardness along the cladding tube circumference. This suggests that the cladding tube temperature fluctuated considerably in both the axial and circumferential direction under the FK-1 test.
Considering the large differences in measured cladding surface temperature among the three thermocouples attached to the FK-1 test rodlet, we conclude that the two-phase coolant channel model in SCANAIR-7.5 reproduces the cladding surface temperature with reasonable accuracy; see Figure 11. The duration of the film boiling phase is accurately captured, but the cladding temperature is overestimated. In particular, the calculated cladding surface temperature remains at about 130 °C after re-wetting of the cladding, which clearly disagrees with the measured data. It is
also interesting to note that no film boiling occurs for the calculated 5th percentile case in Figure 11, which suggests that the calculated occurrence of cladding dry-out and film boiling is sensitive to variations in input and model parameters.
Separate effect tests have revealed that there are significant kinetic effects involved in the clad-to-water heat transfer under fast power transients, and the boiling crisis under RIA therefore differs from that under quasi-stationary conditions [31-33]. More precisely, the critical heat flux, i.e. the threshold heat flux at which a boiling crisis occurs, is significantly higher under fast transients than under stationary conditions, and the film boiling heat transfer is also different. Although little is known about the nature of boiling crises under RIA conditions typical for light water reactors, the data at hand from pulse reactor tests and separate effect tests indicate that the energy deposition to the fuel, the coolant subcooling, the pellet-cladding gap size and the cladding oxide layer thickness and surface properties decide whether a boiling crisis will occur or not [31, 33-35].
Significant energy depositions are needed for a boiling crisis to occur at high initial subcooling, whereas lower energies are needed when the water is close to saturation. The pellet-cladding gap size is also known to affect the threshold energy deposition; a narrow or closed gap promotes the boiling crisis [36]. Likewise, the boiling crisis seems to cause higher cladding temperatures for fuel rods with a thin or spalled cladding tube oxide layer than for rods with thick and uniform oxide [37]. The positive effects of the cladding oxide layer on clad-to-coolant heat transfer under RIA are attributed to an increase of surface wettability. In conclusion, film boiling and high cladding temperatures are more likely for LWR RIAs that initiate from hot operating conditions, and particularly for fuel rods with a closed pellet-cladding gap and thin or spalled oxide.
Many pulse irradiation tests in the NSRR have been carried out on fuel rodlets with 2-3 thermocouples spot-welded to the cladding surface, and on-line measurements of the cladding outer surface temperature are available for these tests. Figure 12 summarises peak cladding surface temperatures, recorded in NSRR tests on fresh and pre-irradiated fuel rods. All tests were done with the room temperature test capsule, and with near-zero initial rod power and enthalpy. The data shown in Figure 12 are taken from [1] and references therein.
The measured data in Figure 12 illustrate the aforementioned influence of pellet-cladding gap width on the enthalpy threshold for boiling crisis. Due to differences in burnup, coolant overpressure and rate of cladding creep-down, fuel rods pre-irradiated in the Japanese Material Test Reactor (JMTR) have the widest pellet-clad gaps, whereas rods pre-irradiated in pressurised water reactors (PWRs) have the narrowest gaps; the pre-irradiated BWR and advanced thermal reactor (ATR) rods fall in between. It is clear from Figure 12 that the boiling crisis occurs at significantly higher fuel enthalpies for the JMTR rods than for the PWR and BWR rods.
Figure 12: Peak cladding surface temperature, measured by thermocouples under RIA simulation tests in the NSRR. The coolant is stagnant water
at room temperature and atmospheric pressure [1].
It is also clear from Figure 12 that fresh fuel rods behave differently from pre-irradiated rods. The enthalpy threshold at which a boiling crisis occurs is more distinct, and the peak cladding surface temperature under film boiling is generally higher than for pre-irradiated fuel. These differences have been studied in depth by conducting pulse-irradiation tests on fresh fuel rods with pre-oxidised cladding in the NSRR [37]. The tests have shown that zirconium oxide has a better wettability than bare metal, which is believed to be the principal explanation to the lower cladding temperatures of pre-irradiated fuel rods [33]. The low thermal conductivity oxide also acts as an insulating layer on the hot high conductivity cladding metal, which reduces the rate of the surface temperature excursion. Other possible contributions to the observed differences in transient thermal behaviour between fresh and pre-irradiated rods are discussed in [8].
If a boiling crisis occurs, experiments show that the peak cladding temperature is correlated to the energy deposition, and the same is true for the duration of the film-boiling phase. A film-film-boiling phase with high cladding temperature for 2-15 seconds is reported from the RIA simulation tests on instrumented rodlets in the NSRR [36, 38, 39]. The peak cladding temperature and the time at high temperature decrease with increasing coolant flow rate and subcooling.
Finally, it should be remarked that the in-reactor surface temperature measurements on pre-irradiated fuel rods in the NSRR suggest that film boiling under RIA is a local phenomenon. Measured temperatures often differ by several hundreds of kelvin between thermocouples, although their spacing is just a few centimetres. Post-test measurements of Vickers hardness for the cladding also bear witness to large axial and circumferential variations in peak cladding temperature during the transient [8]: since softening of irradiated cladding by annealing of radiation damage
occurs in about 10-15 s at temperatures above 600 °C [40], it is possible to determine whether a boiling crisis has occurred during the test by detecting changes in Vickers hardness.
4.2.3 Internal gas pressure and fuel fission gas release
The fuel rod internal gas pressure is plotted versus time in Figure 13. Results calculated with both the single-phase and the two-phase coolant channel model are shown, and the calculated results are compared with measured data from the pressure sensor in the bottom part of the test rodlet; see Figure 3. At t ≈ 2 s, the measured rod internal gas pressure reaches its maximum value, which is 1.85 MPa. The gas pressures calculated with best-estimate assumptions at this point in time are lower, irrespective of the coolant channel model used. Throughout the transient, the two-phase coolant model gives lower internal gas pressure than the single-phase model; this is a consequence of lower calculated pellet-cladding gap gas temperatures. We note that the calculated uncertainty bands for the rod internal gas pressure are wide during the early part of the transient, when the occurrence of film boiling and high cladding temperatures is possible. For t > 5 s, however, the typical uncertainty is no more than ±0.1 MPa.
Figure 13: Calculated and measured evolution of gas pressure within the test rodlet. Thick lines are best-estimate results; thin dashed lines
represent the 5th and 95th percentiles.
It is clear from Figure 13 that there are large differences between the calculated and measured evolutions of rod internal gas pressure during the early part of the transient. These differences have several possible explanations. Firstly, in the calcu-lations with SCANAIR-7.5, we used the default model (‘model1’; see appendix C) for calculating fuel fission gas release and rod internal gas pressure. With this model, the rod internal gas pressure is calculated from the equation of state for an
ideal gas, on the assumption that the pressure is uniform within the fuel rod. From this assumption, it follows that the gas pressure, Pg, can be written as
∑
= i i i g T V R n P , (3)where n [mol] is the total amount of gas within the rod free volume, R is the universal gas constant, and Vi and Ti are the volume and absolute temperature of the
gas within the i:th partial free volume of the fuel rod. In our analyses, these partial volumes are the pellet-cladding gap in each of the 11 computational axial segments, and the rod upper plenum. The gap gas temperature is in SCANAIR-7.5 calculated from the arithmetic average of the pellet and cladding surface temperatures, and the plenum gas temperature is in our analyses set equal to the gap gas temperature in the uppermost axial segment of the fuel rod; see appendix C.
The assumption of a uniform internal gas pressure may be incorrect, since the axial flow of gas is hindered by complete closure of the pellet-cladding gap; see section 4.2.6. Hence, eq. (3) may not apply. A more advanced model, allowing for radial and axial pressure gradients within the fuel rod, is available in SCANAIR-7.5. This model was not used in our analyses, since it requires input data that are poorly known.
Secondly, fuel rod temperatures and deformations, which are used for evaluating eq. (3), may be inaccurate or applied in a simplistic manner. For example, the tempera-ture of the upper plenum gas is in our calculations assumed to be equal to the gas temperature in the pellet-cladding gap at the uppermost part of the fuel pellet column. This approximation makes the calculated plenum gas temperature (and pressure) react unrealistically fast to changes in cladding tube temperature, as evidenced by the calculated results in Figure 13. As shown in Figure 3, the gas plenum contains an iron core for the elongation sensor. The thermal inertia (heat capacity) of the iron core is not considered in the calculations, nor is the effect of gamma heating of the core on the surrounding gas temperature.
Thirdly, the kinetics of the transient fission gas release may not be accurately reproduced by SCANAIR-7.5. In the applied default model for fuel fission gas release in SCANAIR-7.5, it is assumed that the release takes place in several steps, and that the process is rate-controlled by the last step, which involves flow of gas through open (interlinked) pores in the fuel material towards the fuel rod free volume [6]. More precisely, the radial velocity of gas, vr, in the porosity network is
calculated from Darcy’s law
r P
vr = −χ∂ p ∂ , (4)
where Pp is the pore gas pressure and χ is the permeability of the porous fuel
material. The boundary condition to eq. (4) is that Pp should be equal to the rod
internal gas pressure at the pellet (outer) surface, and for hollow pellets, also at the inner surface. Hence, fission product gas is released to the rod internal free volume χ. In the analyses, we used
χ = 5×10-14 m(sPa)-1, which is the default value for SCANAIR-7.5 [12]. It is known
from earlier work [11] that the value used for χ has a notable effect on the calculated fission gas release kinetics, especially during the early part of the transient. We also note that the model is based on the assumption that a radial gradient in pore gas pressure exists across the entire fuel pellet. This assumption seems unrealistic, considering the typical network of cracks found in ceramic fuels.
An important input parameter to the aforementioned fission gas release model is the initial (pre-test) value for the pore gas pressure Pp. As shown in Table 3, we treated Pp as an uncertain parameter in the analyses with SCANAIR-7.5. The nominal value
for Pp (6.0 MPa at room temperature) was selected such that the post-test fission gas
release, calculated with best estimate assumptions, matched the measured result from the post-test examinations. These results are summarized in Table 6.
The calculated uncertainty for the transient fission gas release during the FK-1 RIA simulation test is shown in Figure 14. The calculated release fractions range from about 6.4 to 8.8 %. The single-phase coolant channel model tends to give somewhat higher release fractions than the two-phase model, because of the higher fuel temperatures calculated with the former model.
Figure 14: Distribution of transient fission gas release, calculated by Monte Carlo simulations with SCANAIR-7.5. 1P: Single-phase coolant
model. 2P: Two-phase coolant model.
Table 6: Calculated and measured transient fission gas release fractions and total amount of free fission gas (FG) within the FK-1 rodlet after the test.
Property Measured Calc (1P) Calc (2P)
Transient fission gas release [ % ] 8.2 7.63 7.60 Post-test free FG content [ 10-4 mol ] 9.8 9.12 9.08
4.2.4 Axial elongation of fuel pellet column and cladding
Figure 15 shows the calculated and measured axial elongation of the fuel pellet column, and Figure 16 shows the elongation of the cladding tube. It is clear that SCANAIR-7.5 reproduces the measured evolution of these elongations with high fidelity, when the two-phase coolant channel model is used. When the single-phase model is used, SCANAIR-7.5 tends to overestimate the elongation of both the pellet column and the cladding. The reason is that the fuel and cladding temperatures are overestimated with the single-phase coolant model; see sections 4.2.1 and 4.2.2.
Figure 15: Calculated and measured axial elongation of the fuel pellet column. Thick lines are best-estimate results; thin dashed
lines represent the 5th and 95th percentiles.
The measured elongations fall within the uncertainty band for the calculations done with the two-phase coolant channel model. It is also interesting to note that the calculated unceratinty bands are significantly wider for the axial elongation of the cladding tube than for the fuel pellet column, irrespective of the coolant channel model used. This can be understood from the fact that elongation of the fuel pellet column is controlled mainly by temperature (through UO2 thermal expansion), while
the cladding elongation is affected by a multitude of parameters, e.g. temperature, thermal expansion coefficients for the fuel pellet and cladding materials, pre-test pellet-cladding gap size and cladding yield strength.
Table 7 summarises key values for measured and calculated cladding tube axial strains, which are evaluated from cladding tube elongation data and thus represent axially averaged values. The peak total axial strain, including thermal expansion and elastic deformation of the cladding, is well reproduced by SCANAIR-7.5. The residual (plastic) axial strain, however, is significantly overestimated.
Figure 16: Calculated and measured axial elongation of the cladding tube. Thick lines are best-estimate results; thin dashed lines
represent the 5th and 95th percentiles.
Table 7: Calculated and measured peak and residual axial strains in the cladding tube. The strains are evaluated from cladding tube elongation data, and thus represent average values over the active length of the FK-1 rodlet.
Property Measured Calc (1P) Calc (2P)
Peak total axial strain [ % ] 1.04 1.19 1.07 Residual axial strain [ % ] 0.30 0.60 0.49
4.2.5 Circumferential deformation of the cladding tube
Figure 17 shows the measured and calculated cladding tube residual (plastic) strain in the circumferential (hoop) direction. The strains are those caused by the RIA simulation test only; deformations resulting from the long-term pre-irradiation in Fukushima Daiichi-3 are thus not considered here.
The measured data in Figure 17 are obtained by comparing diameter traces that were determined before and after the pulse test. The peak and average values of the measured hoop plastic strain were 0.85 and 0.57 %, if the sharp peak to 1.0 % is disregarded. The axial variation in the measured hoop strain largely reflects the axial power profile for the test rodlet; see Figure B.1 in appendix B. However, there are fairly large short-range (≈20 mm) variations in the measured strains, which are believed to be caused by local dry-out of the cladding during the test. For example, the largest hoop residual strain is found 10-30 mm from the bottom of the fuel pellet column. This rather unexpected maximum location could be explained by dry-out at the bottom part of the rodlet, where natural convection of the water is not as strong
as in the upper part of the test capsule. Dry-out results in larger plastic deformation of the cladding, as a result of reduced yield strength at high temperature.
Figure 17: Calculated and measured residual (plastic) circumferential (hoop) strain of the cladding tube. Thick lines are best-estimate results;
thin dashed lines represent the 5th and 95th percentiles.
The calculated results in Figure 17 are the cladding tube hoop plastic strains, evaluated at the metal-oxide interface after the test. The calculated strains obtained with the single-phase coolant channel model in SCANAIR-7.5 are generally larger than the measured strains, while the strains obtained with the two-phase model agree favourably with measurements; the measured data fall within the calculated uncertainty band for the two-phase model.
As with the cladding axial elongation discussed in section 4.2.4, the calculated uncertainty bands for the cladding hoop residual strain are wide. The large un-certainty is due to the fact that the cladding deformation is affected by a great number of uncertain parameters, e.g. temperature, thermal expansion coefficients for the fuel pellet and cladding materials, pre-test pellet-cladding gap size and cladding yield strength; see Table 3.
4.2.6 Pellet-cladding gap width
The best-estimate pellet-cladding radial gap width at room temperature before the test was 34.8 µm, as calculated with FRAPCON-3.2-SKI. The uncertainties in input and model parameters, as defined in Table 3, resulted in a fairly large variation for the pre-test gap width applied in the Monte Carlo simulations with SCANAIR-7.5.
More precisely, the calculated 5th and 95th percentiles for the pre-test gap width were 27.1 and 42.9 µm, respectively.
Figure 18 shows the calculated evolution of the pellet-cladding gap at the peak power axial position of the FK-1 test rodlet during the first 25 seconds of the test. The gap closes for a period of 3-7 seconds, after which it re-opens and tends to a value that is larger than the pre-test gap width. The calculated post-test gap widths at the peak power axial position are summarized in Table 8. The results reflect the fact that the single-phase (1P) coolant model in SCANAIR-7.5 gives higher cladding temperatures and larger residual cladding deformations than the two-phase (2P) model. We also note that the calculated uncertainty bands for the pellet-cladding gap width are fairly wide, in similarity with the cladding tube deformations.
Figure 18: Calculated pellet-cladding radial gap width at the peak power axial position. Thick lines are best-estimate results; thin dashed
lines represent the 5th and 95th percentiles.
Table 8: Calculated post-test pellet-cladding radial gap width at the peak power axial position of the FK-1 test rodlet.
Post-test radial gap width Calc (1P) Calc (2P)
Best-estimate [ µm ] 50.2 37.2
5th percentile [ µm ] 41.0 27.2
![Table 1: Specifications of the Japanese Step I fuel design [13]. TD denotes the UO 2 fuel theoretical density (10 960 kgm](https://thumb-eu.123doks.com/thumbv2/5dokorg/3340059.18510/15.892.268.626.704.1111/table-specifications-japanese-step-design-denotes-theoretical-density.webp)
![Figure 4: Power pulse in the NSRR test FK-1, according to [13]. The simplified triangular pulse used in our computer simulations of the test is included for comparison](https://thumb-eu.123doks.com/thumbv2/5dokorg/3340059.18510/20.892.194.699.128.400/figure-according-simplified-triangular-computer-simulations-included-comparison.webp)