Airey, J., and Eriksson, U. (2019). Unpacking the Hertzsprung-Russell Diagram: A Social Semiotic Analysis of the Disciplinary and Pedagogical Affordances of a Central Resource in Astronomy. Designs for Learning, 11(1), 99–107. DOI: https://doi.org/10.16993/dfl.137
Introduction
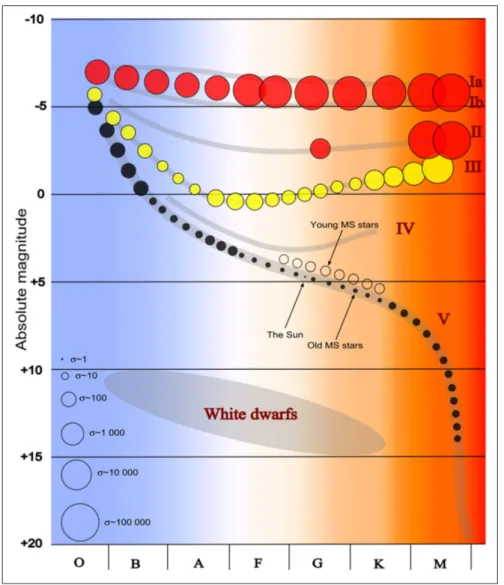
The Hertzsprung-Russell (H-R) diagram is one of the most utilized tools in astronomy and astrophysics. Essentially it is a plot of the brightness of a star against its surface temperature, with the resulting position of the star in the diagram allowing astronomers to infer a wealth of information about the star’s make-up, evolution, age and ultimate fate. A typical example of the H-R diagram can be found in Figure 1.
As disciplinary insiders, when astronomers look at the H-R diagram in Figure 1 they automatically discern a
wealth of disciplinary knowledge. But what do students discern when they first encounter it? What meaning can this resource convey and how is that meaning constructed by students? Naturally, the most obvious way to address this question is to ask the students themselves about
their disciplinary discernment (Eriksson, Linder, Airey, & Redfors, 2014) and this is indeed the path this project will be taking in the future (Eriksson et al., in preparation). However, in order to guide our questioning of students, we decided to first examine the H-R diagram itself in order to audit the ways in which it represents disciplinary knowl-edge. In this paper we adopt a social semiotic approach which has been defined as “the study of the development and reproduction of specialised systems of meaning mak-ing in particular sections of society” (Airey & Linder, 2017, p. 95). Our claim is that this kind of analysis can be used to help teachers identify potential barriers to student learning. Put simply, we argue that when teachers under-stand the relationship between disciplinary knowledge and its representation in a given situation, they are better equipped to understand the problems that students may encounter when trying to engage with that knowledge. In our analysis of the H-R diagram we draw on the interre-lated concepts of disciplinary affordance and pedagogical
affordance.
Following Fredlund, Airey, and Linder (2012), Airey (2015) has defined disciplinary affordance as “the agreed
meaning making functions that a semiotic resource fulfils for a particular disciplinary community”. Airey then goes
on to introduce a further term, pedagogical affordance, which he defines as “the aptness of a semiotic resource RESEARCH
Unpacking the Hertzsprung-Russell Diagram: A Social
Semiotic Analysis of the Disciplinary and Pedagogical
Affordances of a Central Resource in Astronomy
John Airey
*,†and Urban Eriksson
‡,§In this paper we are interested in the relationship between disciplinary knowledge and its representation. We carry out a social semiotic analysis of a central tool used in astronomy—the Hertzsprung-Russell (H-R) diagram—in order to highlight its disciplinary and pedagogical affordances. The H-R diagram that we know today combines many layers of astronomical knowledge, whilst still retaining some rather quirky traces of its historical roots. Our analysis shows how these ‘layers of knowledge’ and ‘historical anomalies’ have resulted in a number of counterintuitive aspects within the diagram that have successively lowered its pedagogical affordance. We claim that these counterintuitive aspects give rise to potential barriers to student disciplinary learning. Using our analysis as a case study, we generalise our findings, suggesting four types of barrier to understanding that are potentially at work when students meet disciplinary-specific semiotic resources for the first time. We finish the paper by making some general suggestions about the wider use of our analysis method and ways of dealing with any barriers to learning identified. In the specific case of the H-R diagram, we suggest that lecturers should explicitly tease out its disciplinary affordances by the use of ‘unpacked’ resources that have a higher pedagogical affordance.
Keywords: Disciplinary affordance; Pedagogical affordance; Graphs; Disciplinary learning; Astronomy
education; Social semiotics
* Department of Physics and Astronomy, Uppsala University, Uppsala, SE
† Department of Mathematics and Science Education, Stockholm University, Stockholm, SE
‡ National Resource Centre for Physics Education, Department of Physics, Lund University, Lund, SE
§ Department of Science Education, Faculty of Education, Kristianstad, University, Kristianstad, SE
Airey and Eriksson: Unpacking the Hertzsprung-Russell Diagram 100
for teaching some educational content”. Whilst the
dis-ciplinary affordance of any given resource at a point in time is relatively fixed, the pedagogical affordance of a resource will of necessity always be dependent on the learner. Notice also that the two terms are often—though far from always—in opposition to each other. That is, as the disciplinary affordance of a resource increases, its pedagogical affordance tends to decrease (Figure 2). This
is because disciplinary discourse is of necessity dense and takes a number of aspects for granted in order to create what Airey and Linder (2009, 2017) term a disciplinary
shorthand—an accepted way of sharing knowledge with
other experts within the discipline. Notice too that there are some resources that have high disciplinary affordance and high pedagogical affordance (purple quadrant in
Figure 2) in such cases the resource would be suitable
for both doing the discipline and teaching the discipline. However, we argue that this is not the case with respect to the HR diagram.
Thus, we will show that whilst the disciplinary affordance of the H-R diagram is indeed high, the com-plex range of information it presents, combined with a number of counter-intuitive historical anomalies, mean that the diagram actually has very low (or in some cases even negative) pedagogical affordance for newcomers to
the discipline. Put simply, what an astronomer spontane-ously ‘sees’ in the diagram (i.e. its disciplinary affordance) is extremely difficult (if not impossible) for students to initially discern. Thus, we argue that the standard H-R diagram accepted by the astronomy discipline is located in the red quadrant of Figure 2. Following our social
semiotic approach, we suggest that in order to better understand the challenges students face in developing such disciplinary discernment with respect to the H-R diagram we first need to understand why the diagram looks the way that it does—that is, we need to audit the disciplinary affordances of the diagram. To do this we will examine the historical development of this central astro-nomical resource.
Auditing the disciplinary affordances of the H-R diagram
The most basic generic affordances of any graph arise in the ability to meaningfully display each of the variables denoted by the axes along with the ability to illustrate the relationship between these variables. From here, further affordances arise as disciplines assign meaning to the rela-tionships displayed. Thus, the disciplinary affordances of any graph that students need understand can be summa-rized as follows:
Airey and Eriksson: Unpacking the Hertzsprung-Russell Diagram 101
1. The variables represented by the axes.
2. The major relationships that can be seen when the variables are plotted against one another.
3. The disciplinary meaning that has been assigned to these relationships.
In the H-R diagram, the y-axis denotes the brightness of a star and the x-axis denotes the surface temperature.1 In
this paper then, we are first interested in auditing the ways in which the diagram displays brightness and sur-face temperature and their relationship. Thereafter we are interested in auditing the astronomy meanings that have been assigned the relationships displayed.
The disciplinary affordances of the H-R diagram we use today are the culmination of a long history of scien-tific observation, cataloguing and discovery. The story of the development of these affordances can best be told by discussing the development of the two axes of the diagram—the y-axis, which denotes the brightness of a star and, the x-axis that denotes the surface temperature. Thereafter, we will examine the relationships displayed in the diagram and the meaning assigned to these relation-ships by the discipline of astronomy.
The history of the y-axis—the brightness of a star Until the mid-1850s the brightness of stars was still being estimated using the original magnitude scale that had been recorded by Ptolemy around 145 AD, but was probably conceived by Hipparchos, around 134 BC (Hughes, 2006). In this system, the brightest stars were denoted magni-tude 1 (since they are the first stars to become visible in
the night sky). The faintest stars that could be seen by the naked eye on the darkest, clearest nights were denoted magnitude 6. In 1856 Norman Pogson realized that a magnitude 1 star was approximately 100 times brighter than a magnitude 6 star (Hearnshaw, 1991). This led to him proposing a slightly adjusted magnitude scale where a difference of 5 magnitudes corresponded to exactly 100 times in brightness. (Re-)defining the old magnitude scale in this way meant that it was now easy to catego-rize stars that were fainter than magnitude 6—a problem that had been difficult to solve since the development of telescopes. Now astronomers had a magnitude scale that could encompass all stars that could be observed from the Earth including those that were too faint to be seen with the naked eye.
However, brightness was still a problematic concept since astronomers knew that stars were actually located at different distances from the Earth—a star that seems bright to us could in reality be relatively faint compared to another that (although actually much brighter) is at a very large distance from the Earth. This meant that in scientific terms, the scale was subjective—distance needed to be accounted for but there was no way of knowing how far away stars were from the Earth. In 1838 Friedrich Wilhem Bessel was the first to reasonably accurately measure an interstellar distance. He did this by using the parallax dif-ference between measurements taken in two opposed positions in space as the Earth orbited around the Sun. This led to a surge of distance measurements. Using this new information, astronomers began to talk about the brightness of stars in terms of apparent magnitudes
Figure 2: A resource with high disciplinary affordance, but low pedagogical affordance can be unpacked to make it
Airey and Eriksson: Unpacking the Hertzsprung-Russell Diagram 102
(m) and absolute magnitudes (M), where apparent magnitude referred to the original magnitude scale and absolute magnitude referred to how bright a star would be at some standard distance from the Earth. In 1902 Jacobus Kapteyn suggested that this distance should be standardized at 10 parallax seconds (parsec), which equates to approximately 32.6 light years or about 300 trillion (3 × 10¹⁴) km (Kapteyn, 1902). Notice that the basis
for the absolute magnitude system remained the original historical Hipparchus brightness system translated to this standard distance. However, defining the absolute mag-nitude in this way meant that there were many stars that were now much brighter than the old category 1. Including these stars in the system necessitated the introduction of
negative values on the brightness scale for these stars. As a
result, the absolute magnitude scale for stars that we use today goes from approximately –10 for the brightest stars to around +17 for the faintest stars.
In summary one can say that the disciplinary affordance of the y-axis of the H-R diagram is that it is used to rep-resent the brightness of stars, however, this brightness scale carries a distinct historical signature. The scale is particularly counter-intuitive since brighter stars have lower numbers, with the scale even extending into neg-ative numbers for the brightest stars. At the same time the scale is logarithmic and thus non-linear. In fact, the only intuitive aspect of the disciplinary affordance of the y-axis of the H-R diagram is that the further up the y-axis, the brighter the star. We will return to the consequences of these counterintuitive aspects of the disciplinary affordance for the understanding of the H-R diagram later in this paper. But first we will turn our attention to the disciplinary affordance of the x-axis of the diagram. The history of the x-axis—the surface temperature of a star
In 1798, William Herschel used a prism to separate out the spectra of six bright stars. Essentially, the prism sepa-rated the starlight into its component colours. Herschel noticed that these component colours were quite differ-ent for differdiffer-ent stars, but he had no way of interpret-ing his discovery. In 1868, buildinterpret-ing on Herschel’s work, Angelo Secchi categorized around 400 stars into four dif-ferent classes, depending on the characteristics of their spectra. Over the next century astrophysical spectroscopy began to emerge as a precise science. Here, Henry Draper created a cataloguing system for stars, building on
spec-tral lines, the so-called Draper system. Draper sorted stars into sixteen classes denoted alphabetically A, B, C… etc. Thousands of stars were classified and catalogued using this system. However, subsequent work by a team at Har-vard led by Edward Pickering, with assistance of Antonia Maury, Williamina Fleming and Annie Jump Cannon, gradually rearranged and combined Draper’s classes to fit what was known about stars at that time, forming the now well-known Harvard classification system: O, B, A, F, G, K, M (Hearnshaw, 1990). Notice that the original, alphabeti-cal Draper classification was retained, but certain classes were combined and O and B stars were placed first in the system. At this stage then, the disciplinary affordance of the x-axis of the H-R diagram is simply to display of the spectral classes O, B, A, F, G, K, M. Clearly, a student seeing these seemingly random letters for the first time on the x-axis of the H-R diagram might wonder about their mean-ing! However, the story of the disciplinary affordance of the x-axis did not stop there, it was about to become even more complicated.
Spectral class becomes a temperature scale
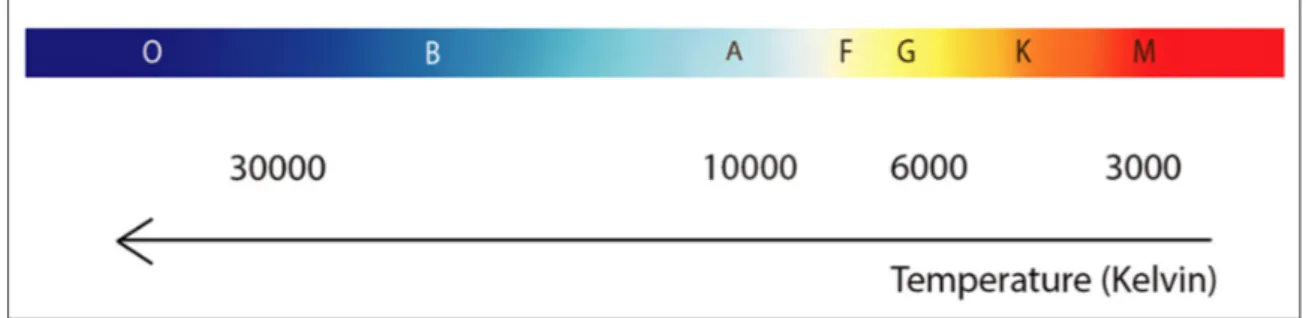
When the Harvard classification system was used to cre-ate the H-R diagram, the rearranged alphabetical system was simply applied to the x-axis from left to right. O-stars were placed at the left-hand side of the horizontal scale followed by the rest of the system to the right. Only later was it discovered that the new ordering introduced by the Harvard classification system was also directly propor-tional to the surface temperature of stars—i.e. the Harvard classification system was in fact by default a temperature scale. But this also introduced a problem. O stars had the hottest surface temperature and M stars were the cool-est. Once again astronomers elected to retain the system they had become accustomed to, since thousands of stars had by this time been categorized using the Harvard sys-tem. But this meant that contrary to convention, in the standard H-R diagram temperature decreases from left to right. Moreover, the change in temperature between the successive spectral classes is non-linear. Consequently, the surface temperature scale of the x-axis of the H-R diagram, increases towards the origin and is not linearly distrib-uted, a very unusual and counter-intuitive feature in any diagram (see Figure 3).
In summary, the main disciplinary affordance of the horizontal scale in the H-R diagram used by astronomers today is that it represents the surface temperature of stars,
Figure 3: Diagram showing the surface temperature of stars of different spectral classes (colours) in the Harvard
Airey and Eriksson: Unpacking the Hertzsprung-Russell Diagram 103
but it is not labelled as such—in fact, by convention, there are no units written on this axis at all. Moreover, tempera-ture decreases to the right and is expressed in non-linear
descending order by the now seemingly random spectral classes OBAFGKM.
Putting the x and y axes together: The emergence of the H-R diagram
By around 1910 information about stars was growing rapidly showing that spectral type, colour, and surface temperature were all closely related to each other (Hoskin, 1999). As described earlier, distances to the stars had begun to be measured, so it was now possi-ble to plot the absolute magnitude of a star against, for example, the spectral class. This was the foundation for what was to become known as the Hertzsprung-Russell diagram. In 1911 Ejnar Hertzsprung published his first H-R diagram (Hertzsprung, 1911). Parallel to this devel-opment Henry Russell (1912), had also discussed stellar brightness in terms of absolute magnitude versus spectral type (Hearnshaw, 1990). In 1913 and 1914 he published diagrams using stars that were known to be of similar dis-tance from the Earth, in his first H-R diagrams (Russell, 1913, 1914). This type of diagram turned out to be of cru-cial importance in understanding how stars evolve. The meaning assigned to the relationships displayed in the H-R diagram
Today’s H-R diagram has so many specialized disciplinary affordances that it would be impossible to adequately dis-cuss them all in a single paper. For example, the modern H-R diagram can be used to determine such diverse things as stellar mass, radius, evolutionary stage, composition, variability, etc. In this paper we have limited our discus-sion of the diagram’s disciplinary affordances to those that we believe are central for a newcomer in order to orient themselves in the diagram—namely the understanding of the two axes and the meaning that has been assigned to the different positions in the diagram.
As more and more stars were plotted onto the H-R diagram, astronomers found that stars clustered together in particular patterns. Astronomers identified four main groupings of stars—these were termed: Main sequence, Giants, Super giants and White dwarfs. These groupings were gradually associated with different stages in the ‘life-cycle’ of stars. It turned out that the position of a star on the H-R diagram could tell astronomers about its evolu-tionary stage, composition and ultimate fate. Based on these observations astronomers now know that a star like the Sun has a ‘lifetime’ of around 13 billion years. Most of this, about 12.5 billion years would be spent on the so-called main sequence.
Main sequence
Stars spend most of their ‘life’ on the main sequence. Here they ‘shine’ by fusing hydrogen in their cores to create helium. In this phase there is a predictable rela-tionship between brightness and temperature. Brighter stars are hotter. The more massive the star, the hotter and brighter it is, so the upper left section of the main
sequence contains stars that are ‘heavier’ than the Sun whilst the lower right of the main sequence contains stars that are ‘lighter’ than the Sun—mass is thus an important but ‘invisible’ disciplinary affordance available to astrono-mers in the diagram.
Red giants and super giants
When the hydrogen in the core of a main sequence star has been used up, the core collapses under its own weight. The pressure and temperature become so great that helium can now be fused into carbon, oxygen and nitrogen in the core. At the same time, hydrogen can start to fuse in a layer around the core as the temperature increases greatly. Paradoxically this collapse of the core means that the star’s outer layers expand. The star is now much brighter than when it was on the main sequence, because the outer lay-ers are so much bigger while at the same time the surface temperature of the star is actually much cooler (redder); the star enters the red giant phase. This is a ‘short’ phase of a few million years. At this stage, the star expands and con-tracts, throwing off much of its outer shell, before becom-ing a white dwarf (see next section). Some stars enter what is called the supergiant phase, which lasts for only a ‘short’ time, astronomically speaking. However, the exact evolu-tion and posievolu-tion in the H-R diagram for ‘dying’ stars, even for the Sun, is not well-defined. There are many physical processes involved in the late evolution of stars and some stars become larger—super giants—whereas some ‘only’ reach the red giant phase. The most important single fac-tor here is the mass and generally more massive stars than the Sun evolve to become super giants. Less massive stars ‘only’ evolve into red giants. However, there is no theo-retically distinct model describing which stars evolve into super giants or just to giants. The models do, however, describe what the final stage of the different stars will be: white dwarfs, neutron stars, or black holes.
White dwarfs
Near the end of their fusion stage, less massive stars, like the Sun, expel most of their outer material. Only the hot core remains. This core is very dense and made mostly of carbon, oxygen and nitrogen, with a very high tempera-ture. The mass of a typical white dwarf can be similar to the Sun, while its size is more similar to that of the Earth. This core then slowly cools off by radiating thermal energy, a process that will take billions of years!
Black holes and neutron stars
Depending on mass, stars evolve differently and stars over
10 times more massive than the Sun have a very different and violent fate. In short: the pressure and temperature in their cores is so large that when they have used up all the helium they then start to fuse carbon. This continues with fusion of heavier elements until an iron core builds up and fusion abruptly stops. Now gravity will overcome the radia-tive outward forces that earlier were present due to fusion and the star collapses. Once the core of the collapsing star reaches the density of nuclear matter, this implosion turns into an explosion, ejecting all but the innermost 1–2 solar masses throughout space. The remaining mass usually
Airey and Eriksson: Unpacking the Hertzsprung-Russell Diagram 104
forms a neutron star. In cases where the mechanism fails a black hole may form, swallowing the majority of the star. Interestingly, neither black holes nor neutron stars can be seen in the H-R diagram.
Increasing the pedagogical affordance
As we have demonstrated, the disciplinary affordances of the H-R diagram have developed and changed over a long period of time. Following our earlier discussion of the generic affordances of graphs, we argue that for newcomers to the astronomy discipline the main features of the dia-gram that first need to be unpacked by teachers are:
1. The variables represented by the two axes—in
this case the surface temperature of a star and its brightness.
2. The major relationships that can be seen when these two variables are plotted against one another—in this case the four general clusters seen
on the diagram.
3. The disciplinary meaning that has been assigned to these relationships by the astronomy community—in this case that there are
four phases of stellar evolution and that each phase signals that different physical processes are at work in the star.
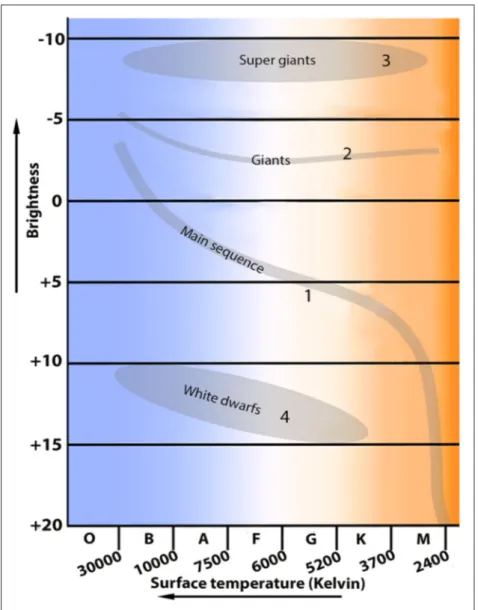
In Figure 4 we have unpacked and emphasised these
three disciplinary affordances, whilst removing other finer details that astronomers have discovered about stars. This (over)simplified version of the H-R diagram has much less disciplinary affordance than our original diagram presented in Figure 1, but at the same time, we would
argue that the pedagogical affordance is much higher for the introduction of students to the main features of the diagram (i.e. the new diagram has shifted to the blue quadrant in Figure 2). Specifically, this increase in
peda-gogical affordance has been achieved by adding arrows, explanatory labels and units to the axes and by limiting the amount of information presented to the four main
Figure 4: An example of an H-R diagram with higher pedagogical affordance that unpacks some of the disciplinary
affordances for newcomers to the discipline. Here, the axes are labelled and directions of increasing brightness and surface temperature are depicted using arrows. The four main stages of stellar evolution are also named and ordered using the numbers 1–4.
Airey and Eriksson: Unpacking the Hertzsprung-Russell Diagram 105
features of the diagram. These main features have also been named and labelled numerically to highlight the progression of stellar evolution.
Having audited the main disciplinary affordances of the H-R diagram, and suggested how the pedagogical affordance of the diagram can be increased, in the next section we use our findings to comment more generally on the different types of problems students can encounter when they meet disciplinary resources for the first time.
Potential barriers to understanding disciplinary resources
We believe our audit of the disciplinary affordances of the H-R diagram allows us to illustrate a number of more general themes about the ways in which disciplinary-spe-cific semiotic resources are presented to and interpreted by newcomers to a discipline. By combining our analysis with our extensive experience of the ways that informa-tion is tradiinforma-tionally presented to students in undergradu-ate courses, we suggest that there are four potential types of problem for students who are attempting to grasp the meaning of the disciplinary-specific semiotic resources used in their discipline. These four problem types can be summarized under the headings: History, Omission, Over-loading and Expectations.
History: Disciplinary resources are often idiosyncratic It is not uncommon that the affordance of disciplinary-specific semiotic resources has a convoluted history. There are often historical reasons for the semiotic resources used in disciplines being idiosyncratic or even downright counterintuitive. Here an example from our analysis is the successive changes made to the y-axis ‘brightness’ scale in the H-R diagram. The scale as it stands today stretches from minus ten for the brightest stars at the ‘top’ of the scale ‘down’, through zero and into positive numbers as ‘low’ as plus 17 for the faintest stars. The scale is also loga-rithmic. To astronomers, this idiosyncratic scale probably seems quite normal and may only be mentioned in pass-ing. However, for students seeing the scale for the first time a number of issues will need to be initially pointed out for them, such as minus is brightest, plus is faintest, zero has no special meaning and the scale is logarithmic. Omission: Experts leave things out
When disciplinary experts share knowledge with each other, they try to do this in the most effective manner pos-sible. This means that they often leave out information that is taken for granted in the discipline. In Wittgenstein’s (1958) terms experts assume that people within the dis-cipline are playing the same language game. Airey and Linder (2009, 2017) refer to this phenomenon as the development of a kind of disciplinary shorthand. A typical example here is the lack of labelling on the x-axis of the H-R diagram. It is impossible for astronomers not to know
that the letters OBAFGKM refer to different spectral classes and that this in turn is related to the surface temperature of the star so no label is needed. Thus, for a newcomer to a discipline it is rarely sufficient to simply present standard, disciplinary-specific semiotic resources—this information
needs to be unpacked. If something is not present in a resource how can we expect newcomers to ever access this information?
Overloading: Experts give too much information A further issue related to the use of standard, disciplinary-specific semiotic resources is that of
overloading. It is quite common for experts to introduce
new semiotic resources by using un-edited, authentic, research-based materials. Here a typical example would be presenting Figure 1 directly to introductory students.
With so much new and complex information being presented at once it is difficult for students to know what to focus on. In our opinion this occurs because experts actually no longer notice the complexity involved. Although the resource used may perfectly illustrate the issue the expert wishes to discuss, it also illustrates a lot of other things too. While the expert knows which aspects of the whole to pay attention to in a given situation and which aspects can be ignored, students are swamped with information and do not know what is important. Here, Eriksson et al. (2014) have shown that develop-ing disciplinary discernment is a gradual process that builds throughout undergraduate studies and beyond. The risk, then is that faced with a range of choices, intro-ductory students focus on the wrong aspects. In the case of the H-R diagram for example, students may think that the coloured background is simply an aesthetic embellishment and choose to ignore it, however, as we have shown, the coloured background is purposeful and actually conveys important disciplinary meaning—the stars in the blue section really are blue!
Expectations: Students’ everyday heuristics
Finally, we turn to the students themselves. diSessa (1993) explained that we all have simple heuristics that we use to judge new information—so called phenomenological
prim-itives (p-prims). Typical examples of these p-prims might
be more is better, bigger is stronger, shorter is quicker, etc. In the previous section we discussed the counterintuitive nature of the x-axis of the H-R diagram where hotter is to the left. Naturally students will expect temperature to increase to the right unless this feature is pointed out and stressed. But what might happen if this feature was not pointed out?
In stellar terms, blue stars are ‘hot’ whilst red stars are ‘cooler’, however, following diSessa’s p-prims we can expect students to use the everyday heuristic where red is hot and blue is cold. Unfortunately, this misconception would appear to be ‘confirmed’ by the colours on the H-R diagram where red is to the right. Moreover, the situation is compounded by the anthropomorphic analogies2 used
in the astronomy discipline. Astronomers often talk about the life and death of stars. Here we can expect students to hold the heuristic that alive is warm and dead is cold. Once again this is not the case in the H-R diagram where we can see from the positioning of the numbered sequence 1–4 in Figure 4 that a white dwarf is actually hotter than the
original main sequence star from which it formed. Notice how the expected direction of increase on the x-axis, the
Airey and Eriksson: Unpacking the Hertzsprung-Russell Diagram 106
colour-temperature relationship and the life-death anal-ogy all point a newcomer in the wrong direction. We sug-gest that these three factors could in fact lead to some students experiencing exactly the opposite of what is actu-ally being represented. Thus, our analysis suggests that some of the issues we highlight may be contributors to the alternative conceptions of undergraduate students and we therefore propose that lecturers should pay par-ticular attention to the disambiguation or ‘unpacking’ (Fredlund et al., 2014) of these features for their students.
In our continued work we have studied the four types of potential problem identified above by collecting student responses to the H-R diagram in an online survey (Eriksson et al., in preparation).
Conclusion
In this paper we have discussed the relationship between disciplinary and pedagogical affordance and their roles in representing disciplinary knowledge. We have used these terms in the analysis of a central resource in astronomy—the H-R diagram. Based on this analysis, we identified four types of problem that students can poten-tially encounter when they meet disciplinary-specific semiotic resources for the first time. These are related to the history of the resource, the omission of key informa-tion, the overloading that occurs due to the sheer amount of disciplinary knowledge on display and the students’ own expectations about the knowledge and how it will be presented.
It has been repeatedly demonstrated that university lecturers underestimate the challenges their students face in decoding disciplinary-specific resources (Middendorf & Pace, 2004; Northedge, 2002; Tobias, 1986, 1992–1993). In this respect, Englund (1998) has suggested analyzing the causes of problems in student understanding with a view to changing institutionalized communicative patterns to make disciplines more accessible. However, in the case of the H-R diagram and many other central discipli-nary-specific resources, we believe such an approach is unrealistic. In the same way that the H-R diagram has become an integral part of the way that astronomers think about stellar evolution, other resources in other disciplines are an integral part of the way disciplinary experts think. Thus, in this paper, rather than challenging the astronomy discourse by proposing the introduction of a new, more easily interpreted alternative to the H-R diagram; our approach has focused on helping students to discern the disciplinary affordances of the diagram itself, i.e. we have focused on fostering disciplinary discernment (Eriksson et al., 2014). We claim that more often than not this is the approach that will need to be adopted in discipline-based educational contexts. Thus, we suggest that when intro-ducing students to a new resource, lecturers should think carefully about its disciplinary affordances—what are the basic features of the resource and how can the pedagogi-cal affordance can be enhanced so as to emphasise these features?
Finally, we would like to point out that from a represen-tational point of view there is no reason to believe that there is anything particularly special about astronomy. We
therefore argue that the careful analysis of the disciplinary affordances of central, taken-for-granted resources as described in this paper has the potential to benefit teaching and learning in a wide range of disciplines.
Notes
1 Note that it is also very common for astronomers
to use the so-called B-V index on the x-axis, which denotes the colour of a star where this colour has a direct relationship to temperature.
2 See Taber and Watts (1996) for a discussion of
anthro-pomorphism in science learning.
Acknowledgements
Funding from the Swedish Research Council (project number VR 2016-04113) is gratefully acknowledged.
Competing Interests
The authors have no competing interests to declare.
References
Airey, J. (2015). Social Semiotics in Higher Education:
Examples from teaching and learning in undergradu-ate physics. Paper presented at the Concorde Hotel/
National Institute of Education, Singapore, 3–5
Novem-ber 2015.
Airey, J., & Linder, C. (2009). A disciplinary discourse
perspective on university science learning: Achieving fluency in a critical constellation of modes. Journal
of Research in Science Teaching, 46(1), 27–49. DOI:
https://doi.org/10.1002/tea.20265
Airey, J., & Linder, C. (2017). Social Semiotics in
University Physics Education. In D. F. Treagust, R. Duit, & H. E. Fischer (Eds.), Multiple
Representa-tions in Physics Education (pp. 95–122). Cham:
Springer International Publishing. DOI: https://doi. org/10.1007/978-3-319-58914-5_5
diSessa, A. A. (1993). Toward an epistemology of
physics. Cognition and Instruction, 10(2 & 3), 105–226. DOI: https://doi.org/10.1080/07370008. 1985.9649008
Englund, T. (1998). Teaching as an offer of (discursive)
meaning? In B. Gundem, & S. Hopmann (Eds.),
Didaktik and/or curriculum. An international dialogue
(pp. 215–223). New York: Peter Lang.
Eriksson, U. (2007). Stellar surface structures and the astrometric search for exoplanets. (Licentiate degree),
Lund University and Kristianstad University.
Eriksson, U., Linder, C., Airey, J., & Redfors, A.
(2014). Introducing the Anatomy of Disciplinary Discernment – An example for Astronomy. European
Journal of Science and Mathematics Education, 2(3),
167–182.
Fredlund, T., Airey, J., & Linder, C. (2012). Exploring the
role of physics representations: an illustrative example from students sharing knowledge about refraction.
European Journal of Physics, 33(3), 657. DOI: https://
doi.org/10.1088/0143-0807/33/3/657
Fredlund, T., Linder, C., Airey, J., & Linder, A. (2014).
Airey and Eriksson: Unpacking the Hertzsprung-Russell Diagram 107
appreciation of disciplinary affordance. Physical
Review Special Topics – Physics Education Research, 10(2), 020129. DOI: https://doi.org/10.1103/
PhysRevSTPER.10.020129
Hearnshaw, J. B. (1990). The analysis of starlight: one hundred and fifty years of astronomical spectroscopy.
CUP Archive.
Hertzsprung, E. (1911). Über die Verwendung
photog-raphischer effektiver Wellenlaengen zur Bestimmung von Farbenäquivalenten. Publikationen des
Astrophysi-kalischen Observatoriums zu Potsdam, 63.
Hoskin, M. (1999). The Cambridge Concise History of Astronomy. Cambridge: Cambridge University Press. Hughes, D. W. (2006). The Introduction of Absolute
Mag-nitude (1902–1922). Journal of Astronomical History
and Heritage, 9, 173–179.
Kapteyn, J. C. (1902). On the luminosity of fixed stars. Publications of the Astronomical Laboratory at Gronin-gen, 11, 4–32.
Middendorf, J., & Pace, D. (2004). Decoding the
disci-plines: A model for helping students learn disciplinary ways of thinking. New Directions for Teaching and
Learning, 98(Summer 2004), 1–12. DOI: https://doi.
org/10.1002/tl.142
Northedge, A. (2002). Learning for life in the 21st century. Sociocultural perspectives on the future of education.
In G. Wells, & G. Claxton (Eds.). Oxford: Blackwell Publishers.
Russell, H. N. (1912). Relations between the spectra and
other characteristics of the stars. Proceedings of the
American Philosophical Society, 51(207), 569–579. Russell, H. N. (1913). Relations between the spectra and
other characteristics of the stars. Popular Astronomy,
22, 275–294.
Russell, H. N. (1914). Relations Between the Spectra and
other Characteristics of the Stars. II. Brightness and Spectral Class. Nature, 93, 252–258. DOI: https://doi. org/10.1038/093252a0
Taber, K. S., & Mike Watts, M. (1996). The secret life of
the chemical bond: students’ anthropomorphic and animistic references to bonding. International Journal
of Science Education, 18(5), 557–568. DOI: https://doi.
org/10.1080/0950069960180505
Tobias, S. (1986). Peer Perspectives – On the teaching of
Science. Change, 18, 36–41. DOI: https://doi.org/10.1 080/00091383.1986.9937055
Tobias, S. (1992–1993). Disciplinary cultures and
gen-eral education: What can we learn from our learners?
Teaching Excellence, 4(6), 1–3.
Wittgenstein, L. (1958). Philosophical investigations
(Anscombe, G. E. M., Trans. 2 ed.). Oxford: Basil Blackwell Ltd.
How to cite this article: Airey, J., and Eriksson, U. (2019). Unpacking the Hertzsprung-Russell Diagram: A Social Semiotic
Analysis of the Disciplinary and Pedagogical Affordances of a Central Resource in Astronomy. Designs for Learning, 11(1), 99–107. DOI: https://doi.org/10.16993/dfl.137
Submitted: 27 February 2019 Accepted: 13 May 2019 Published: 16 August 2019
Copyright: © 2019 The Author(s). This is an open-access article distributed under the terms of the Creative Commons
Attribution 4.0 International License (CC-BY 4.0), which permits unrestricted use, distribution, and reproduction in any medium, provided the original author and source are credited. See http://creativecommons.org/licenses/by/4.0/.