J
Ö N K Ö P I N GI
N T E R N A T I O N A LB
U S I N E S SS
C H O O LJÖNKÖPING UNIVERSITY
Ta k e o v e r s i n S w e d e n
The Returns to Acquiring Firms
Master thesis within Financial Economics Author: Christoffer Havkranz Tutor: Per-Olof Bjuggren Ass. Supervisors: Helena Bohman
Master’s Thesis within Financial Economics
Title: Takeovers in Sweden
Author: Christoffer Havkranz
Supervisor: Per-Olof Bjuggren
Ass. Supervisor: Helena Bohman, Daniel Wiberg
Date: May 2006
Subject terms: Takeovers, Shareholder Return, Market Model,
Abstract
A takeover announcement does not necessarily mean good news for stockholders of the acquiring firm. In fact, for a majority of takeovers it means losses in share prices. Motives that can explain this trend are agency and hubris. This thesis is an event study of 28 acquiring firms in Sweden between the years 1997-2005, and the purpose is set to see whether stock prices are affected or not. This has been done by the help of the market model. The empirical results show that the takeovers are on average value decreasing operations which indicate that agency and hubris are the primary motives even though one can not for certain exclude synergy.
Table of Contents
1
Introduction... 1
1.1 Problem ...1
1.2 Purpose ...2
1.3 Outline ...2
2
Earlier Studies on Takeover Performance ... 3
3
Definitions and Motives... 3
3.1 Definitions...3
3.2 Reasons for takeovers...4
4
Method of the Event Study... 7
4.1 Event Study Procedure...8
4.2 The Market Model...9
4.3 Test Statistics Under the Null Hypothesis...10
5
Empirical Results and Analysis ... 11
6
Conclusion and Further Research... 14
References ... 15
Figures
Figure 3.1 Varieties of Takeovers...4
Figure 3.2 Industry With Significant Scale economy ...5
Figure 4.1 The Event Period...9
Figure 5.1 CAR For Acquiring Companies ...12
Tables
Table 3.1 Pattern of Gains Related to Takeover Theories...7Table 5.1 Event Period Results ...11 Table A Selected Acquiring Companies ...Appendix
1 Introduction
Gershon N Mandelker (1974) once wrote “that for stockholders of acquiring firms, ‘news’ of an acquisition may not be worthwhile news”.
Mandelker was one of the pioneers in the early 1970s with the application of the event study methodology to takeovers. His findings illustrate a pattern that was to be repeated in several subsequent studies. In this area of finance an abundance of event studies has exhibited that takeovers create gains for shareholders, with most of the returns accruing to the target company. This has been done by examining the stock market’s reaction to takeover announcements.
Corporate takeovers are a widely discussed topic in almost every financial publication. This field of finance is constantly debated and investigated. A reason for this is of course that it deals with huge amounts of money.
Historically there has been four major periods of takeovers up to 1990, all of them related to the economic and cultural characteristics of their time. After 1990 the number of takeovers increased sharply throughout the world. This wave of takeovers during the 90s was very much related to the rapid pace of changes that took place around the world. Exceeding all are technological changes which include computers, software, servers and advances in information systems like the Internet. International agreements by nations such as the General Agreement on Tariffs and Trade (GATT) have resulted in freer trade. The growing forces of competition have produced deregulation in major industries such as financial services, airlines and medical services. Further, operations have become more efficient with economies of scale and economies of scope. Industries have gone through changes in their organizations at the same time as individual entrepreneurship has created dynamism. Finally, the economic climate has been favorable for takeovers with rising stock prices and low interest rates (Weston and Weaver, 2001).
This thesis will concentrate on examine recent corporate takeovers in Sweden and study the impact the announcements on these takeovers have on shareholders’ returns for the acquiring companies. In order to draw an overall conclusion for the events of interest one must aggregate the abnormal returns for the 28 firms used in this empirical study.
1.1 Problem
The view on takeovers concerning both the methodology to be used to determine the causes and consequences, and what the causes and consequences are, have throughout the years changed. Disagreements emerged in the mid 1980s about the motives of the managers who undertake takeovers, about the effects, and how to measure these effects. This debate raised the question of the proper benchmark for, and the length of the “window” for measuring returns.
Up until the mid 1980s takeovers were often viewed in the finance literature as being wealth increasing operations for both the target and the acquiring firms, even if the acquiring firms showed zero profits. This was due to that the authors simply cared about reporting about the total wealth effects. Further critique with the earlier studies is that the majority of them did not include any information of shareholders’ returns in the post announcement period. The studies only included information about shareholders’ returns in the pre announcement period, the period leading up to the event day.
The debate still goes on of the proper benchmark period and the length of the event period. Different results can be attained using the market model, depending upon the benchmark period used to estimate its parameters. However, the natural choice for a benchmark period is some interval before the takeover announcements, since one wish to measure the changes in performance as a result of the takeover (Mueller, 2003).
To measure abnormal returns over longer periods, one must be able to measure expected returns precisely over substantial periods, and no one has presented a convincing way to do this (Andrade, Mitchell and Stafford, 2001). Therefore, to attain reliable results one has to use a short period window.
1.2 Purpose
The purpose of this thesis is to demonstrate how Swedish acquiring firm’s returns are affected following takeover announcements. This is achieved using the market model where the effects of takeovers are measured by examining the differences between actual and predicted returns over a particular interval around the announcement day.
1.3 Outline
After a review of earlier event studies made on takeovers in chapter two, the definition takeover and the motives why firms engage in such an action are examined and presented in chapter three. The motives are summarized into three categories where each of them changes the value in stock prices in different ways. Thereafter, in chapter four the procedure for carrying out an event study is described, followed by the features of the market model as well as the features of the test statistics under the null hypothesis. Chapter five presents the empirical results along with the analysis. Finally in chapter six, the conclusions of the study are presented.
2 Earlier Studies on Takeover Performance
Empirical research on takeovers has displayed a great deal about their trends and characteristics over the last century. The event studies throughout the years have revealed that takeovers seem to create shareholder value, with most of the gains accruing to the target company. The most reliable evidence on whether takeovers create value for shareholders comes from short-window event studies, where the average abnormal stock market reaction at takeover announcement is used as a determinant of value creation or destruction. In a capital market that is efficient with respect to public information, stock prices quickly adjust following a takeover announcement, including any expected value changes. Furthermore, the total wealth effect of the takeover should be included into stock prices by the time uncertainty is resolved, i.e., at the close of the takeover (Andrade, Mitchell and Stafford, 2001).
In a study done by Mandelker (1974), he found that shareholders of target companies earn a significant 12 percent return following a takeover, while shareholders of acquiring firms experience almost no change in wealth. Also, in 54 percent of the takeovers in the sample, acquirers’ gains are negative.
In other well known studies done in the 1980’s, by Malesta (1983), by Jensen and Ruback (1983), and by Bradley Desai and Kim (1988) they all came up with similar results as Mandelker. For returns to shareholders of target companies the result is unanimous, they are positive. The returns to acquiring firms’ shareholders are negative for about half the cases, and the average return is also negative according to Bradley, Desai and Kim. Malesta found that takeovers are value decreasing transactions for acquiring firms, while Jensen and Ruback found that acquiring firms’ shareholders come dangerously close to actually subsidizing these transactions.
Long term event studies over three to five years have also been done (for example, Fama (1998), and Mitchell and Stafford (2000)). They all came up with more or less similar results as the announcement-period analyses, namely, that takeovers create value for the shareholders of the combined firms, with the majority of the gains accruing to the shareholders of the target. The concern with long-term event studies lies in the methodology. The problem stems from that the tests are being joint tests of stock market efficiency and a model of market equilibrium. This problem is not a major one for short-window event studies where the expected returns are practically zero regardless of what model is used.
3 Definitions and Motives
The following chapter will first define the term takeover; further on explain the motives behind takeovers.
3.1 Definitions
This thesis uses the general term takeover referring to the transfer of control of a firm from one group of shareholders to another. Sometimes the term takeover refers to only hostile transactions, at other times it refers to both friendly and unfriendly transactions. However, in thesis the latter will be used.
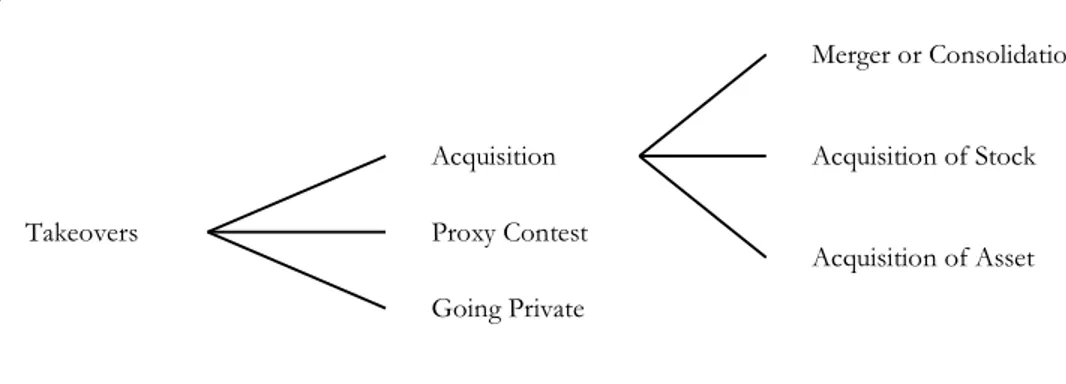
A firm that has decided to take over another firm is referred to as the acquirer or the bidder. The acquirer offers to pay cash or securities to obtain the stock or assets of another company. If the offer is accepted, the target firm will give up control over its stock or assets to the acquirer in exchange for the consideration (i.e., its stock, its debt, or cash). For example, when the acquiring firm takes over a target firm, the right to control the operating activities of the target firm is transferred to a newly elected board of directors of the acquiring firm. This is a takeover by acquisition. Takeovers can occur by acquisition, proxy contests, and going private transactions. This is illustrated in figure 3.1.
Figure 3.1 Varieties of Takeovers
Source: Ross, Westerfield and Jaffe, 1996
If a takeover is achieved by acquisition, it will be by merger, tender offer for shares of stock, or purchase of assets. In mergers and tender offers, the acquiring firm buys the voting common stock of the acquired firm.
The second possibility that the takeover can occur is by proxy contest. This occurs when a group of shareholders attempts to gain controlling seats on the board of directors by voting in new directors. A proxy authorizes the proxy holder to vote on all matters in a shareholders’ meeting. In a proxy contest, proxies from the rest of the shareholders are requested by a dissatisfied group of shareholders.
In going private transactions, all the equity shares of a public firm are purchased by a small group of investors. The group usually includes members of present management and some outside investors. The shares of the firm are delisted from stock exchanges and can no longer be purchased in the open market (Ross, Westerfield and Jaffe, 1996).
3.2 Reasons for takeovers
There are several reasons why a company might engage in a takeover. The reasons can be summarized into three broad categories: synergy, agency and hubris.
The first category, synergy, refers to a reaction that occurs when two combined factors produce a greater effect together than the sum of the two independently. In takeovers, the achieved effect is that the profit of a corporate combination is more profitable than the individual profits of the firms that were combined. Synergy allows firms to cover the costs of the takeover itself and still be able to afford to give target shareholders a premium for their shares. In this case the combined firm appears to have a positive net acquisition value (NAV). Acquisition Proxy Contest Going Private Merger or Consolidation Acquisition of Stock Acquisition of Asset Takeovers
NAV = [VAB – (VA + VB)] – (P + E)
where VAB = the combined value of the two firms
VA = A’s measure of its own value
VB = the market value of the shares of B
P = premium paid for B
E = expenses of the acquisition process
The synergistic effect is the term inside the brackets. For the takeover to actually take place this effect must be greater than the sum of P + E, otherwise the bidding firm will overpay for the target (Gaughan, 1996).
The two main types of synergy are operating and financial. Operating synergy suggests that a horizontal or vertical takeover results in some sort of efficiency gain. A horizontal takeover involves a combination of two similar companies in the same industry while a vertical takeover involves a combination of two companies in different stages of production within the same industry. Financial synergy suggests the possibility that by combining one or more companies can lower the cost of capital (Cartwright and Cooper, 1996).
A combined firm may generate greater revenues than two separate firms. These revenues may come from improved marketing, strategic benefits, and increased market power through reduced competition, which in turn may lead to increased prices and obtained monopoly profits (Ross, Westerfield and Jaffe, 1996).
One of the most basic reasons why firms engage in takeovers is to increase efficiency and thus lower costs. This can be done in several different ways. In an industry with significant scale economies as illustrated in figure 3.2, a horizontal takeover can reduce the average costs of the combined firms by increasing their scale of operation. If the decline in average Figure 3.2 Industry With Significant Scale Economy
Source: Mueller, 2003.
costs decreases as scale economies increases, the expected cost reductions from horizontal mergers are greater for pairs of small firms like A and B than they are for big firms like D
A B C D E Avarage Cost Scale of Operation
and E. Thus, one can expect that if scale economies are the driving force behind horizontal takeovers, they most frequently occur between the smaller firms in an industry (Mueller, 2003).
The purpose of vertical takeovers is to make coordination of closely related operating activities easier. This is probably the reason why most forest product firms that cut timber also own sawmills. This can also explain why most airline companies own airplanes (Ross, Westerfield and Jaffe, 1996).
Economies of scope take place when the production of two totally different products by the same firm leads to lower production costs for one or for both products. An example of such economies might be the warehousing and delivery of products to particular retailers. Even though there may be no economies in a single firm’s producing both coffee and cigarettes, because they are both sold in supermarkets they can be stored and shipped together, and a firm that sells them both may economize on these costs. The existence of economies of scope is a possible explanation for conglomerate takeovers (Mueller, 2003). The second category, agency motive, suggests that some takeovers are mainly motivated by the self-interest of the acquirer management. Several reasons have been put forward to explain this motive. Amihud and Lev (1981) argues that diversification of management’s personal portfolios is one reason, Jensen (1986) suggests that the use of free cash flow to increase the size of the firm is another and Shleifer and Vishny (1989) refers to the motive that by increasing the firm’s assets from takeover activity increases the dependence of the management. What most of these three reasons end up with is that the takeover results in increased value for the acquirer management at the cost of acquirer shareholders. For example, managements acquire firms in their own field of business so that the success of the combined firm depends on the managements’ skills. In this way they can use this dependency to increase extra consumption or defeat rivals. Actions like these result in agency costs that reduce the total value of the combined firm available to shareholders (Berkovitch and Narayanan, 1993).
What has above been stated is that the target firm has been recognized by the acquirer managements most suited to increase its own welfare. When this is recognized by the target shareholders they will try to obtain this value, and they will succeed in doing so as long as they have some bargaining power. Hence, the greater agency problem, the higher the target gains (Berkovitch and Narayanan, 1993).
The third category, the hubris hypothesis states that takeovers are motivated by managers’ mistakes and that there are no synergy gains. Since the synergy is presumed to be zero, the payment to the target represents a transfer between the target and the acquirer. Thus, the higher the target gain, the lower the bidder gain, and the total gain is zero (Berkovitch and Narayanan, 1993).
For example, when there are many bidders or competitors for a target, a wide range of bids is likely to occur. Each company is willing to bid a price up to the value it thinks the shares are worth. The company with the most optimistic prediction about the target company’s future profits, making the highest bid acquires the target company. With rational expectations on the part of all bidders, the expected true value of the firm should be at the mean of the distribution. The winning bidder has almost certainly bid too much, and is therefore “cursed” in the sense that its bid exceeds the value of the tract, so the firm loses money. Hence the hubris hypothesis is sometimes referred to the winner’s curse (Mueller, 2003).
Richard Roll (1986) considers the role that hubris, or the pride of managers in the acquiring firm, may play in explaining takeovers. The hypothesis implies that managers seek to acquire firms for their own personal motives and that the pure economic gains to the acquiring firm are not the only or even the primary motivation in the acquisition. He uses this hypothesis to explain why managers might pay a premium for a firm that the market has already corrected valued. The managers know that the average acquiring firm loses on a merger, but they believe that they are not average. They can beat the odds and spot true value in a target firm, where others cannot.
Further, Richard Roll (1986) states that the following should occur for those takeovers motivated by hubris:
• The stock price of the acquiring firm should fall after the market becomes aware of the takeover bid. This, due to that the takeover is not in the best interest of the acquiring firm’s stockholders and does not represent an efficient allocation of their wealth.
• The stock price of the target firm should increase. This, due to that the acquiring firm may pay a premium in excess of the value of the target. • The combined effect of the rising value of the target and the falling value of
the acquiring firm should be negative.
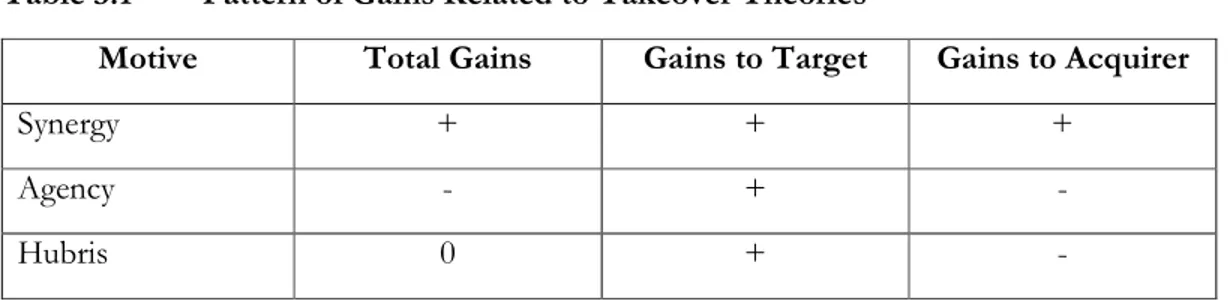
The three motives discussed in this chapter are summarized in table 3.1 on the basis of whether value changes in stock prices are positive, zero or negative. It can be seen from the table that the synergy hypothesis predicts positive total, target and acquirer gains. The agency hypothesis predicts negative total and acquirer gains, but positive target gains. The last motive, the hubris hypothesis, predicts zero total gains, positive target gains and negative acquirer gains.
Table 3.1 Pattern of Gains Related to Takeover Theories
Motive Total Gains Gains to Target Gains to Acquirer
Synergy + + +
Agency - + -
Hubris 0 + -
Source: Berkovitch and Narayanan, 1993
4 Method of the Event Study
The first step to measure the effect a takeover announcement has on stock value is to define an event period. Usually this is centered on the announcement date, which is planned to day 0 in event time. What calendar date day “0” is differs from different firms since it is the announcement of a particular firm. Thereafter one has to calculate the normal (predicted) return for each day in the event period for each firm, which represents the return that would be expected if no event took place. This can be done by using three different methods. These are: the mean adjusted return method, the market model method and the market adjusted return method (Weston, Siu and Johnson, 2001). However, since
the market model takes account of both the risk associated with the market and mean returns, it will be used in this thesis.
This chapter focuses on the econometric methodology of event studies. Section 4.1 summarizes the procedure for carrying out an event study. Section 4.2 explains the features of the market model and section 4.3 defines the test statistics under the null hypothesis.
4.1 Event Study Procedure
According to Campbell, Lo and MacKinlay (1997) the structure of the event study can be viewed as having seven steps. These are:
1. Event definition. The first step in the event study is to define the event of interest and set the period over which the stock prices of the firms involved in this event will be examined-the event window. In this thesis corporate takeovers in Sweden will be studied and the event window will be set 60 days prior to the announcement day and 60 days after the announcement day.
2. Selection criteria. The next step, after identifying the event of interest, is to determine the selection criteria for the firms in the study. It involves restrictions imposed by data availability from the stock exchanges in each country.
3. Normal and abnormal returns. For evaluating the event’s impact a measure of the abnormal return is needed. The abnormal return is the actual ex post return of the security over the event window minus the normal return of the firm over the event window. The normal return is defined as the return that would be expected if the event did not take place. The formula looks as follows:
= it
r Rit- Rˆ it (4.1)
where rit,Rit and Rˆ are the abnormal, actual and normal returns for each it firm i and for time period t.
4. Estimation procedure. To estimate the parameters of the model a subset of the data must be used, known as the estimation window. The most common choice is to use the period prior to the event window.
5. Testing procedure. With the estimated parameters, the abnormal returns can be calculated. Also determining the techniques for aggregating the abnormal returns and defining the null hypothesis are included in this chapter.
6. Empirical results. The econometric result, based on the econometric design, will be presented in the following chapter.
7. Interpretation and conclusions. Based on the empirical results conclusions can be drawn on how the event affects stock prices.
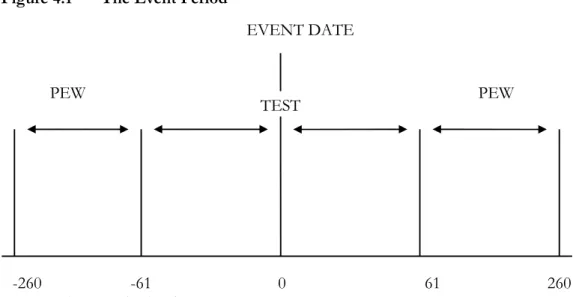
To get an overview over the entire event period the diagram below can help illustrate this. The parameters of the regression model are estimated using the data for days -260 to -61 and +61 to +260. In the diagram PEW represents the parameters estimation window [-260: -61] and [61:260]. TEST represents the event window [-60:60].
Figure 4.1 The Event Period
EVENT DATE
Source: Dyckman, Philbrick and Stephan, 1984
4.2 The Market Model
The market model is a statistical model which relates the return of any given stock to the return of the market portfolio. The expected firm return is a linear function of the market return using an ordinary least square (OLS) beta. To attain the values of α and β a calculation is made over the estimation window (Dyckman, Philbrick and Stephan, 1984). For any stock i we have:
it R = it i i β ε α + Rmt+ (4.2) E
[ ]
εit = 0 Var[ ]
2ε
i
it σ ε = ,where Rit and Rmt are the period-t returns on stock i and the market index, respectively, and εit is the statistical error term. αi, βi and
2
ε
i
σ are the parameters of the market model. βi measures the sensitivity of firm i to the market and αi measures the mean return over the period not explained by the market. Regression (4.2) produces estimates of
i
α and βi: call these αi )
andβi )
. The normal return for a firm for a day in the event window is the return given by the market model on that day using these estimates. The normal return is then given by the formula:
Rit αi βiRmt ) ) ) + = (4.3)
where now Rmt is the return on the market index for the actual day in the event window. The market model has some advantages compared to other models since it removes the portion of the return that is related to variation in the market’s return. Thus, the variance of the abnormal return is reduced and this can lead to increased ability to detect event effects (Campbell, Lo and MacKinlay, 1997).
The normal return takes into account the riskiness of the firm with respect to the market. The regression for the firm return is runned against a market index and involves a
calculation based on a period not included in the event window. For this clean period 200 TEST
PEW PEW
days prior to the event window is used and then regressed against a market index which represents an aggregate of stocks.
When all variables in formula (4.1) are attained, the abnormal return is averaged across firms to produce the average abnormal return for that day (ARt), where
N r AR i it t
∑
= (4.4)and N is the number of firms in the sample. The abnormal return is the part of the return that is not predicted and is therefore an estimate of the change in firm value on that day caused by the event. The reason for calculating the average abnormal return is because stock returns tend to be “noisy”, but when averaging across a large number of firms this noise is cancelled out (Weston, Siu and Johnson, 2001).
The next step is to cumulate the average abnormal return for each day in the event window to produce the cumulative average abnormal return, CAR:
∑
− = = 60 60 t t t AR CAR , (4.5)which represents the average total effect of the event of all firms over the event window.
4.3 Test Statistics Under the Null Hypothesis
Given the abnormal returns based on the market model, the values have to be tested for their statistical significance using a t-test to see if the returns are significantly different from zero. The null hypothesis to be tested is that the mean day “0” abnormal return is equal to zero. The alternative hypothesis must then be that the mean day “0” return is everything else but zero.
The two hypotheses are:
H0: ARt = 0 H1: ARt ≠ 0.
The null hypothesis states, that the announcement has no impact on the event and thus no impact on returns to shareholders. Conversely, the alternative hypothesis states that the announcement has some impact on the event and on the returns to shareholders. The test statistics is the ratio of the day “0” mean abnormal return to its estimated standard deviation; where the standard deviation is estimated using data from the estimation period (Brown and Warner, 1985). The test statistic for any event day t (in this case t = 0) is
) ( ˆ t t S AR AR (4.6) where − =
∑
− = − = 199 ) ( ) ( ˆ 2 61 260 t t t t t AR AR AR S (4.7)∑
− = − = = 61 260 200 1 t t t t AR AR . (4.8)If the average abnormal return is independent and identically normally distributed, the test has a t-distribution. For more than 30 degrees of freedom (in this case 199) the test statistic is assumed unit normal. Only if the test statistic ratio is greater than a specified critical value one can reject the null hypothesis with some degree of confidence.
For tests over the (-60, +60) interval, the test statistic is the ratio of the cumulative average abnormal return to its estimated standard deviation, and is given by
(
)
2 / 1 60 60 2 60 60 ˆ ∑
∑
+ − + − t t S AR AR (4.9)where the terms in the denominator are from equation (4.7)(Brown and Warner, 1985).
5 Empirical Results and Analysis
In table 5.1 the average abnormal return and cumulative abnormal return values of different lengths around the event day are reported. These figures for the acquiring companies are calculated using the market model, presented in chapter four. For this, an estimation window (-260, -61) is applied. The first row of table 5.1 reports the cumulated abnormal return for the 121-day (-60, +60) window around the event day. The second and third row reports the cumulated abnormal return in the 6-day (-5, 0 and 0, +5) windows. The fourth row reports the average abnormal return on the event day. One can see that the average
Table 5.1 Event Period Results
Variable description Mean Std. Deviation Min Max.
CAR (-60,+60) -6,07147e-005 (t= -1,24) 0,00593 -0,01493 0,01726 CAR (-5,0) -0,00371 (t= -3,96)*** 0,00563 -0,00906 0,00368 CAR (0, +5) -0,00387 (t= -2,67)*** 0,00869 -0,01493 0,01113 AR 0 -0,00906 (t= -1,66)* 0,00546 -0,01614 0,01735
Note: *, **, *** denote significance at the 10%, 5% and 1% levels, respectively.
cumulated abnormal return in the (-60, +60) window amounts to only -0.00607 percent with a t-value of -1.24, indicating that the null hypothesis cannot be rejected. The average cumulated abnormal return in the 6-day windows amounts to -0.371 percent (for the period six days prior to the event) and to -0.387 percent (for the period six days after the
event), both with t-values indicating statistical significance at the 1% level. The average abnormal return on the event day is -0.906 percent with a t-value of -1.66, which is significantly different from zero at the 10% level.
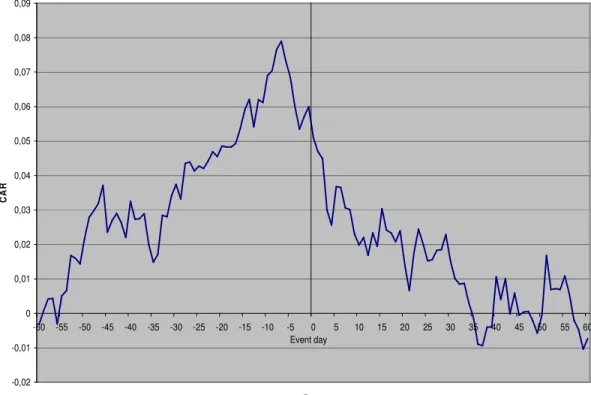
The pattern for the acquiring companies is illustrated in figure 5.1, constructed from the data reported in the previous section. The acquiring firms begin to earn positive abnormal returns 59 days prior to the announcements. These cumulate to 5.1 percent by the announcement day. On that day, day 0, the bidders lose on average 1 percent. From day 0 to
Figure 5.1 CAR for Acquiring Companies
-0,02 -0,01 0 0,01 0,02 0,03 0,04 0,05 0,06 0,07 0,08 0,09 -60 -55 -50 -45 -40 -35 -30 -25 -20 -15 -10 -5 0 5 10 15 20 25 30 35 40 45 50 55 60 Days C A R Event day
60 days after the announcement the cumulative abnormal returns fall 5.8 percent. Thus, over the 60 days following the takeovers, the acquirers’ shareholders lost all of the gains that they experienced over the 60 days leading up to them.
These results support earlier studies in the finance literature on takeovers (Morck et al., 1990, Houston and Ryngaert, 1994, Smith and Kim, 1994, Hubbard and Palia, 1995, Doukas, 1995). They all found results with similar patterns that the acquiring firms earn positive abnormal returns prior to the announcement. Thereafter, the announcement day and the post-announcement day returns show negative results. Which one of the theories in chapter 3 that are consistent with the findings for the entire period (-60, +60), cannot be determined due to the lack of statistical significance for that period.
If one was to focus on the 6-day (-5, 0 and 0, +5) windows one can conclude that the agency motive and/or the hubris hypothesis accounts for these takeovers. These two periods are significantly different from zero and the negative results rule out that synergy is the motive behind the takeovers. Synergy predicts that adding two units together creates some sort of gain, 2 + 2 = 5. This is what the early finance literature predicted would be the case regarding diversification takeovers. However, the outcome of the synergies from
diversification, following the end of the stock market boom of the 1960s, turned out into the opposite – two plus two became equal to three. These findings are supported by Morck et al. (1990), who in their study have reported losses to acquirers’ shareholders at the time diversification takeovers are announced.
In support for the agency motive of takeovers, Hubbard and Palia (1995) reports that the gains for acquiring firms’ shareholders were positively related to the managers’ stakes in their companies. Managers with small stakes simply pay too much when they acquire a target firm, causing their shareholders to lose money.
In a study made by Mueller and Sirower (2002), they regressed the gains to the acquiring companies’ shareholders onto the gains to the targets, and found a negative relationship. The more acquirers pay, the more they lose. This is in line with what both the agency motive and the hubris hypothesis predict.
A different task is to make an argument for what the abnormal returns for acquiring firms should be. Looking at figure 5.1 again the graph might seem to be quite dramatic. But when studying the development over the different windows one can clearly see that the abnormal returns are not that big. In fact, the biggest cumulated abnormal return (-0.387 percent) can be seen in the period six days after the event. The cumulated abnormal return for the entire period (-60, +60) is -0.00607 percent, which is practically zero. An abnormal return reflects the unexpected future economic rents arising from the takeover. Thus if one disregards the fact that the 121-day window is not statistically significant, it reflects, at least from the acquirer’s point of view, a fair rate of return.
Comparing takeovers with empirical studies of other investment decisions, such as research and development, capital expenditures, joint ventures, and product introductions, which typically report very small (less than one percent) abnormal returns at the announcement of the investment, abnormal returns for acquirers look pretty much the same as those for other types of investments. Consequently, the evidence shows that it is hard for firms to consistently make investment decisions that earn large economic rents, which perhaps should not be too surprising in a competitive economy with a fairly efficient capital market (Andrade, Mitchell and Stafford, 2001).
A question one can ask is that, if managers of acquiring firms are trying to maximize their shareholders’ wealth, why do they repeatedly undertake highly risky investments like takeovers, which have near zero expected returns? Furthermore, the behavior of acquirers’ managers often brings doubts when it comes down to how they behave when they negotiate their compensation contracts. It seems to be the case that the more risk averse the manager is, the more his compensation contract resembles a fixed wage. The empirical literature on managerial compensation by Jensen and Murphy (1990) and by Rosen (1992) implies that managers are highly risk averse, since their compensation is very weakly tied to the wealth of their shareholders. The answer to why managers are on one hand highly risk averse when it comes to negotiating their compensation contracts, and on the other willing to gamble when they become bidders in the market for corporate control, is quite simple. The obvious answer is that in one case it is their own income that is at issue, and in the other it is someone else’s. This is what Hubbard and Palia (1995) found support for when they studied the relationship between the fraction of shares owned by acquirers’ managers and the return to its shareholders from an acquisition. This finding is consistent with both the agency motive and the hubris hypothesis.
6 Conclusion and Further Research
With the help of the market model this thesis studied whether acquiring firms’ stock prices were affected or not, following takeover announcements. Using a sample of takeovers performed in Sweden during 1997-2005, these hypotheses were tested. The analysis yields several interesting results. It was found that shareholders of the acquiring firms experienced losses during the 121-day window that was tested (-60, +60), with statistically significant results attained for the 6-day (-5, 0 and 0, +5) windows and for the event day. Even though the sample (28 acquiring firms) is relatively small, the results demonstrate that takeovers are on average value decreasing operations for acquiring firms, and this is also what a profusion of the finance literature has stated.
According to the three major reasons for takeovers, the attained negative results indicate that one can exclude that the majority of the takeovers are motivated by synergy. Negative returns to the acquiring firms’ stockholders imply that the takeovers are motivated by agency problems or by hubris. However, what the dominating reason is – agency or hubris cannot be determined because required return figures for the target firms’ stockholders have not been tested.
Surprisingly or not, it is a fact that takeovers do not seem to benefit acquirers. It may be that the takeovers that are undertaken for good reasons, like synergy, are in the statistics cancelled out by takeovers undertaken for less favorable reasons, like empire building behavior by managers.
As noted in earlier discussion, one can not clearly determine what the motives for takeovers are without having access to abnormal return figures for both the acquiring and the target companies. For future research, it would be interesting to see how the takeover announcements of the Swedish companies that were used in this study affect shareholders of the target firms. If these figures were attained one could clearly determine what motivates the takeovers.
References
Amihud, Y. and B. Lev (1981), “Risk Reduction as a Managerial Motive for Conglomerate Mergers”, Bell Journal of Economics, 12, 605-617.
Andrade, Gregor, Mark Mitchell and Erik Stafford (2001), “New Evidence and Perspectives on Mergers”, Journal of economic Perspectives, 12, No. 2, 103-120. Berkovitch, Elazar and M. P. Narayanan (1993), “Motives for Takeovers: An Empirical
Investigation”, Journal of Financial and Quantitative Analysis, 28, No. 3, 347-362. Bradley, M., A Desai and E. H. Kim (1988), “Synergistic Gains from Corporate
Acquisitions and Their Division between the Stockholders of Target and Acquiring Firms”, Journal of Financial Economics, 21, 3-40.
Brown, Stephen J. and Jerold B. Warner (1985), “Using daily Stock Returns: The Case of Event Studies”, Journal of Financial Economics, 14, 3-31.
Campbell, John Y., W. Andrew Lo and A. Craig Mackinlay (1997), “The Econometrics of Financial Markets”, Princeton University Press.
Cartwright, Sue and Cary L. Cooper (1996), “Managing Mergers, Acquisitions and Strategic Alliances”, Butterworth-Heinemann.
Doukas, John (1995), “Overinvestment, Tobins q and Gains from Foreign Acquisitions”, Journal of Banking and Finance, 19, 1185-303.
Dyckman, Thomas, Donna Philbrick and Jens Stephan (1984), “A Comparison of Event Studies Methodology Using Daily Stock Returns: A Simulation Approach”, Journal of Accounting Research, 22, 1-30.
Fama, Eugene F. (1998), “Market Efficiency, Long-Term Returns, and Behavioral Finance”, Journal of Financial Economics, 49, 283-306.
Gaughan, Patrick A. (1996), “Mergers Acquisitions, and Corporate Restructurings”, John Wiley & Sons, Inc.
Houston, Joel F. and Michael D Ryngaert (1994), “The Overall Gains from Large Bank Mergers”, Journal of Banking and Finance, 18, 1155-76.
Hubbard, R. Glenn and Darius Palia (1995), “Benefits of Control, Managerial Ownership, and the Stock Returns of Acquiring Firms”, Rand Journal of Economics, 26, 782-92.
Jensen, Michael C. (1986), “Agency Cost of Free Cash Flow, Corporate Finance, and Takeovers”, American Economic Review Proceedings, 76, 323-329.
Jensen, Michael C. and R. Ruback (1983), “The Market for Corporate Control: The Scientific Evidence”, Journal of Financial Economics, 11, 5-50.
Jensen, Michael C. and Kevin J. Murphy (1990), “Performance Pay and Top-Management Incentives”, Journal of Political Economy, 98(2), 225-64.
Malesta, P. (1983), “The Wealth Effect of Merger Activity and the Objective Functions of Merging Firms”, Journal of Financial Economics, 11, 155-181.
Mandelker, G. (1974), “Risk and Return: The Case of Merging Firms”, Journal of Financial Economics, 1, 303-335.
Mitchell, Mark L. and Erik Stafford (2000), “Managerial Decisions and Long Term Stock Price Performance”, Journal of Business, 73, 287-329.
Morck, Randall, Andrei Schleifer and Robert W. Vishny (1990), “Do Managerial Objectives Drive Bad Acquisitions?”, Journal of Finance, 45, 31-48.
Mueller, Dennis C. and Mark L. Sirower (2002), ”The Causes of Mergers: Tests Based on the Gains to the Acquiring Firms’ Shareholders and the Size of Premia”, Managerial and Decision Economics, in press.
Mueller, Dennis C. (2003), “The Corporation – Investment, mergers, and growth”, Routledge.
Roll, Richard (1986), “The Hubris Hypothesis of Corporate Takeovers”, Journal of Business 59, 2, 197-216.
Rosen, Sherwin (1992), “Contracts and the Market for Executives”, in L. Werin and H. Wijkander (eds), Contract Economics, Oxford: Basil Blackwell, 181-211.
Ross, Stephan A., Randolph W. Westerfield and Jeffrey Jaffe (1996), “Corporate Finance”, Times Mirror Higher Education Group.
Smith, Richard L. and Joo-Hyun Kim (1994), “The Combined Effects of Free Cash Flow and Financial Slack on Bidder and Target Stock Returns”, Journal of Business, 67, 281-310.
Schleifer, A. and R. Vishny (1989), “Managerial Entrenchment: The Case of Manager-Specific Investments”, Journal of Financial Economics, 17, 293-309.
Weston, J. Fred, Juan A. Siu and Brain A. Johnson (2001), “Takeovers, Restructuring and Corporate Governance”, Prentice-Hall, Inc.
Weston, J. Fred and Samuel C. Weaver (2001), “Mergers and Acquisitions”, McGraw-Hill Executive MBA Series.
Internet Sources
Appendix
Table A Selected Acquiring Companies
Acquirer List Company Acquired Announcement Date
Balder AB A-list PriFast 1999-03-01
Bergman-&-Beving AB O-list FB-Industri Holding AB 2000-10-06
Eniro AB O-list Scandinavia Online AB 2001-11-20
Finnveden AB O-list Bulten AB 2000-09-21
Hufvudstaden AB A-list NK Fastigheter 1998-03-30
Jacobson-&-Widmark AB A-list Kjessler-&-Mannerstråle 2000-06-16
LGP Telecom Holding AB A-list Allgon AB 2003-01-21
Lindab AB OTC-list Folkebolagen 2000-05-08
Lundin Mining O-list North Atlantic Natural Resources 2005-01-21
Matteus AB A-list JP Bank 1999-01-19
NCC AB A-list SIAB 1997-02-17
Nocom AB O-list I.A.R. Systems AB 2004-12-22
ProAct-IT-Group AB O-list Dimension AB 2003-11-24
Ratos AB O-list Tornet, Fastighets AB 2003-10-20
SAAB AB A-list Celsius AB 1999-11-16
Sands-Petroleum AB O-list IPC 1997-09-01
Scandic-Hotels AB O-list Provobis 2000-04-12
Scania AB O-list Ainax-AB 2004-11-19
Sigma AB O-list RKS AB 2004-05-06
Sveaskog A-list AssiDomän AB 2001-10-10
Teleca AB O-list AU-System-AB 2001-12-10
TietoEnator AB O-list Entra Data AB 2000-05-15
TMT One AB O-list Johnson Pump AB 2001-12-14
Tornet Fastighets AB O-list SIFAB 1998-02-18
Trelleborg AB A-list Skoogs 1997-08-25
TurnIT O-list Arete AB 2000-09-13
Wedins Skor &
Accessoarer
O-list Wilkenson Handskmakarn 1999-10-04
Vision Park Entertainment O-list Independent-MediaGroup 2001-02-12